The purpose of this project is to showcase the results of Roza's research. Roza has a completed panel for demographic information and would like to visualize the bacteria data for each volunteer. The volunteers should be able to identify the top 10 bacterial species found in their belly buttons. Additional data to visualize is how many times per week the selected volunteer scrubbed their belly button, and a bubble map to show the bacteria cultures per sample from a volunteer.
- Use Plotly to create diverse group of plots.
- Use D3.json() to import external data.
- Use functional programming in JavaScript to manipulate data.
- Use event handlers in JavaScript to give interactivity to data visualization.
- Deploy interactive charts to GitHub Pages
To open the Plotly Belly Button Biodiversity website use the link here: Belly Button Biodiversity Interactive Webpage.
After clicking on the link above you are greeted with the customized website. Bootstrap and HTML componets were used to add background images and colors, text and chart layout, and font customization. There is a brief explination of the website and the ID selection box, where a user can select the data they want to veiw based off the ID numbers. The demographics for the selected volunteer are listed in the demographics box.

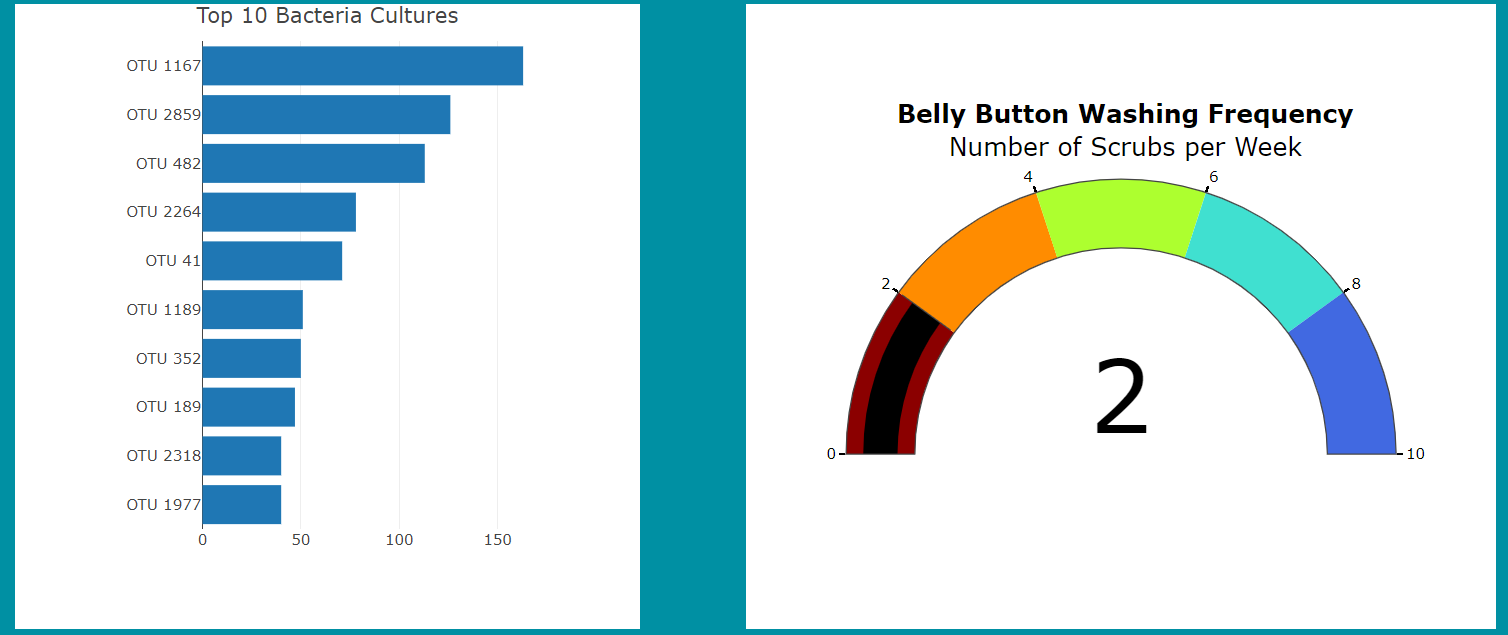
Scrolling down the page you will see the 'Top 10 Bacteria Cultures' bar chart, that will give additional data on the bacteria when the bar is hovered over. There is also the 'Bully button Washing Frequency' gauge that list shows how many times per week the selected volunteer scrubs thier belly button.
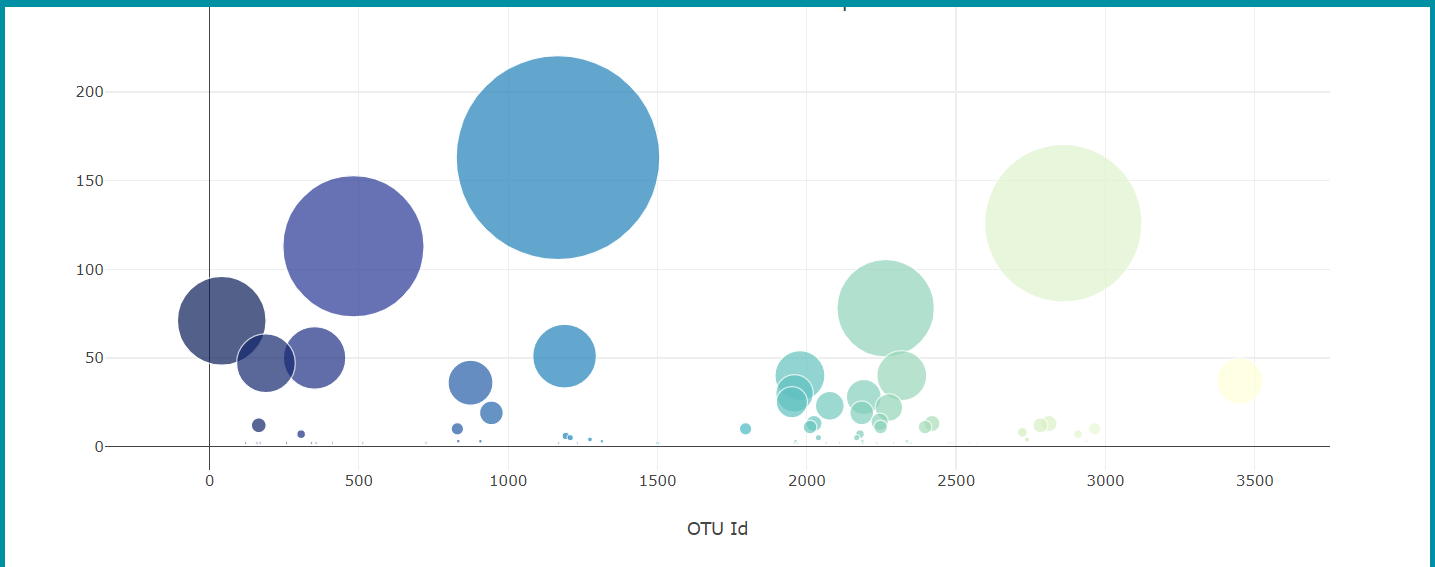
At the bottom of the page is the 'Bacteria Culturs Per Sample' bubble chart, if a user hovers over a bubble the additional information on the bacteria will appear.