Extreme spacing with large numbers of subplots #13018
Description
Bug report
Bug summary
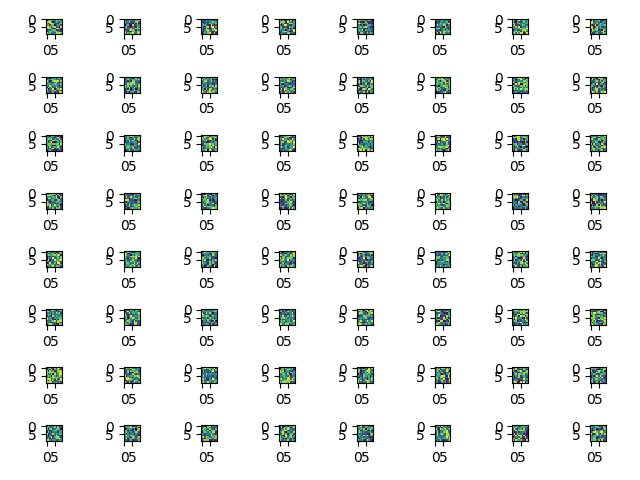
Subplots decrease in size with increasing numbers of subplots, but with non-square grids of subplots, the padding along the short axis is not correspondingly decreased. As a result, the padding between subplots grows extremely large with large numbers of subplots. This can be manually fixed with wspace and hspace in subplots_adjust(), but only for a given size of subplot, so a user needs to model the padding growth in order to adequately correct it. Tight_layout() only makes the spacing equally way too large along both axes.
Code for reproduction
import matplotlib.pyplot as plt
from numpy import random

n = 8
fig = plt.figure()
for i in range(2*n):
  ax = fig.add_subplot(2,n,i+1)
  ax.imshow(random.random((10,10)))
plt.savefig('{:0}_col_test.png'.format(n))
fig = plt.figure()
for i in range(2*n):
  ax = fig.add_subplot(n,2,i+1)
  ax.imshow(random.random((10,10)))
plt.savefig('{:0}_row_test.png'.format(n))
Actual outcome


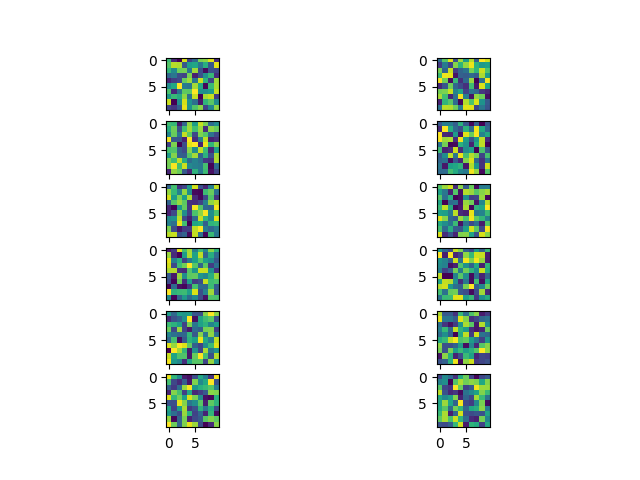
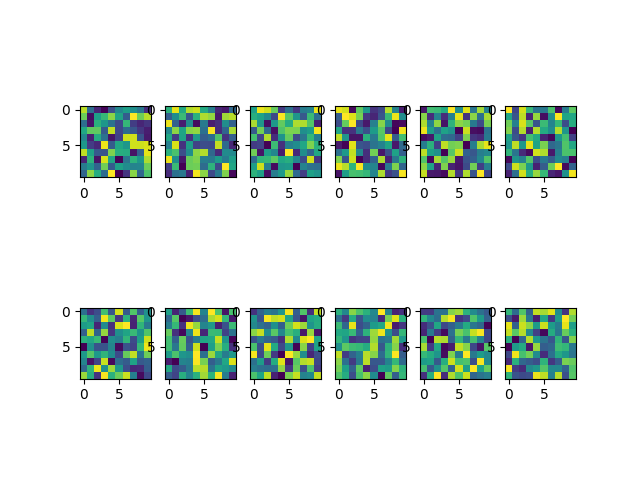
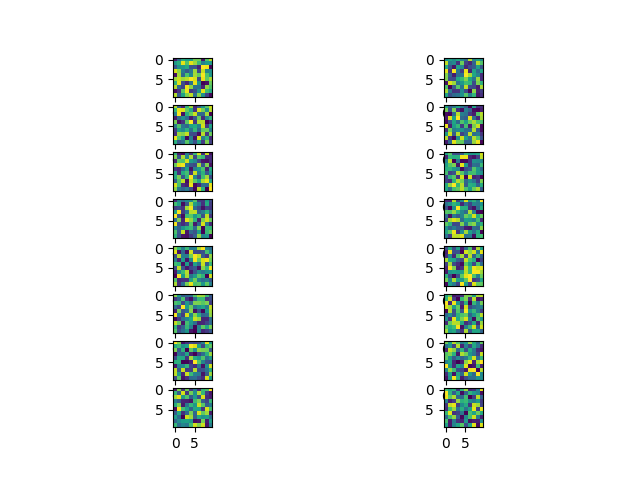
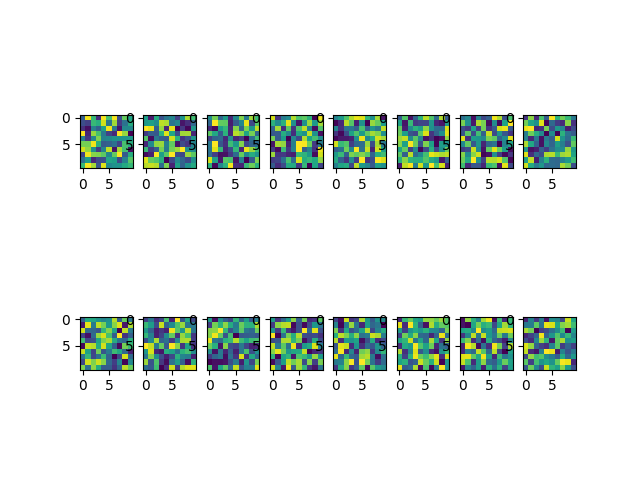

With tight_layout():
Expected outcome
I would have expected constant figure padding with number of subplots.
Matplotlib version
- Operating system: Debian Stretch
- Matplotlib version: 3.0.2 (from pip)
- Matplotlib backend (
print(matplotlib.get_backend())): TkAgg - Python version: 3.5.3
- Jupyter version (if applicable):
- Other libraries: