How to show the detail of a sound plot #18207
Description
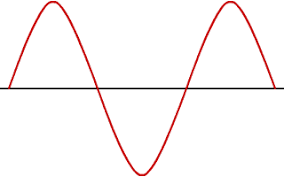
In Figure 1, the plot can be seen more detailed than that of Figure 2, it may because the recording duration of Figure 1 is less. However, I would like to see the more detailed and more micro-viewed of Figure 1 without reducing the recording duration, kind of like Figure 3 (just an sample) which is more detailed and can be easily analyzed. Is there any approach to "zoom" the plot result and keep the detailed resolution simultaneously?
Many thanks!
Figure 1.
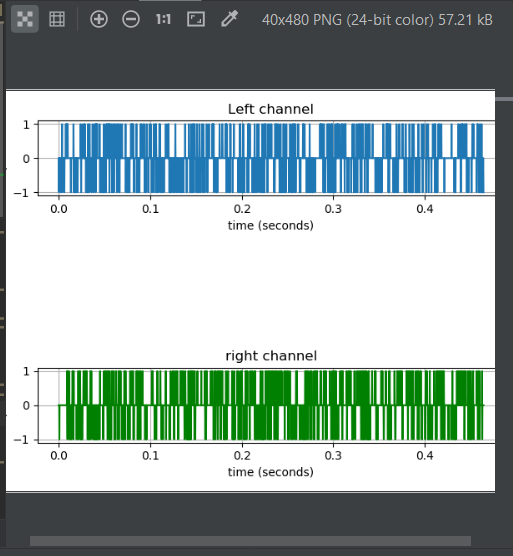
Figure 2.
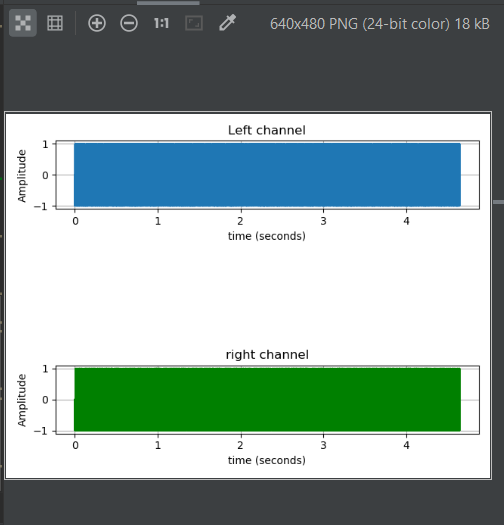
Figure 3.
Code for reproduction
import wave
import matplotlib.pyplot as plt
import numpy as np

f = wave.open(r"output.wav", "rb")

params = f.getparams()
nchannels, sampwidth, framerate, nframes = params[:4]

str_data = f.readframes(nframes)

f.close()

wave_data = np.frombuffer(str_data, dtype=np.short)

wave_data = wave_data*1.0/(max(abs(wave_data)))

wave_data = np.reshape(wave_data,[nframes,nchannels])

time = np.arange(0, nframes) * (10.0 / framerate)

plt.figure()
plt.subplot(3,1,1)
plt.plot(time, wave_data[:,0])
plt.xlabel("time (seconds)")
plt.ylabel("Amplitude")
plt.title("Left channel")
plt.grid()

plt.subplot(3,1,3)
plt.plot(time, wave_data[:,1], c="g")
plt.xlabel("time (seconds)")
plt.ylabel("Amplitude")
plt.title("Left channel")
plt.title("right channel")
plt.grid()

plt.show()