Fix ConciseDateFormatter when plotting a range included in a second #17269
Conversation
When micros only are changing (we are zoomed inside a second),
the formatter previously computed a level 0 : year,
displaying only years... when microseconds were expected.
|
Fair enough. The current I can also simply add a separate test only for that little part of logic. |
|
I am adding just a separate test for now showing the bug fixed by this PR, it is called |
There was a problem hiding this comment.
I don't see a problem with this. We didn't implement it at first, because microsecond dates were so problematic, but with the new epoch that is less of a problem. But maybe a few more cases could be tested to make sure? I'm also not sure how "concise" these dates are going to be, but not sure you can do anything about that.
I forget, what happened at millisecond resolution before?
| year_1996 = 9861.0 | ||
| strings = formatter.format_ticks([ | ||
| year_1996, | ||
| year_1996 + 500 / mdates.MUSECONDS_PER_DAY, |
There was a problem hiding this comment.
Thanks for the test. What happens if it is year_1996 - 200 / us, year_1996, year_1996 + 200 / us? Also it would be good to know what the offset text says for these cases.
There was a problem hiding this comment.
with -200 +200 there are 2 different second values (59 and 00) so the original code compute level 5 correctly and you get ["59.9998", "00.0002"]
|
I do believe it is a bug and not the original dev not willing to do something about it. The code is full of things to allow displaying correctly the fractional part of seconds. And it affects plotting milliseconds or anything subsecond not just microseconds. Maybe I should have made that clear in my tiny test, but a range of almost a second |
|
For the conciseness part the result, it could definitely be improved with levels bellow level 5 ( mostly meant to print seconds with fractional part "%S.%f" ) I personally would greatly benefit from a 'millisecond' level. |
|
For the offset part, well it is correctly done once the level is correctly computed. |
|
We could consider adding milliseconds. Again, we did have logic for smaller levels, but the round off errors due to the old epoch being so far from modern meant this largely returned nonsense anyway. The general approach was to steer folks away from fine-grained times if they need sub-second resolution (which I still think is safest. Do you really need to know when 07:00 was if you are interested in milli-second signals?) |
|
I have 1khz data spanning many days (or weeks) at a time, which I regularly plot as a whole and zoom in sections, sometimes zooming in as much as to the ms scale. But in general, if the data is timestamped even short sections of it are nice to plot and have the offset show the full date. Numpy and pandas now handle dates in a sane way so I guess many people are banging their head with matplotlib strange subsecond behaviours and issues. At least I have for many years and I usually end up doing axis ticks by hand for plots I want to share.... |
|
OK, so we can either put this in as is, or fix the logic to re-introduce "level == 6". I guess I'd favour the latter now that milliseconds in modern dates can be properly round-tripped in |
| for level in range(5, -1, -1): | ||
| if len(np.unique(tickdate[:, level])) > 1: | ||
| break | ||
| elif level == 0: |
There was a problem hiding this comment.
I think we should just re-introduce level 6, and have proper format for that level.
There was a problem hiding this comment.
@leolchat did you have any interest in moving this forward, or should I convert to an issue. I still think this should get its own level, versus assuming level==0 is level 5.
There was a problem hiding this comment.
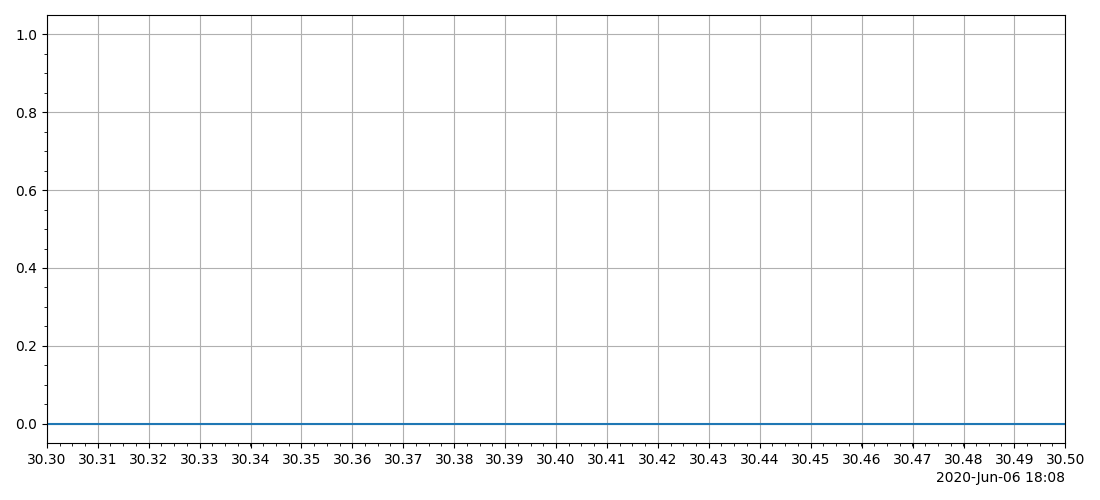
if we reach level == 0 without calling break, it means that every level tested has one unique value, which is what happens when the only differences between ticks are sub-second:
[ 2020-06-06 18:08:30.4, 2020-06-06 18:08:30.5, 2020-06-06 18:08:30.6, 2020-06-06 18:08:30.7]
(That is what the test I added is testing)
There was a problem hiding this comment.
If it was not subsecond, then it would be the unit above years, which doesn't exist in datetime.
|
I see that newer version of matplotlib now allow to set the epoch date with level == 6 meaning microseconds would be not too hard, but level 6 meaning milliseconds will be quite hackish (not allow easy format change by the user) since python For level 6 do you have a reference to some old code? |
Sorry that was all squashed out ;-). But we could add a millisecond and microsecond level and change the formatting at those levels. |
|
Just a remark reading your comment that |
|
Custom formats for zeros are the whole point of If you are interested in kHz data I agree that may not be so useful but for normal dates it’s a huge space savings without loss of information. If you wanted to work on either formatter to get what you want, I’m sure that would be welcome. |
|
Well, Pandas as some auto formatters they register for their It is a bit sad to have so many parallel piece of code trying to do the same thing. I am not sure whether I would spend more time trying to improve/fix the pandas or the matplotlib one. One thing is sure, there is also a lot of possible improvement when plotting |
| for level in range(5, -1, -1): | ||
| if len(np.unique(tickdate[:, level])) > 1: | ||
| break | ||
| elif level == 0: |
There was a problem hiding this comment.
@leolchat did you have any interest in moving this forward, or should I convert to an issue. I still think this should get its own level, versus assuming level==0 is level 5.
|
I have fixed it differently on my local computer because the code has other bugs, one in particular: if out of luck you end up with ticks having all the same seconds but not all the same minutes, you might end up using the level matching seconds. Which makes the definition of the level clear: level is the biggest unit which has more than one value. This makes clear what the offset needs to be (everything above that level is common to all ticks so it doesn't need to be printed more than once). Clearly the original programmer went out of his way to not write that, so there must be reasons. I suspect I have other changes required for this clean definition of level to work. My local version of matplotlib is quite hacked. This PR is still a good small patch in my opinion, fixing the current logic for that exact problem. Do you see any downside of this code? (an example which was working before but doesn't now?) |
|
Can you elaborate on that bug with an example? I'm the original programmer 😉 but make no claims that what I did is perfect... Level 0 is supposed to be for multiple years, so I'm not clear how setting microseconds to that level solves any problems. But I admit I'm confused why that doesn't break the tests. |
|
The other bug is if we have: The current code is testing level 5 first (seconds), there are 2 different seconds so it will declare that the level which matters is at the seconds and the offset displayed will be |
|
I left another comment explaining this patch with maybe a better explanation below your review. |
Can you post complete examples? I can't reproduce what you are saying. import matplotlib.pyplot as plt
import numpy as np
plt.rcParams['date.converter'] = 'concise'
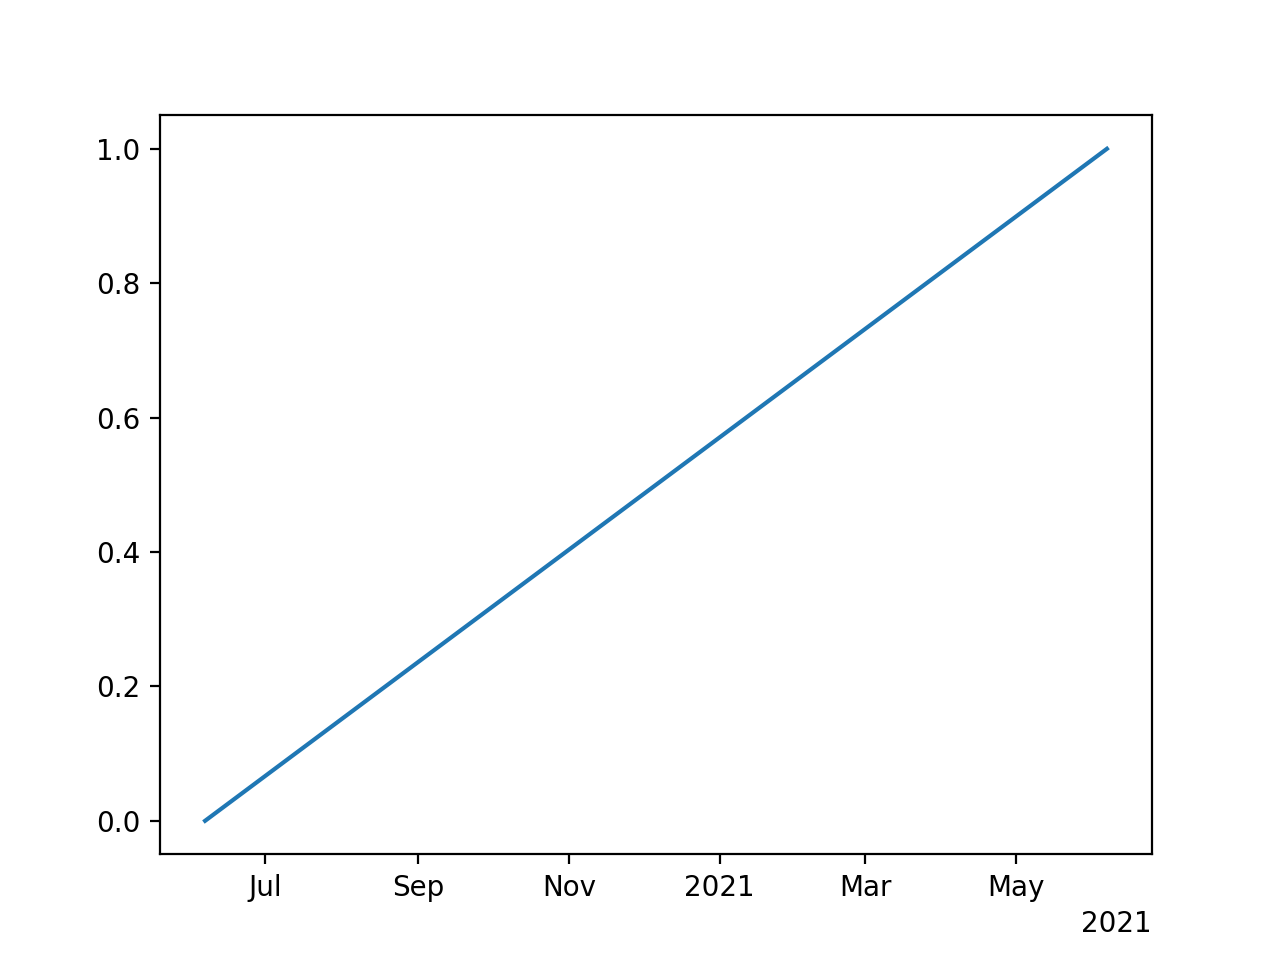
dates = [np.datetime64( '2020-06-06 18:08:30'), np.datetime64('2021-06-06 18:08:31')]
fig, ax = plt.subplots()
ax.plot(dates, [0, 1])
plt.show()gives Level 1, as expected:
|
|
The bug happens when the ticks are only those values, not when the data points are. (Since the code we are talking about works on tick values, not on data point). |
|
Oh, OK, I see. that's strange: import matplotlib.pyplot as plt
import numpy as np
print(plt.rcParams.keys())
plt.rcParams['date.converter'] = 'concise'
dates = [np.datetime64( '2020-06-06 18:08:30'), np.datetime64('2021-06-06 18:08:31')]
fig, ax = plt.subplots()
ax.plot(dates, [0, 1])
ax.set_xticks(dates)
plt.show() |
|
... but that can only really happen if you've set the ticks manually? |
|
It happens in fairly common situations. I virtually never set the ticks manually, but I have seen that bug many times. I remember it being easy to trigger when zooming in and out. |
|
Changing the definition of what is a level seems a bit more than the goal of this current PR. And if one wants I would really push to get level being defined cleanly like something I suggest #17269 (comment) |
|
Using the AutoLocator? |
|
I believe so, if not, one of the other usual locator. |
|
The code goes backwards to test the level because you want the level to be at the smallest non-repeating level. i.e. you could have "2012, Apr, Jul, Oct, 2013, Apr" and that can't be at the annual level (0) because you want the months to be labelled (i.e. level 1). So your patch above can't work as is. Usually the seconds tick in the |
|
Just to be clear: import matplotlib.pyplot as plt
import numpy as np
plt.rcParams['date.converter'] = 'concise'
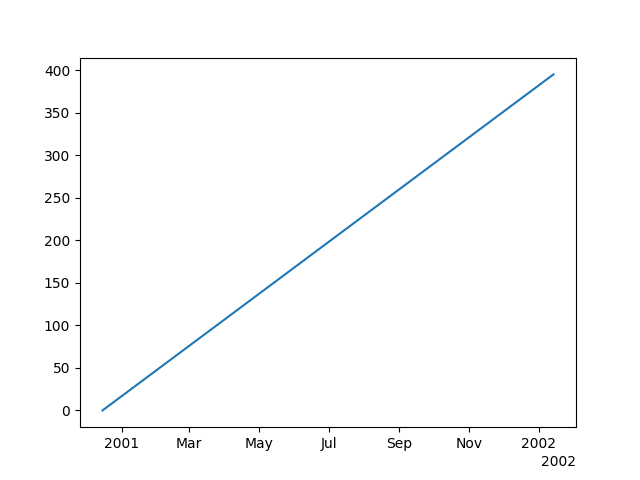
dates = np.arange('2000-12-15', '2002-01-15', dtype='datetime64[D]')
fig, ax = plt.subplots()
ax.plot(dates, np.arange(0, len(dates)))
plt.show()Master:
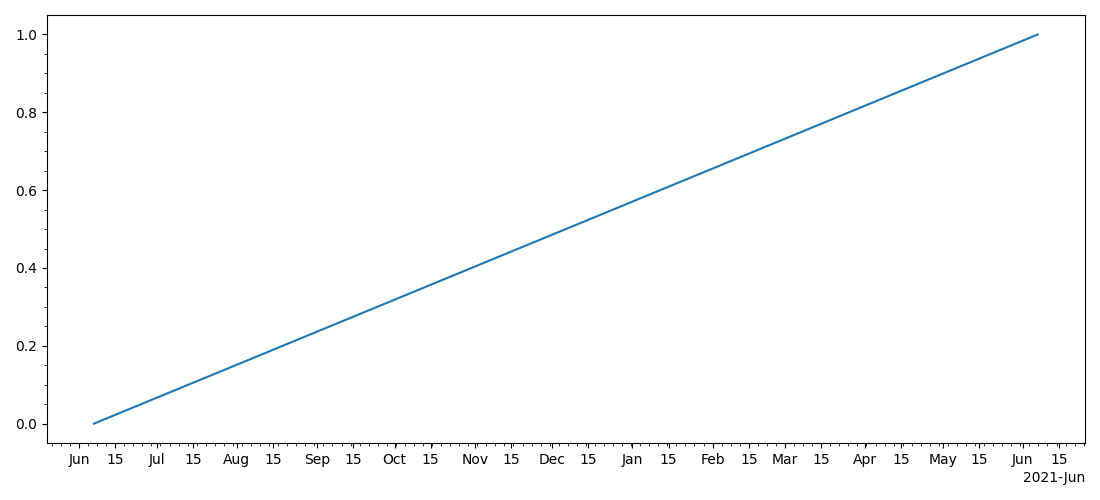
your proposed change:
|

|
I find it confusing to have 2 parallel discussions here, this PR is not about the definition of level, it is a fairly straightforward bug fix. Do you mind talking about your last point in a separate issue maybe? I might have a bit of time next week to play around and find you examples breaking the current definition of levels. |
|
PS all your examples use |
|
The discussion about levels is because I'd like us just to use a level 6 for milliseconds, rather than just falling back to level 5. But you are saying its possible for seconds or milliseconds to not be zero if the ticks span months or years which is a more fundamental issue with the algorithm if that can actually happen. |
|
master has |
|
Ok, so we keep all in the same thread. I never proposed to only change the computation of level, I proposed to change its definition and I said I have a bunch of other changes to make it work. My goal is that it doesn't rely on some special property of the locator (in my opinion a formatter should give decent result what ever the locator or even when users provides their ticks). When using Which starts to be confusing, ticks are misaligned (not really the formatter fault...) and mostly the offset doesn't apply to most of the range and one can easily read that the start is in 2021. The current algorithm is very brittle, relies on |

|
using There are no |
|
Then if one zoom in, it will hit the bug that this PR fixes. zoom by hand or directly using |

|
For this PR I would like a level 6, instead of just putting it to level 5 if no level is found. Again, if you dont' want to do that, I understand, and I will address the bug above in a different PR (#17269 (comment)). #17269 (comment) looks to be a bug.... |
|
The bug just above (#17269 (comment)) is fixed by this PR. I am not sure what other PR you want to do. Is there a way to fix it you would prefer? The other one (#17269 (comment)) is not a bug, it is a consequence of how levels are currently defined/computed. |
|
This PR changes the last plot to |
When micros only are changing (the plot is showing a range inside a second),
the ConciseDateFormatter previously computed a level 0 : year,
which would make it display only years... when microseconds resolution is expected.