[Question] Docs for debugging: PWDEBUG=1, page.pause() and debugger; #5840
Description
Release 1.9 brought us the awesome Inspector. E.g. we can set PWDEBUG=1 and also set await page.pause(); on a page to pause at that occurence.
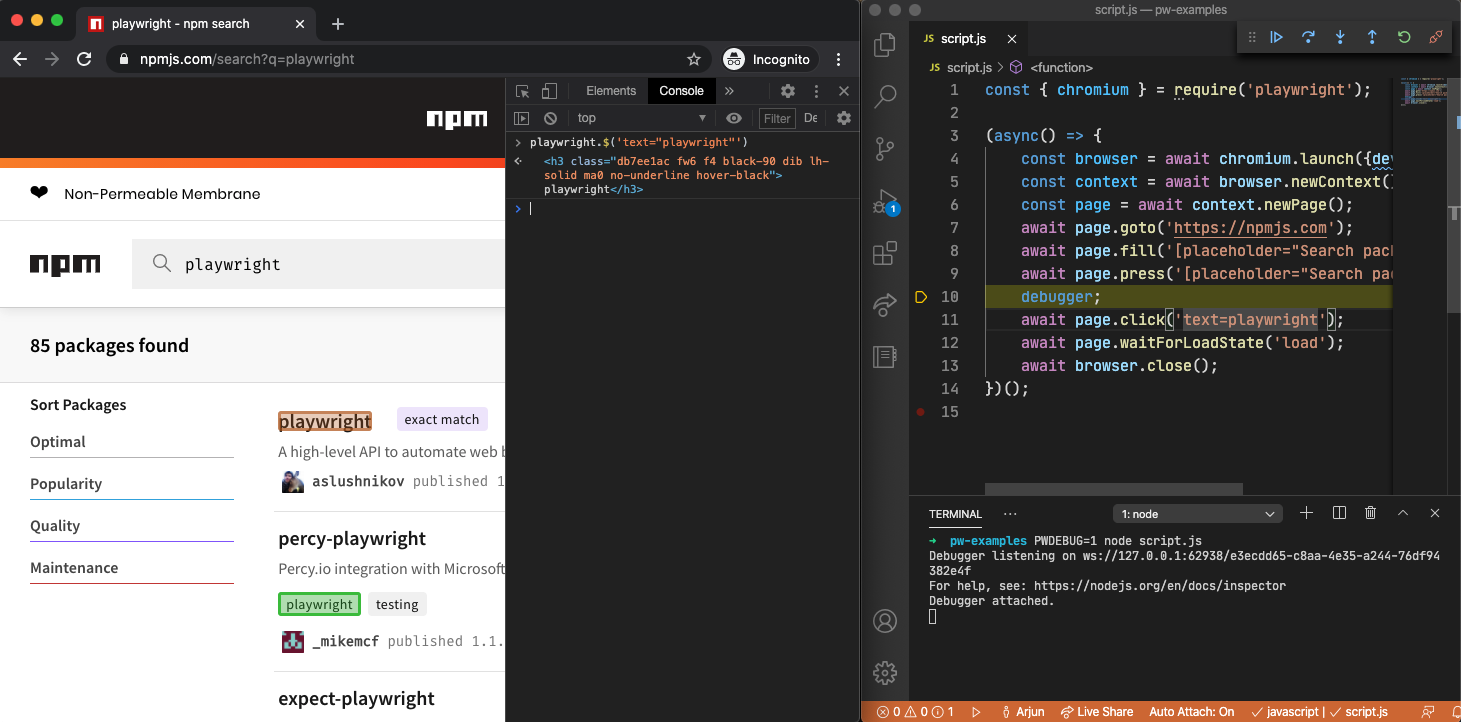
But the Debugging tools is sparse with this information, and it also mentions another way. https://playwright.dev/docs/debug/#run-in-debug-mode has an image that shows a debugger; line which I assume is VS Code specific.
As such, should the Debugging tools page better describe await page.pause() and its relation to it? And should the image rather show that than the VS Code debugger;? (I am assuming it is from VS Code, but could not find in the VS Code docs).
Metadata
Metadata
Assignees
Labels
No labels