Skip to content Search or jump to… Pull requests Issues Codespaces Marketplace Explore
@mkrohit1798 mkrohit1798 / Visualization-Lab-1 Public Cannot fork because you own this repository and are not a member of any organizations. Code Issues Pull requests Actions Projects Wiki Security Insights Settings Visualization-Lab-1/README.TXT @mkrohit1798 mkrohit1798 Update README.TXT Latest commit 39bbab8 now History 1 contributor 85 lines (45 sloc) 5.56 KB
Important instructions****
If your're running the files using VSCode, make sure you've downloaded the Live Server Extension, and then select first_page.HTML file and start the live server(recommended).
If you're running the file using any XAMPP/WAMP server, copy paste the entire folder "Lab_1" into your 'www' directory(in case of WAMP on Windows)
Steps:
- Run the file "first_page.html" on localhost or live server. This will display the main page of the assignment with the button "Dashboard".
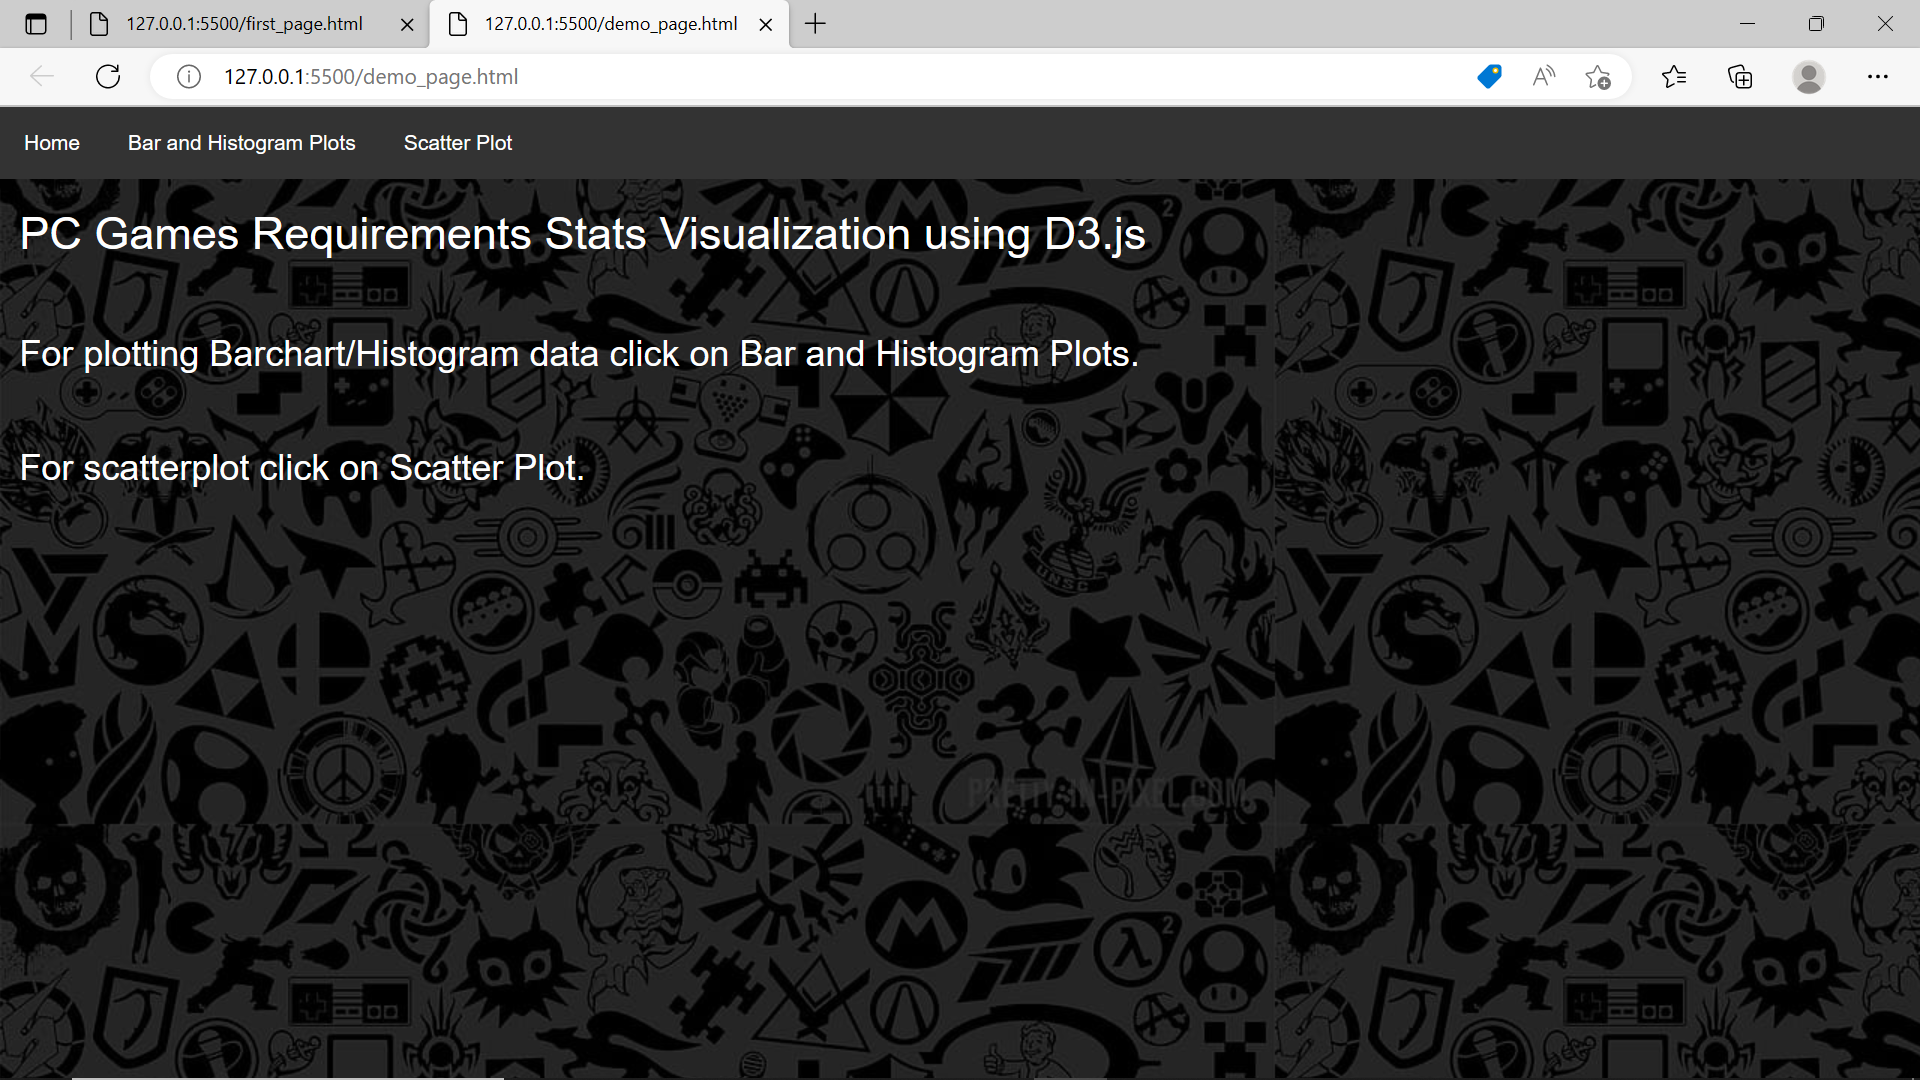
- On clicking the Dashboard button, you'll be directed to the "demo_page.html" site.
- Click on any of the links on the navbar to open the required webpage
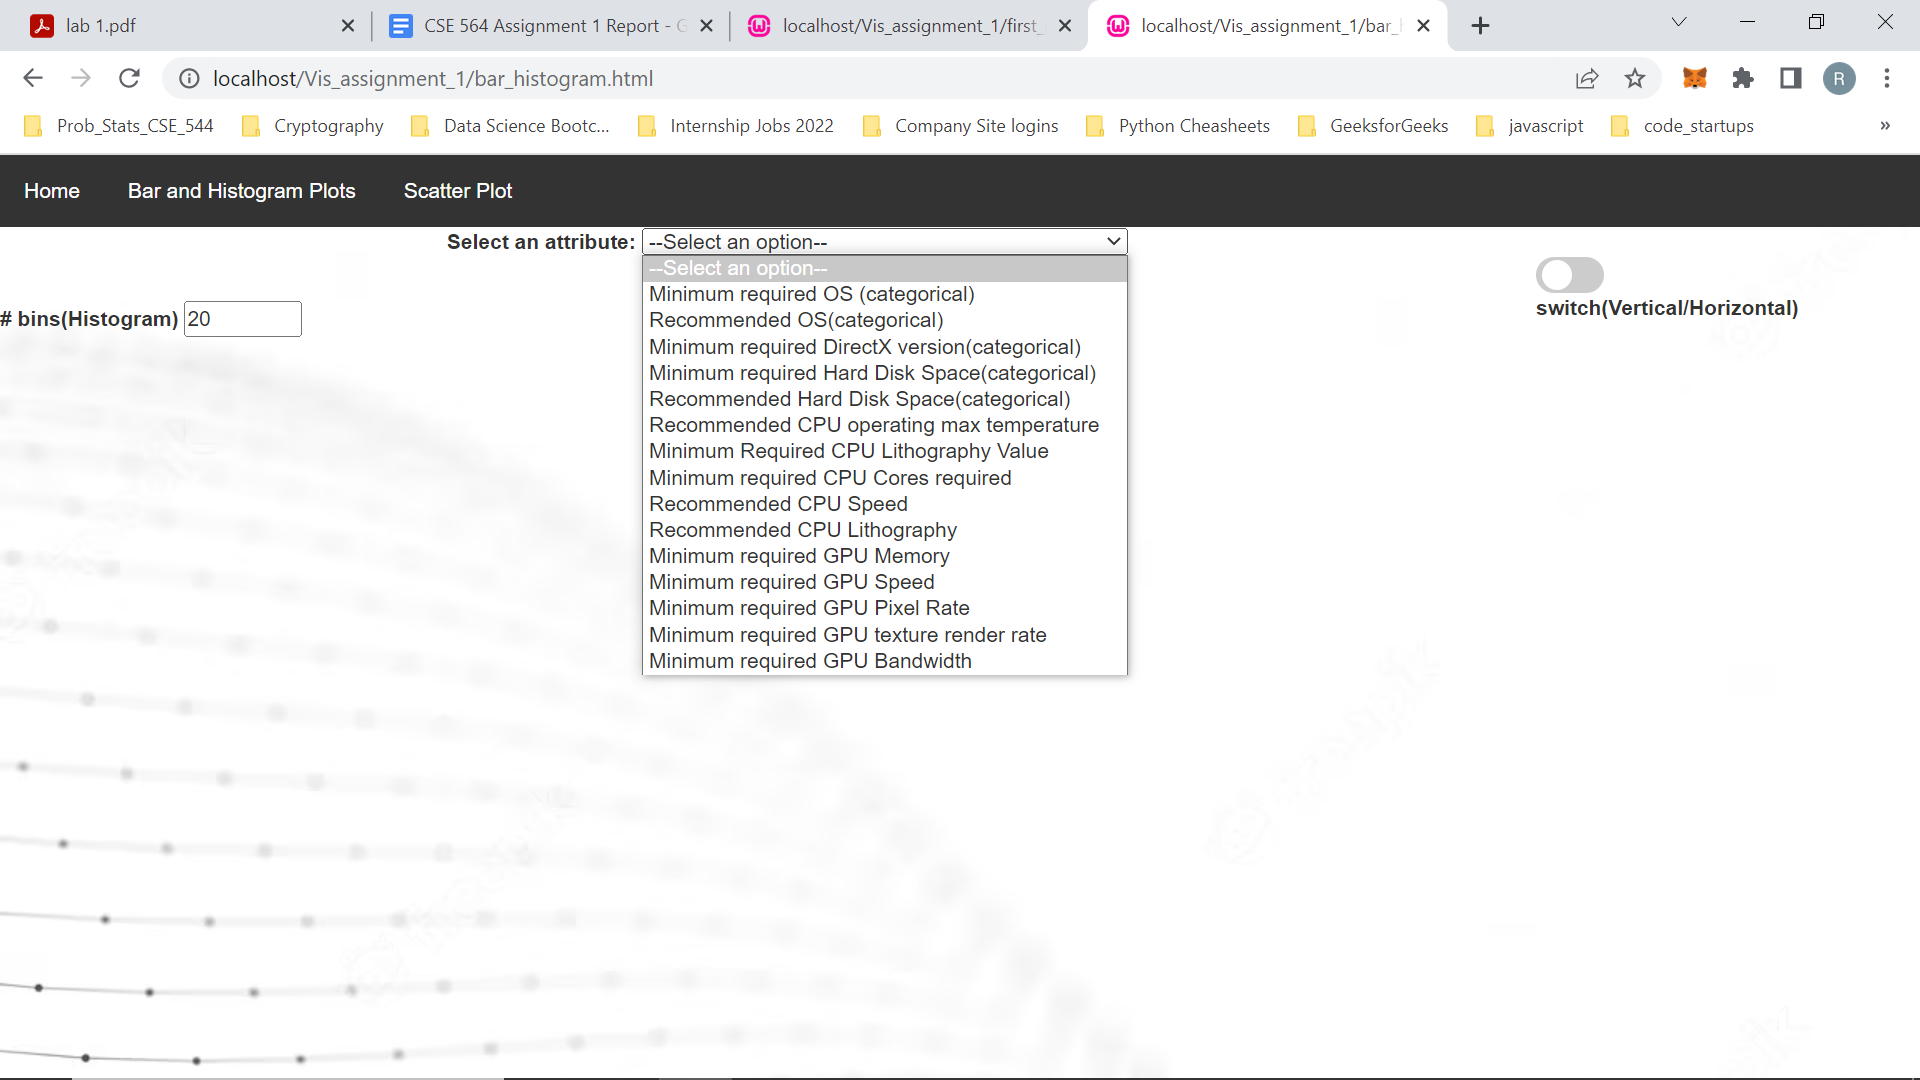
- On clicking the link "Bar and histogram plots" you'll be directed to the bargraph and histogram page. For displaying bar chart, select any value with "categorical" specified in the bracket.
- Once the bar chart is displayed, click on the switch to display the horizontal version the bar chart.
- To display the histogram, click on the column values which don't have anything specified in the bracket, and then select the number of bins from the box. The histogram will be displayed.
- On clicking the link "scatter plot" you'll be directed to the scatter plot page. First select a column value from the dropdown and then assign it to one axis, after that select the second column value and assign it to the other axis.
Name: Rohit Sanjay Inamdar
SBU ID: 114504643
CSE 564: Visualization(Spring 2023) as Basic Project CSE 522
Assignment 1 Report
About Dataset:
The dataset I used for this assignment consists of data pertaining to the requirements for a PC/Video game to function on Computer. The reason for using this dataset is because nowadays numerous high-end games are being developed and many remastered versions of older games are released. Hence this dataset contains information on what would be the optimal requirements(hardware specs) for smoothly running a particular game on a given system. The dataset was obtained from Kaggle.
Link: https://www.kaggle.com/datasets/baraazaid/pc-video-game-requirements-v2Number of columns in the actual dataset: 90
Number of records in the actual dataset: 10843
I've selected 1000 random records from the original dataset and 15 columns from the original dataset.
Column Names:
1. Min_OS: Required Operating System for the game to run
2. Recom_OS: Recommended Operating Operating System for the game 3. Min_Direct_X: Required Direct X setup version(important for running high-end games) 4. Min_HDD_Space: Required Hard Disk space since most games are nowadays have disk size>= 100GB
5. Recom_CPU_Max_Temp: Recommended CPU operating temperature to achieve optimalgaming performance(typically around 40 - 80 degree celsius)
6. Recom_HDD_Space: Recommended Hard Disk Space(useful for cost effectiveness) 7. Min_CPU_Lithography: Required CPU Lithography describes the distance between transistorsembedded on the CPU (the lower the value(in nm), the better the CPU)
8. Min_CPU_Physical_Cores: Number of required cores in CPU(more cores means higherperformance)
9. Recom_CPU_CPU_Speed: CPU performance speed(in GHz) crucial for running high endgames
10.Recom_CPU_Lithography: Recommended CPU Lithography(usually lower than required) 11. Min_GPU_Memory: Required GPU VRAM memory(for achieving higher texture and frameprocessing)
12.Min_GPU_Memory_Speed: Required VRAM processing speed for faster processing of pixels,textures and frames
13.Min_GPU_Pixel_Rate: Required rate for processing a certain number of pixels per second 14.Min_GPU_Texture_Rate: Required texture rate(used for texture filtering) in GigaTexels/second 15.'Min_GPU_Memory_Bandwidth: Required GPU bandwidth(higher value implies faster transferof processed components such as pixels, textures and frames) in Gb/s.
Tasks:
Front page dashboard:
The image below shows the front page of the visual interface. This is done using bootstrap

Menu Page:
The image below shows the menu page which gets loaded on clicking the "Dashboard" button in theprevious page. This page tells the user on which links the respective plots can be viewed.
- Dropdown menu for selecting values:
The screenshot above shows that on selecting the link "Bar and Histogram Plots" or "ScatterPlot", the webpage containing the dropdown menu implemented for the visual interface isdisplayed, whereas the switch is only available for the bar chart.
- Bar Chart for categorical variable:

The image above shows a bar plot for categorical variables. On selecting the required variablefrom the dropdown menu, the bar chart is updated with an animation effect.
- Histogram for numeric variable:

The image above shows a histogram when a numeric variable is selected from the dropdownMenu. Here the user can also adjust the required number of bins.
- Toggle button to switch between horizontal or vertical chart:
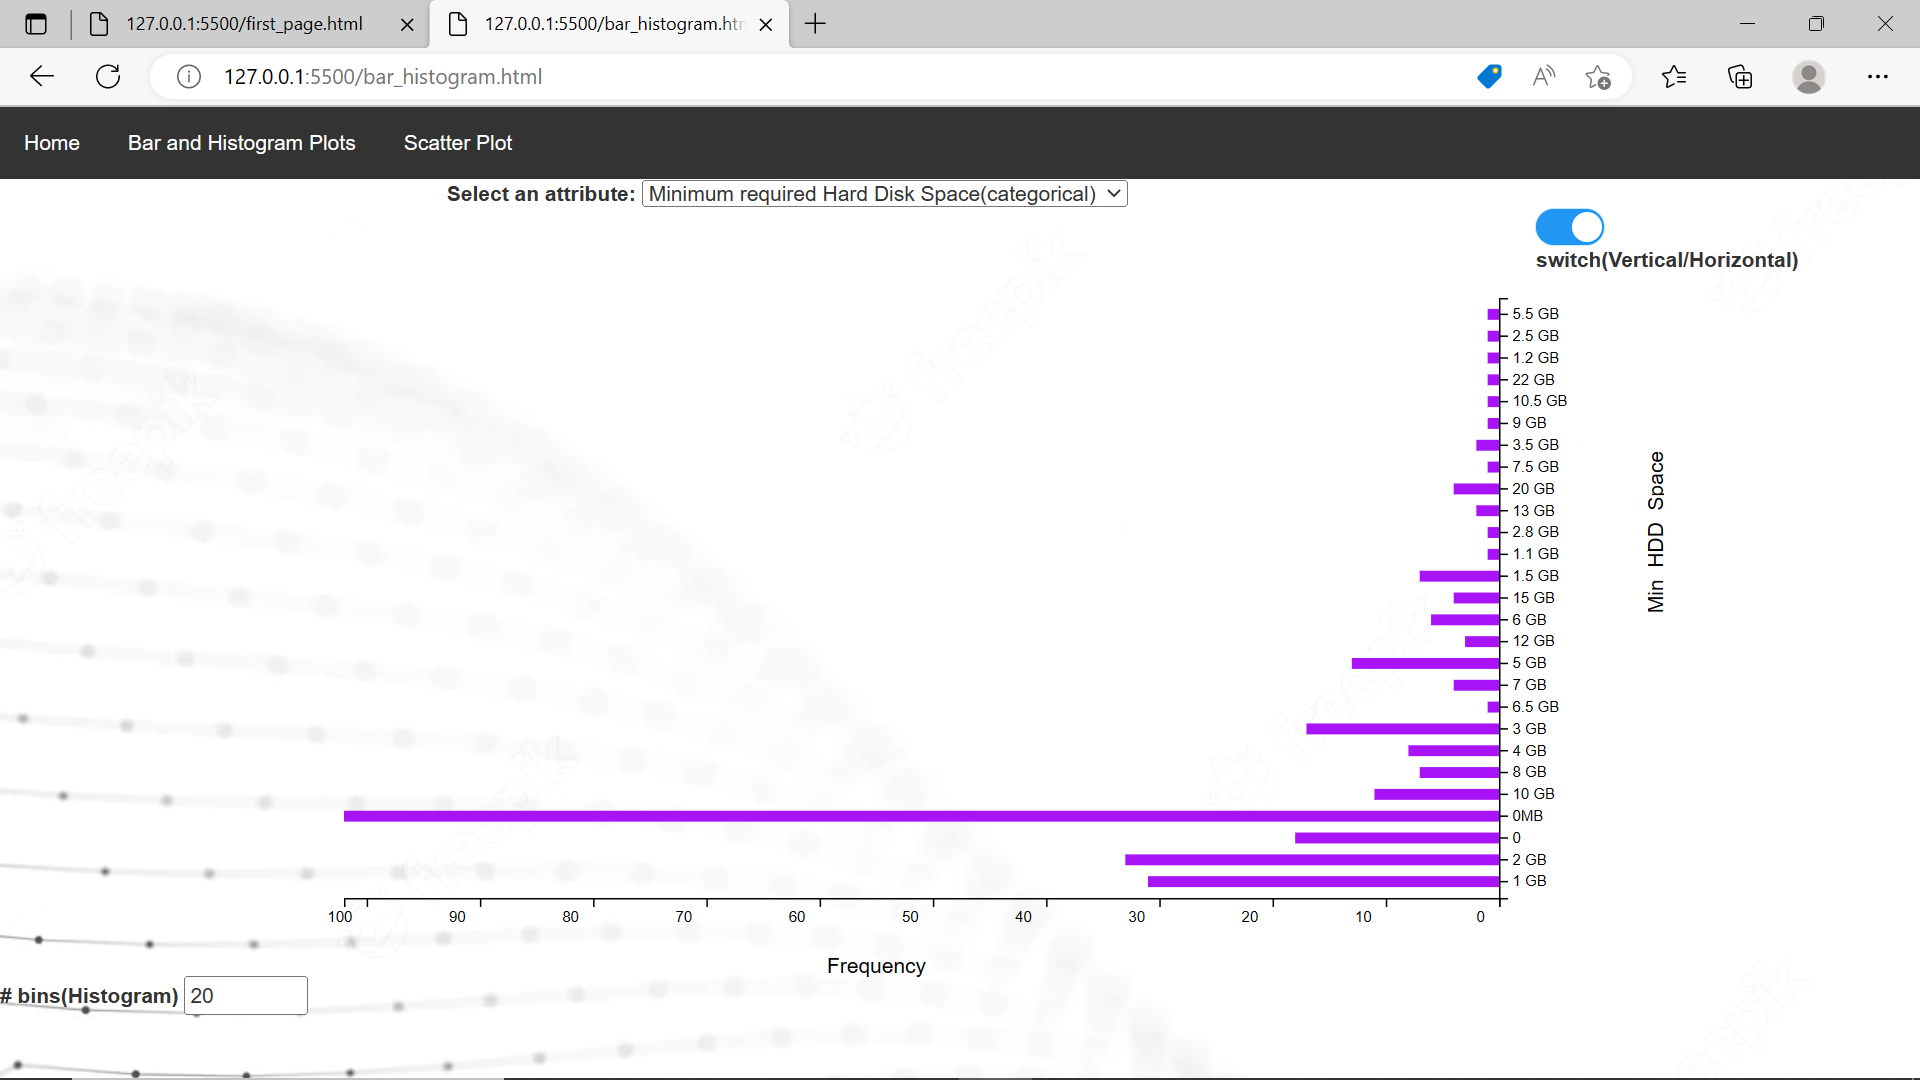
The image above shows the toggled representation of the original bar chart on enabling theswitch.
- Scatter plot of 2 selected variables(using radio button to select axis for variables): The image above shows the scatterplot between 2 selected variables from the dropdown menu.First the variable is selected from the dropdown, then the appropriate radio button for therespective axis is selected.

Footer © 2023 GitHub, Inc. Footer navigation Terms Privacy Security Status Docs Contact GitHub Pricing API Training Blog About