Fix basic pipeline test + Pipeline benchmark #104
Conversation
Codecov Report
@@            Coverage Diff             @@
##             main     #104      +/-   ##
==========================================
- Coverage   54.80%   54.63%   -0.18%
==========================================
  Files          37       37
  Lines        2332     2332
==========================================
- Hits         1278     1274       -4
- Misses        981      984       +3
- Partials       73       74       +1
Flags with carried forward coverage won't be shown. Click here to find out more.
Continue to review full report at Codecov.
|

pkg/pipeline/pipeline_test.go
Outdated
| generic: | ||
| rules: | ||
| - input: Bytes | ||
| output: fl2m_bytes |
There was a problem hiding this comment.
The rules themselves now should be indented another 2 spaces.
|
|
||
| func BenchmarkPipeline(b *testing.B) { | ||
| t := &testing.T{} | ||
| loadGlobalConfig(t) |
There was a problem hiding this comment.
@mariomac can you look on https://github.com/netobserv/flowlogs-pipeline/blob/main/Makefile#L88 --- maybe we can somehow improve this >>> ???? I started to create some benchmark area for the project and I totally agree we need to improve that
There was a problem hiding this comment.
@mariomac In any event, can we agree to create dedicated go files just for benchmark and split from the rest of the tests so we can run those stand-alone??
There was a problem hiding this comment.
I had a look but doesn't seem to work for me... on each invocation I got:
panic: unexpected call to os.Exit(0) during test

github.com/netobserv/flowlogs2metrics/cmd/flowlogs2metrics.run()
	/vagrant/code/flowlogs2metrics/cmd/flowlogs2metrics/main.go:190 +0x1f2
So I decided to create also a very pipeline-specific test to compare the part we are evaluating to change.
There was a problem hiding this comment.
With respect to your second question, we could do that if you prefer it. Anyway benchmarks are not run by default even if they are in the same file as the tests. If you mean skipping tests when you run benchmarks, you can add the -test.run=^$ argument to the go test command to skip any test.
But I'm fine if you feel it's better organizing everyting in the same benchmarks file.
There was a problem hiding this comment.
@eranra I see what's happening with the benchmark in benchmark_test.go. It basically runs many times the whole command, so it would measure basically the performance of starting the FL2M process and finishing it, not the actual FL2M processing performance.
Go benchmarks are more a sort of "micro-benchmarks" aimed to test some parts of the code, and that's why they are usually located in the test files of the components that they are benchmarking. For example, in the benchmark of this PR, it just tests the time of sending and processing a file of ~5000 flows with a very simple dummy pipeline (no real ingest, no real writing...), but it allows us measuring the impact of the sequential vs parallel pipeline mechanism.
I'd suggest to (in another PR to not loose the focus of our current task) remove the current benchmark_test.go and prepare some benchmark that:
- starts the FL2M service with a real ingester
- spins up a client that is able to send real IPFIX flows (we did one using a VM library in our goflow-kube)
- Measures how many flows it's able to process in a given amount of time. E.g. the last stage of the pipeline could be just a counter.
In the future, this could be improved e.g. spinning parallel clients
| "github.com/sirupsen/logrus" | ||
|
|
||
| jsoniter "github.com/json-iterator/go" | ||
| "github.com/netobserv/flowlogs2metrics/pkg/config" |
There was a problem hiding this comment.
goland editor will re-order these imports to be in alphabetical order.
There was a problem hiding this comment.
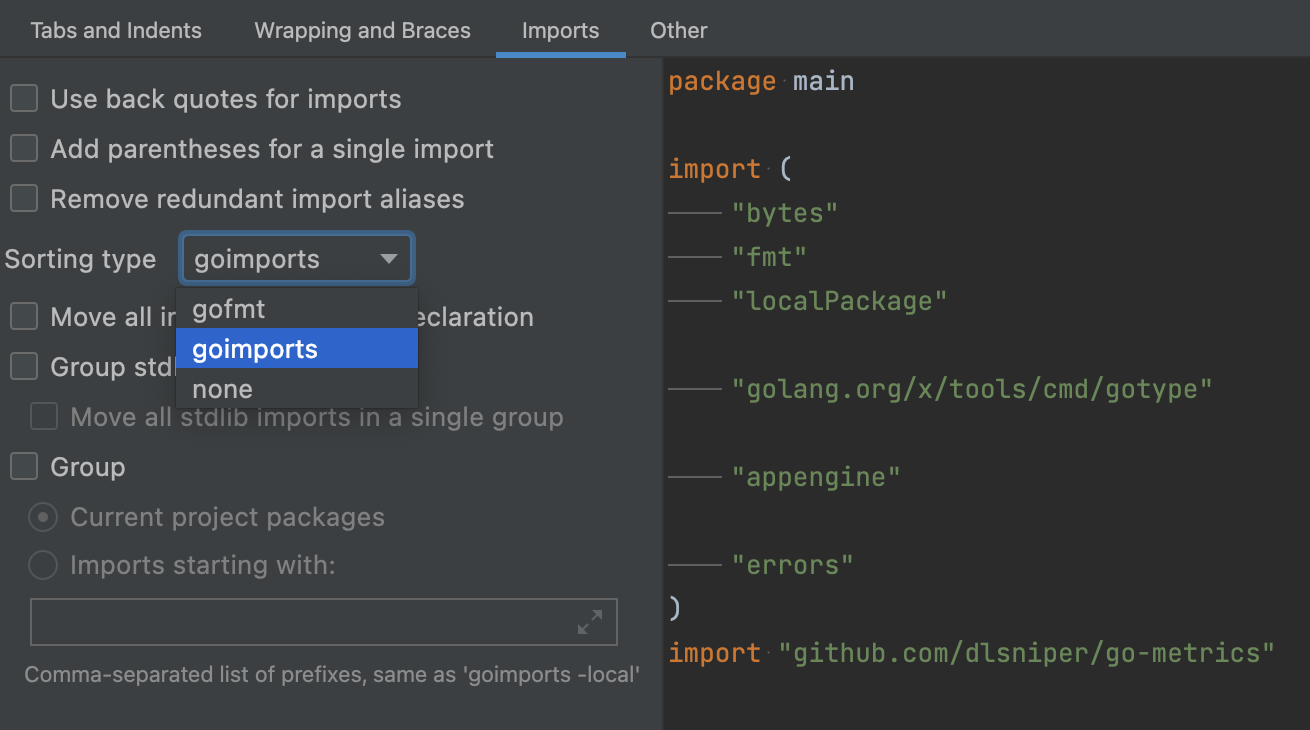
In netobserv we usually sort the imports with goimports, which is independent of the IDE (many team members use VScode). It can be configured to be used from Goland/IDEA too:
But if this is an inconvenience for you I can adapt to use the default Goland. WDYT @jotak @jpinsonneau @OlivierCazade ?
There was a problem hiding this comment.
I'm also using goimports (configured in vscode)
| if err != nil { | ||
| t.Fatalf("unexpected error %s", err) | ||
| } | ||
| b.StartTimer() |
There was a problem hiding this comment.
Where is the timing information used?
There was a problem hiding this comment.
StopTimer and StartTimer are used to exclude from the benchmark some parts of the code that you don't want to measure. In this case we don't want to measure the Pipeline creation time but just the amount of metrics that you can forward.
|
superseeded by #105 |
There was a couple of minor, unnoticed mistakes, that prevented the pipeline transformers from being loaded.
This test also checks that the transformation stage has been properly applied.
It provides a basic pipeline benchmark that would allow measuring any improvement or penalty in future modifications of the pipeline architecture.