Add Histogram and Heatmap visualization #164
Conversation
b66a4b7 to
dbaf984
Compare
dbaf984 to
79f62ba
Compare
 eranra
left a comment
eranra
left a comment
There was a problem hiding this comment.
This looks very good to me ... all the suggestions are updates for names, variables etc ... in general we do not need to see any more mice and elephants anywhere ... everything can move to be "flows length"
| }, | ||
| "targets": [ | ||
| { | ||
| "expr": "sum(rate(flp_mice_elephants_histogram_bucket[$__interval])) by (le)", |
There was a problem hiding this comment.
@ronensc Please change in all places, documentation, metrics names, etc from mice-elephants to flows-length ... the original mice elephant was sub set of the functionality and the name "flows length" fits now much better
| parameters: ">=0" | ||
| extract: | ||
| aggregates: | ||
| - name: bytes_hist |
There was a problem hiding this comment.
s/bytes_hist/flows_bytes_hist
| - by | ||
| - aggregate | ||
| buckets: | ||
| - 100 |
There was a problem hiding this comment.
@ronensc can you update to 128, 2048, 10K, 100K, 1M, and above ... I think that those are more relevant buckets for flows.
Co-authored-by: Eran Raichstein <eranra@il.ibm.com>
Co-authored-by: Eran Raichstein <eranra@il.ibm.com>
Codecov Report
@@            Coverage Diff             @@
##             main     #164      +/-   ##
==========================================
- Coverage   58.32%   57.74%   -0.58%
==========================================
  Files          54       54
  Lines        3105     3117      +12
==========================================
- Hits         1811     1800      -11
- Misses       1173     1195      +22
- Partials      121      122       +1
Flags with carried forward coverage won't be shown. Click here to find out more.
Continue to review full report at Codecov.
|
Co-authored-by: Eran Raichstein <eranra@il.ibm.com>
| | **Description** | A histogram of flowlog bytes | | ||
| |:---|:---| | ||
| | **Details** | Flows length distribution over time | | ||
| | **Usage** | Evaluate flows length behavior including mice/elephant use-case | |
There was a problem hiding this comment.
is the mention of "mice/elephants" here (and below) still intended?
There was a problem hiding this comment.
Eran has updated it recently so I guess it is intended
#164 (comment)
There was a problem hiding this comment.
@KalmanMeth this is the only place where we explain that the histogram is useful for the mice/elephant use-case --- hope that this make sense to you
This PR is on top of #152. Should be merged after that one is merged.
Solves issues: #19 #9
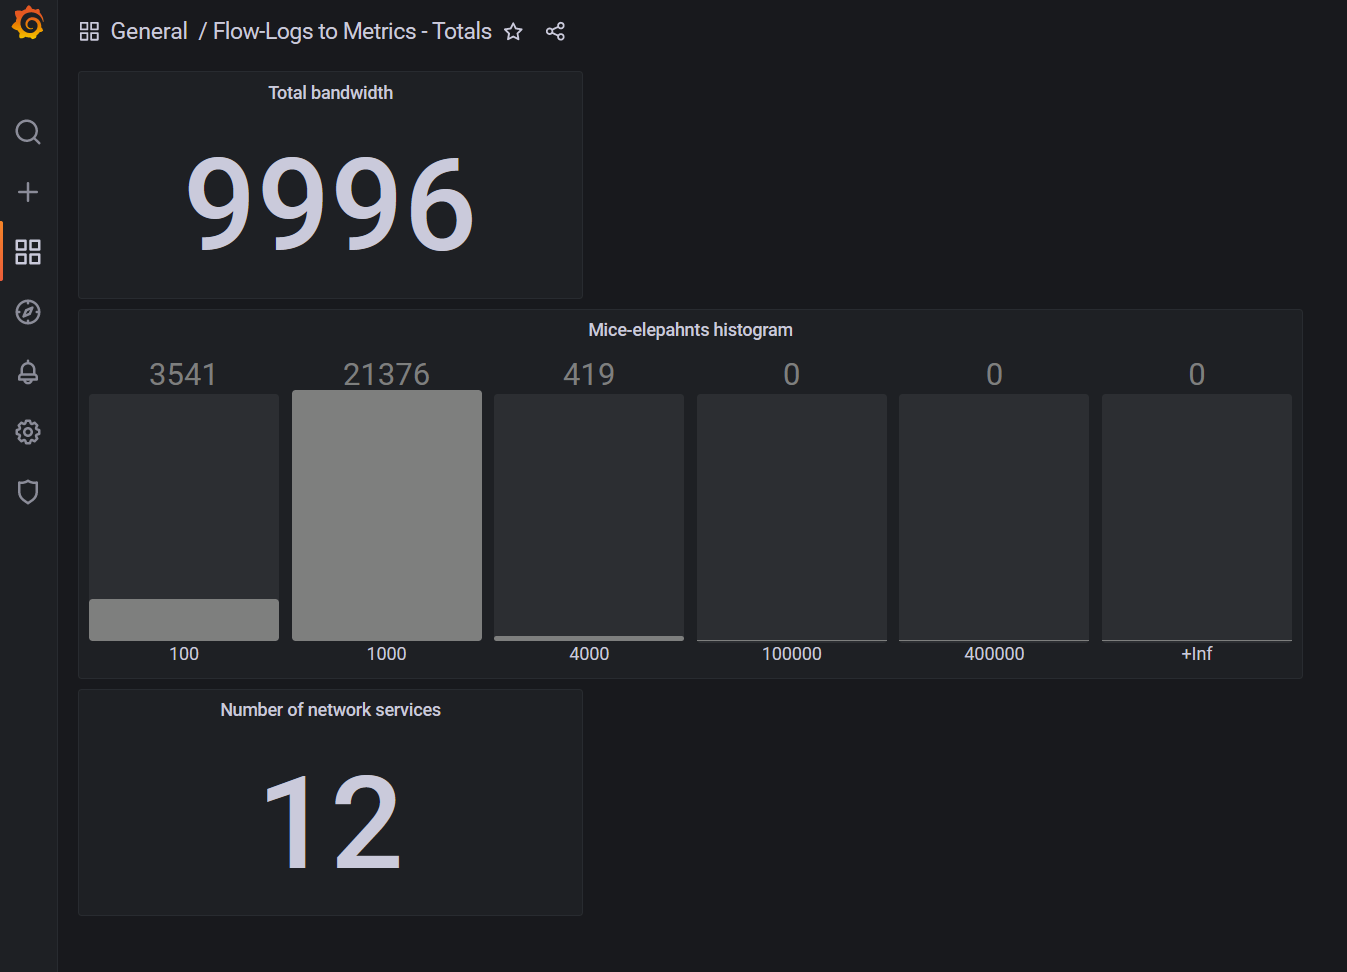
Print screens of the added visualizations are attached below:
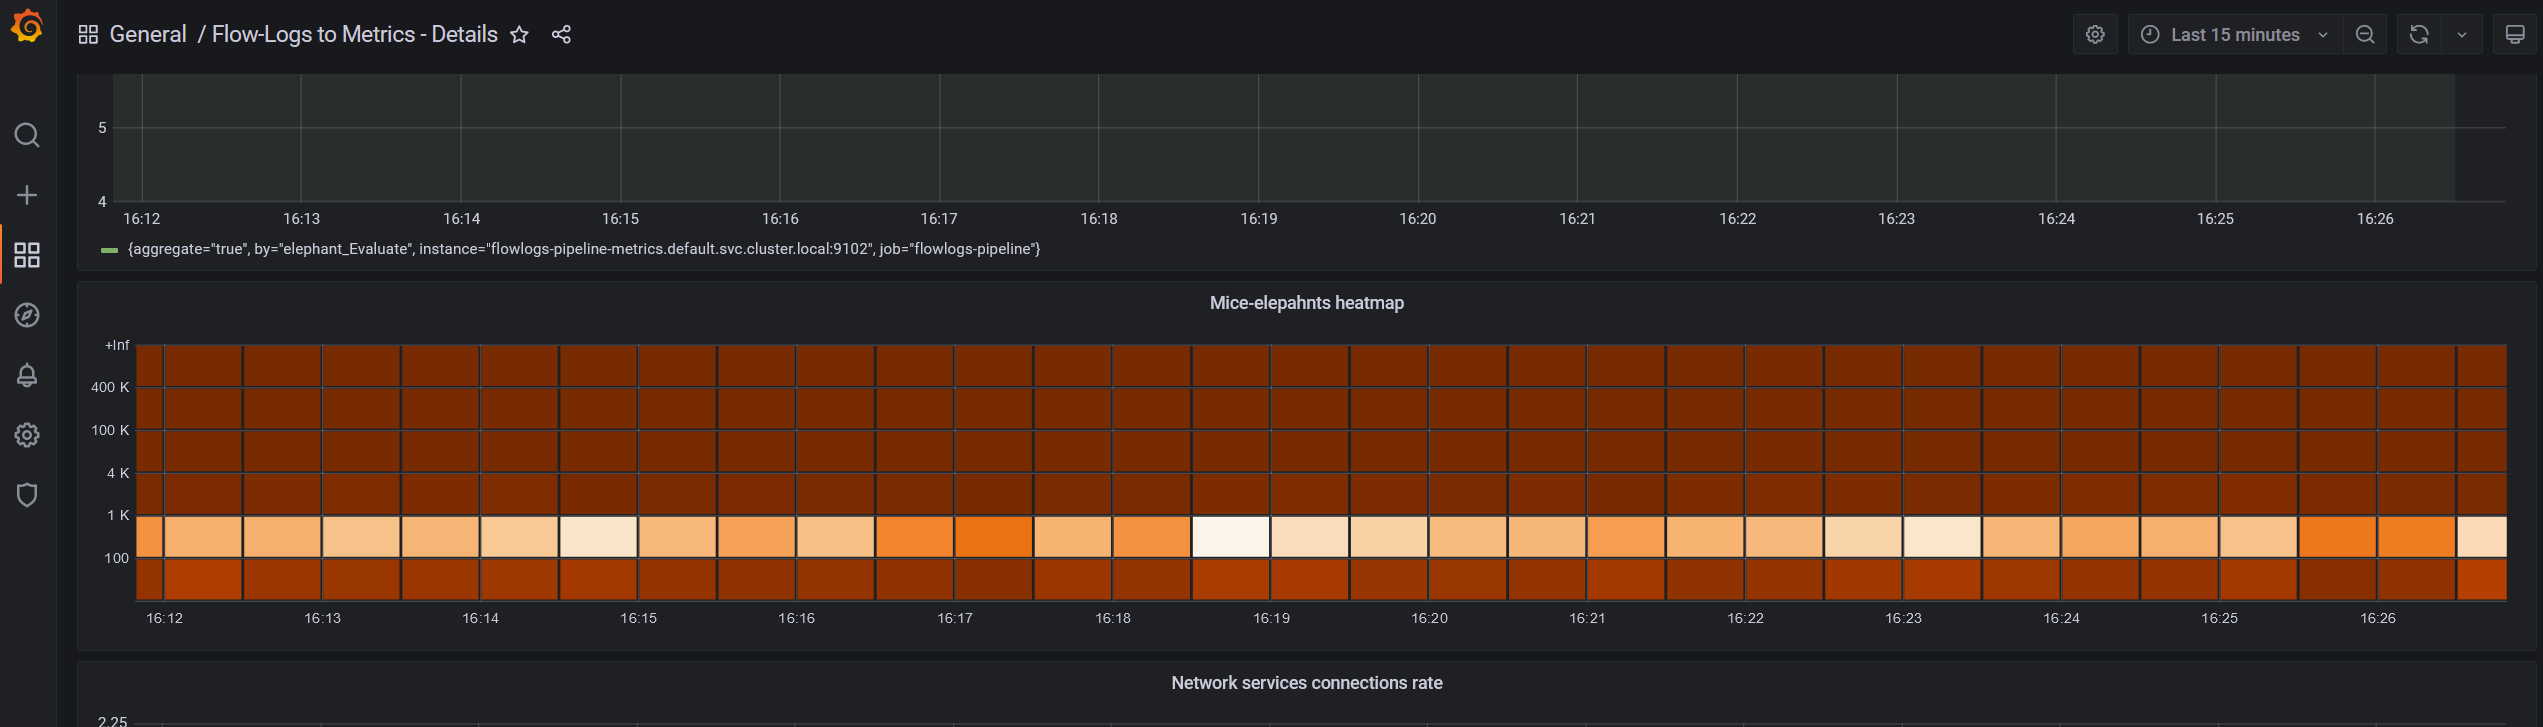
Heatmap in the details dashboard
Histogram in the totals dashboard
The visualizations are based on:
https://grafana.com/blog/2020/06/23/how-to-visualize-prometheus-histograms-in-grafana/