MRG+1: allowing transparency in divergent colormaps #207
Conversation
| transparency and letting the rescaler know that this is a divergent color map. | ||
| In this case the first number gives the value that should be in the center of | ||
| the colormap, the second determines which values will be transparent and the | ||
| third determines the left and right edges of the new colormap. |
There was a problem hiding this comment.
It's also common to want thresholds for divergent colormaps to effectively be:
[-fmax, -fmid, -fmin, 0, fmin, fmid, fmax]
Where [-fmin, fmin] is a single color (the midpoint of the colormap).
If we support this use case somehow, your use case is also automatically supported. Can you think of a good API?
One idea would be to do center=None default (for non-divergent) and do:
add_data(...., fmin=2, fmid=4, fmax=6, center=0)would do what I wantadd_data(..., fmin=0, fmid=3, fmax=6, center=0)would do what you want
Or something equivalent and maybe nicer could be done with divergent=False default:
add_data(..., fmin=2, fmid=4, fmax=6, divergent=True)would do what I wantadd_data(..., fmin=0, fmid=3, fmax=6, divergent=True)would do what you want
WDYT?
There was a problem hiding this comment.
I like center= as a way of specifying divergent colormaps.
There was a problem hiding this comment.
It would be nice if pysurfer did what seaborn does with divergent colormaps which is to clip the lookup table so that the colorbar shows the extreme values in the data while keeping the luminance midpoint in the right place.
There was a problem hiding this comment.
Also if @larsoner's original suggestion is implemented that would mean completely duplicating the add_overlay functionality, which is worth thinking about.
There was a problem hiding this comment.
Yes, originally I also planned to allow something like [-fmax, -fmid, -fmin, 0, fmin, fmid, fmax], but settled for the easier [c-max, c-mid, c, c+mid, c+max], because that's much easier to handle with a single colormap. At the latest when thinking about generating a colorbar for the version allowing for space between the positive and negative ranges I realised that this is in effect plotting two separate sets of data with two separate colormaps. I only then found add_overlay which, when called as in the example, already does what you want, just that it doesn't allow you to specify colormaps (yet?).
As a user, I'm not actually clear about what the principle difference between add_overlay and add_data is. It appears to me that add_overlay is just a crippled version of add_data?
I also like the center= argument, but it makes less sense, when there is no separation between negative and positive sides, because you'd have to give both fmin and center values which should be equal. center could also override fmin, when given, which sounds fine, too.
@mwaskom I'm afraid I didn't quite understand what you mean with seaborn's handling of diverging colormaps. Intuitively, the procedure you're describing sounds like what the fmax-argument already does.
There was a problem hiding this comment.
Yes, I think so. Thanks for taking a stab at it. A couple of minor points:
- It might be worth de-duplicating with
add_overlayif/where possible. - We probably want different default colormaps to be used (
cmap='auto'by default?) depending on ifcenter=None(use current default) or not (some diverging colormap). - It would be good if the colormap actually displays properly on the colorbar. It might, depending on how it's implemented, but we should at least check the result for e.g.
center=0, fmin=1, fmid=2, fmax=3
@mwaskom any personal favorite diverging colormap we should use by default?
There was a problem hiding this comment.
@larsoner the icefire colormap I added recently is intended to be used for diverging neuroimaging visualization.
There was a problem hiding this comment.
Ok, automatically choosing a divergent colormap, when center is provided is a good idea. The only issue is that so far the colormap is only chosen in add_data while center would live in scale_data_colormap. Should I then also add the full fmin, fmid, fmax, center to add_data?
There was a problem hiding this comment.
It's okay with me, as they'll mostly get passed through (and it could save a call to scale_data_colormap). Would it simplify / unify add_data and add_overlay calls a bit?
There was a problem hiding this comment.
I did most of the work today, but still see a strange effect that I don't understand. I will be away the next two days and will check in my progress on Friday.
…maps

Added this feature according to discussion on
nipy#207

fmin now gives the distance from center at which colors should first be shown. I
implemented this by inserting a fully transparent part in the centre of the
colormap. Because the scalar_lut_manager of Mayavi and eventually VTK chooses
colours based on linear interpolation, you cannot map a range of values to a
single color at the centre of the colormap. Thus, I add new transparent colors
in the centre in proportion to the size of the corresponding value range. This
also ensures that the colorbar automatically gives meaningful information.

add_data now chooses colormaps automatically, if cmap="auto" is chosen (the
default). The decision is currently only based on whether the center argument
indicates a divergent colormap, see commit b5ff3be. This meant that I had to
add center as an argument to add_data and decided to complete the interface for
scale_data_colormap by adding also new arguments mid and transparent to
add_data which saves a subsequent call to scale_data_colormap. I'm unsure about
the most compatible order of these arguments, but so far didn't find any parts
of the code which used the order of arguments beyond min and max.
|
Ok, these changes should implement the discussed functionality. I had some issues with Mayavi/VTK when changing the number of colors in the lookup table. So I now ensure that the new lookup tables have exactly 256 colors (see 59debb4). I'm most uncertain about the compatibility of the newly added arguments in |
 larsoner
left a comment
larsoner
left a comment
There was a problem hiding this comment.
Looks like it works decently, here is what I get for center=0 with limits [8, 12, 15]:
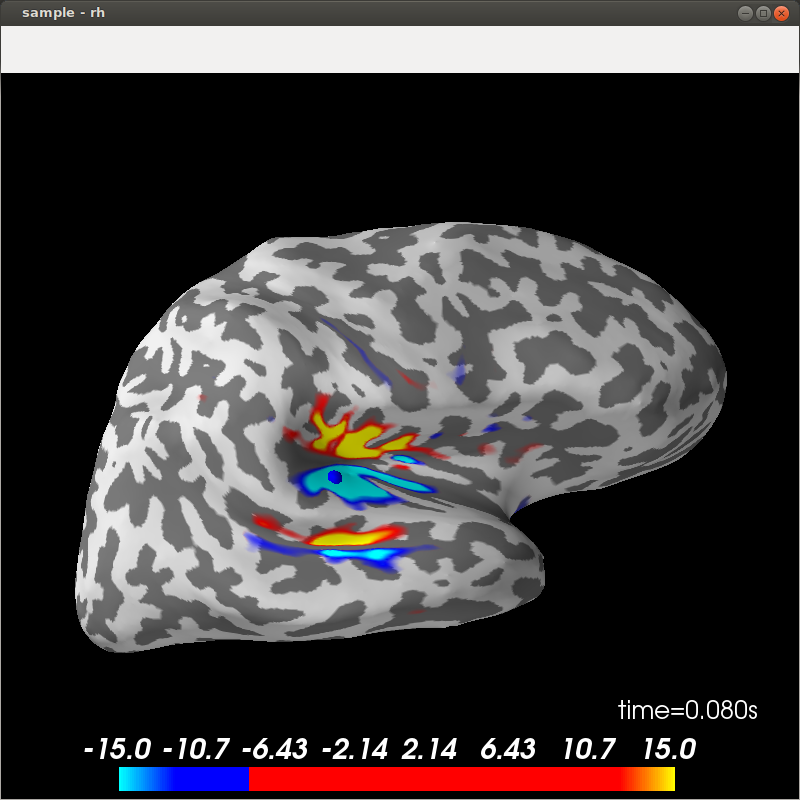
The weird thing is the center value. I wonder if we should set the "not shown" values (if they exist) to middle gray with transparency=0 (0.5, 0.5, 0.5, 0.).
| is a 2d array. | ||
| center : double, optional | ||
| indicates whether desired colormap should be for divergent values, | ||
| currently only used to select default colormap for cmap='auto' |
surfer/utils.py
Outdated
|
|
||
| return lut | ||
|
|
||
| if isinstance(cmap, string_types) and cmap=="auto": |
There was a problem hiding this comment.
spaces around operator (these are PEP8 things)
surfer/viz.py
Outdated
| def add_data(self, array, min=None, max=None, thresh=None, | ||
| colormap="RdBu_r", alpha=1, | ||
| def add_data(self, array, min=None, max=None, mid=None, | ||
| thresh=None, center=None, transparent=False, |
There was a problem hiding this comment.
even though it's annoying, we probably need to put mid, center, and transparent at the end of the argument list for backward compatibility
surfer/viz.py
Outdated
| or a custom look up table (an n x 4 array coded with RBGA values | ||
| between 0 and 255). | ||
| between 0 and 255), the default "auto" chooses a default divergent | ||
| colormap, if "center" is given, otherwise a default sequential |
There was a problem hiding this comment.
might as well list what they will be, e.g. '... default divergent colormap ("icefire") if "center" is given, otherwise ...'
There was a problem hiding this comment.
One reason not to do that is that encoding defaults in text that doesn't automatically update with the code is asking for trouble later if things change.
There was a problem hiding this comment.
That's true. There's a tradeoff to be made there. In this case, once we choose defaults it's backward-incompatible to change them, so the change is likely to be invasive enough we'd notice that we need to update the defaults. I think the informativeness to the user is worth it in this case -- what do you think?
There was a problem hiding this comment.
In this case, breaking backwards compatibility wouldn't cause any existing code to stop working or produce incorrect results, it would simply look different. So in the future, if we decide there is a better default colormap to use, I would feel no compunction about the change.
There was a problem hiding this comment.
(That said, the worst thing that would happen if the docs don't get updated is some minor confusion for an already curious user, so it's probably fine).
There was a problem hiding this comment.
wouldn't cause any existing code to stop working or produce incorrect results, it would simply look different.
For scripts that use PySurfer to make figures for publication (hopefully there are many of these!) this would be problematic, so I wouldn't want to do this without a deprecation cycle.
There was a problem hiding this comment.
Well, you only publish once, and it will be extremely obvious if/when it changes, so that doesn't strike me as a problem. With this sort of parameter my opinion is that not specifying it is "asking for the default", which may be subject to change. In other words, best practices for publication scrips that you really don't want to change is to encode the values you really want even when they correspond to the default at the time you write them.
Overly stubborn resistance to changing default colormap even when you know it's bad is what caused the sourge of jet after all :)
Anyway it's an orthogonal issue and I'm fine saying in the docs what the default is. Maybe add a comment in the code that the docstring should be updated if the defaults are changed.
surfer/viz.py
Outdated
| divergent indicate this by providing a value for 'center'. The | ||
| meanings of fmin, fmid and fmax are different for sequential and | ||
| divergent colormaps. For sequential colormaps the colormap is | ||
| characterised by: |
There was a problem hiding this comment.
:: here, it will render what follows nicely as code
surfer/viz.py
Outdated
| where fmin and fmax define the edges of the colormap and fmid will be | ||
| the value mapped to the center of the originally chosen colormap. For | ||
| divergent colormaps the colormap is characterised by |
surfer/viz.py
Outdated
| transparent : boolean | ||
| if True: use a linear transparency between fmin and fmid | ||
| if True: use a linear transparency between fmin and fmid, or | ||
| between center-fmin to center-fmid and center+fmin to center+fmid |
There was a problem hiding this comment.
How about "... linear transparency between fmin and fmid (symmetrically for divergent colormaps)."
surfer/viz.py
Outdated
| """ | ||
| if not (fmin < fmid) and (fmid < fmax): | ||
| raise ValueError("Invalid colormap, we need fmin<fmid<fmax") | ||
| if not (alpha >= 0) and (alpha <= 1): |
surfer/viz.py
Outdated
| divergent = center is not None | ||
|
|
||
| if divergent: | ||
| logger.info("colormap: fmin=%0.2e fmid=%0.2e fmax=%0.2e " |
There was a problem hiding this comment.
How about messages formatted more like this (aiming to be compact + readable):
colormap divergent: center=0., [2., 3., 4.] (transparent)
colormap sequential: [0, 5, 10] (opaque)
There was a problem hiding this comment.
but is there a convention that you have been using for these messages, or does anything depend on their previous format?
There was a problem hiding this comment.
I think it's okay to change it to make it clearer / more compact, it is very unlikely someone's code relies on parsing the colormap log message
|
Also, could you rebase? That way the CIs can check everything. |
|
I have resolved the few things you discussed except for the log message (see my comment above). The colorbar in your example looks strange, because I used the first color of the second half of the colormap to fill up the center of the colormap. This works nicely with most divergent colormaps as they smoothly transition from one to the other side of the colormap. That's not the case for the colormap in your example. I have now included some code which tries to identify these colormaps and then chooses gray as the fill color in the center for them. A practical issue as I haven't done that before: I have rebased my branch with nipy/master locally and my state is now: I can't imagine that merging the old commits is the appropriate thing to do. What is? |
I would do:
The problem is actually more general than this. Gray should be used anytime that Ideally the |
…maps

Added this feature according to discussion on
nipy#207

fmin now gives the distance from center at which colors should first be shown. I
implemented this by inserting a fully transparent part in the centre of the
colormap. Because the scalar_lut_manager of Mayavi and eventually VTK chooses
colours based on linear interpolation, you cannot map a range of values to a
single color at the centre of the colormap. Thus, I add new transparent colors
in the centre in proportion to the size of the corresponding value range. This
also ensures that the colorbar automatically gives meaningful information.

add_data now chooses colormaps automatically, if cmap="auto" is chosen (the
default). The decision is currently only based on whether the center argument
indicates a divergent colormap, see commit b5ff3be. This meant that I had to
add center as an argument to add_data and decided to complete the interface for
scale_data_colormap by adding also new arguments mid and transparent to
add_data which saves a subsequent call to scale_data_colormap. I'm unsure about
the most compatible order of these arguments, but so far didn't find any parts
of the code which used the order of arguments beyond min and max.
- include choices for default cmap in docstring
- move new arguments of add_data to back of argument list
- add colons to docstring
- simplify if statement about range of alpha
|
Yes, I agree that it would make most sense, if the colorbar would somehow reflect transparency properly, but I'm afraid that this is a Mayavi or even VTK issue that I currently don't want to go into. At least for |
It looks like the
It's a bit of a hack but it should work, and I suspect will best represent what's happening with the data. I can give it a try if you're tired of messing with Mayavi :)
Hmmm... I'm not sure I agree that the transparent effect is currently made clear by the colorbar. With |
I wondered more generally why Mayavi/VTK programmers did not include the possibility of having transparent colorbars and figured out that this is not true: You can switch on proper transparency of the colorbar with This will apply transparency with respect to the figure window background (white in my example). For
but with
I guess the question is what the background colour should be against which the transparency is plotted. Given that the colours apply to the brain, this should probably, in the ideal case be a texture containing the two colours of the inflated brain (greys in most cases). I wonder whether people would intuitively recognise a simple mixture between the colorbar and a particular grey to represent the transparency on the brain. Perhaps the transparency of the colorbar with the figure background is already a good approximation? |


In this case I wouldn't have expected to be able to see any brain, i.e. the
It looks better than before, but I agree still not quite right.
Yes this would be ideal, but I think just using middle gray
I think they would. In every example you've posted so far, and even in the examples we have online (even with the
I'd say it's better than what we have in Did you have a chance to try my suggestion of using a dummy object for comparison? (Or alternatively, to see if there is a way to set the background color of the colorbar in addition to setting the opacity?) |
|
I did not find an option to set the background only of the colorbar itself, but this is possible:
Not sure whether I like the box or whether the grey is better than the white. I did not try your dummy object approach. |

|
I think the box looks a bit worse than no box. And can you look into this problem?
|
|
Ah right, I read this over. I interpreted to one in which all values except those in |
|
Do we even need the thresholding filter? Maybe setting the limits properly (and scaling our colorbar properly) will already work. |
|
I don't see how setting the limits and scaling the colorbar can implement the selective clipping of values at the centre of the colormap. The colormap used by Mayavi will always linearly interpolate colours given scalar values so you cannot simply skip values that lie in the centre. As I understood it, the The simplest solution would be to not adapt the behaviour of |
My point is just that I don't think these values should be / need to be clipped, at the very least in the |
|
Ok, I agree and, therefore, didn't touch the |
|
Looks like there are some PEP8 errors: https://travis-ci.org/nipy/PySurfer/jobs/284137743#L1221 Can you rebase so that CircleCI runs the doc build properly? |
|
See sbitzer#1 for non-hack gray fix |
There was a mechanism for smoothly fading out small values of some data shown on
the brain, but this did not work for diverging colormaps for which 'small'
values are in the centre of the color map instead of on the lower edge. I have
added a new flag "divergent" to scale_data_colormap which tells the function to
assume a divergent colormap and apply transparency accordingly. Compared to
adding separate overlays for the two sides of the diverging colormap this allows
easier, interactive exploration of suitable colormap settings.

I have adapted the example plot_resting_correlations to demonstrate the effect.
This is mostly for compatibility with the previous example where instead of
setting a transparent region in the divergent colormap the whole colormap was
made transparent.
This update of create_color_lut is preparation for allowing automatic choice of
colormap in Brain.add_data. If cmap=="auto" rocket is chosen as colormap unless
center indicates a divergent colormap, then icefire is returned.
…maps

Added this feature according to discussion on
nipy#207

fmin now gives the distance from center at which colors should first be shown. I
implemented this by inserting a fully transparent part in the centre of the
colormap. Because the scalar_lut_manager of Mayavi and eventually VTK chooses
colours based on linear interpolation, you cannot map a range of values to a
single color at the centre of the colormap. Thus, I add new transparent colors
in the centre in proportion to the size of the corresponding value range. This
also ensures that the colorbar automatically gives meaningful information.

add_data now chooses colormaps automatically, if cmap="auto" is chosen (the
default). The decision is currently only based on whether the center argument
indicates a divergent colormap, see commit b5ff3be. This meant that I had to
add center as an argument to add_data and decided to complete the interface for
scale_data_colormap by adding also new arguments mid and transparent to
add_data which saves a subsequent call to scale_data_colormap. I'm unsure about
the most compatible order of these arguments, but so far didn't find any parts
of the code which used the order of arguments beyond min and max.
…ormap

Somehow Mayavi mapped values beyond the lookup-table range to inconsistent
colors. Specifically, when rescaling a divergent colormap from fmin=0.1 to
fmin=0, the values beyond +/-fmax got strange colors that apparently depended on
the previous setting of fmin, or its relation to fmax. I traced this to a
problem with changing colormap sizes which Mayavi apparently doesn't handle
properly, but I couldn't figure out exactly where the problem was, i.e., which
VTK attributes did not get set consistently when changing the colormap size.
Nevertheless, the issue can be avoided by simply sticking to the standard
colormap size of 256. I originally did not want to do that to maintain the color
resolution of 128 colors for the supposedly interesting values between fmin and
fmax, but I guess we can live with a lower resolution, if colors are displayed
consistently.
- include choices for default cmap in docstring
- move new arguments of add_data to back of argument list
- add colons to docstring
- simplify if statement about range of alpha
Some divergent colormaps sharply transition from one color to another in the
center of the colormap. For these the colorbar looked strange, because the first
color of the second half of the colormap was chosen to fill up the center of the
colormap for fmin>0. We now identify these colormaps and use a neutral grey as
fill color for them instead. For colormaps with smooth transitions nothing
should change.
I previously set all values below fmin or within [center-fmin, center+fmin] to
fully transparent irrespective of the setting of 'transparent'. This is not the
functionality of fmin as previously defined for sequential colormaps. fmin only
defines all values that should be mapped to the left edge of the colormap, or
the centre colours in the colormap. I have now corrected that such that, when
transparent=False, all data values are displayed with the corresponding colours.

To not display small values also with transparent=False add_data has
additionally the 'thresh' argument which uses a Mayavi threshold filter to clip
data that falls below the given threshold. Unfortunately, I couldn't find an
appropriate VTK filter that can clip data in the centre of the data range, yet.
So I left this part of the interface untouched.

I found, however, an option to switch on transparency of the colorbar and now
toggle this together with 'transparent'.
- moved the code handling transparent colorbars inside the loop over surfaces
- only manipulate colorbar when there is actually any transparency
- only compute mean brain background color once
|
Looks nice: But something strange has happened here: (it's probably a bug in the code I wrote, feel free to look or I can do it) |
|
Nice!
As I wouldn't know where to start, except for the obvious that it has something to do with the computation of the background color, I would appreciate, if you could check it out first. |
I should be able to take a look tomorrow |
|
Fix up again at sbitzer#1 |
|
Great, fine by me! 👍 |
|
Anybody else want to look? If not I'll go ahead and merge. |
|
Thanks @sbitzer ! |
…maps

Added this feature according to discussion on
#207

fmin now gives the distance from center at which colors should first be shown. I
implemented this by inserting a fully transparent part in the centre of the
colormap. Because the scalar_lut_manager of Mayavi and eventually VTK chooses
colours based on linear interpolation, you cannot map a range of values to a
single color at the centre of the colormap. Thus, I add new transparent colors
in the centre in proportion to the size of the corresponding value range. This
also ensures that the colorbar automatically gives meaningful information.

add_data now chooses colormaps automatically, if cmap="auto" is chosen (the
default). The decision is currently only based on whether the center argument
indicates a divergent colormap, see commit b5ff3be. This meant that I had to
add center as an argument to add_data and decided to complete the interface for
scale_data_colormap by adding also new arguments mid and transparent to
add_data which saves a subsequent call to scale_data_colormap. I'm unsure about
the most compatible order of these arguments, but so far didn't find any parts
of the code which used the order of arguments beyond min and max.
- include choices for default cmap in docstring
- move new arguments of add_data to back of argument list
- add colons to docstring
- simplify if statement about range of alpha
When analysing some of my data I came across the issue that I couldn't use a divergent colormap for, e.g., correlations or t-values and at the same time let small values in the middle of the colormap be transparent. So I have adapted Brain.scale_data_colormap such that it can now handle transparency in divergent colormaps properly. Also, I added the option to set the overall alpha-level of the colormap while maintaining transparency of a particular region in the colormap. The usage of these features is demonstrated in examples/plot_resting_correlations.py.
I believe that these changes make it easier to explore suitable visualisations of divergent data and hope that you find them useful!