You signed in with another tab or window. Reload to refresh your session.You signed out in another tab or window. Reload to refresh your session.You switched accounts on another tab or window. Reload to refresh your session.Dismiss alert
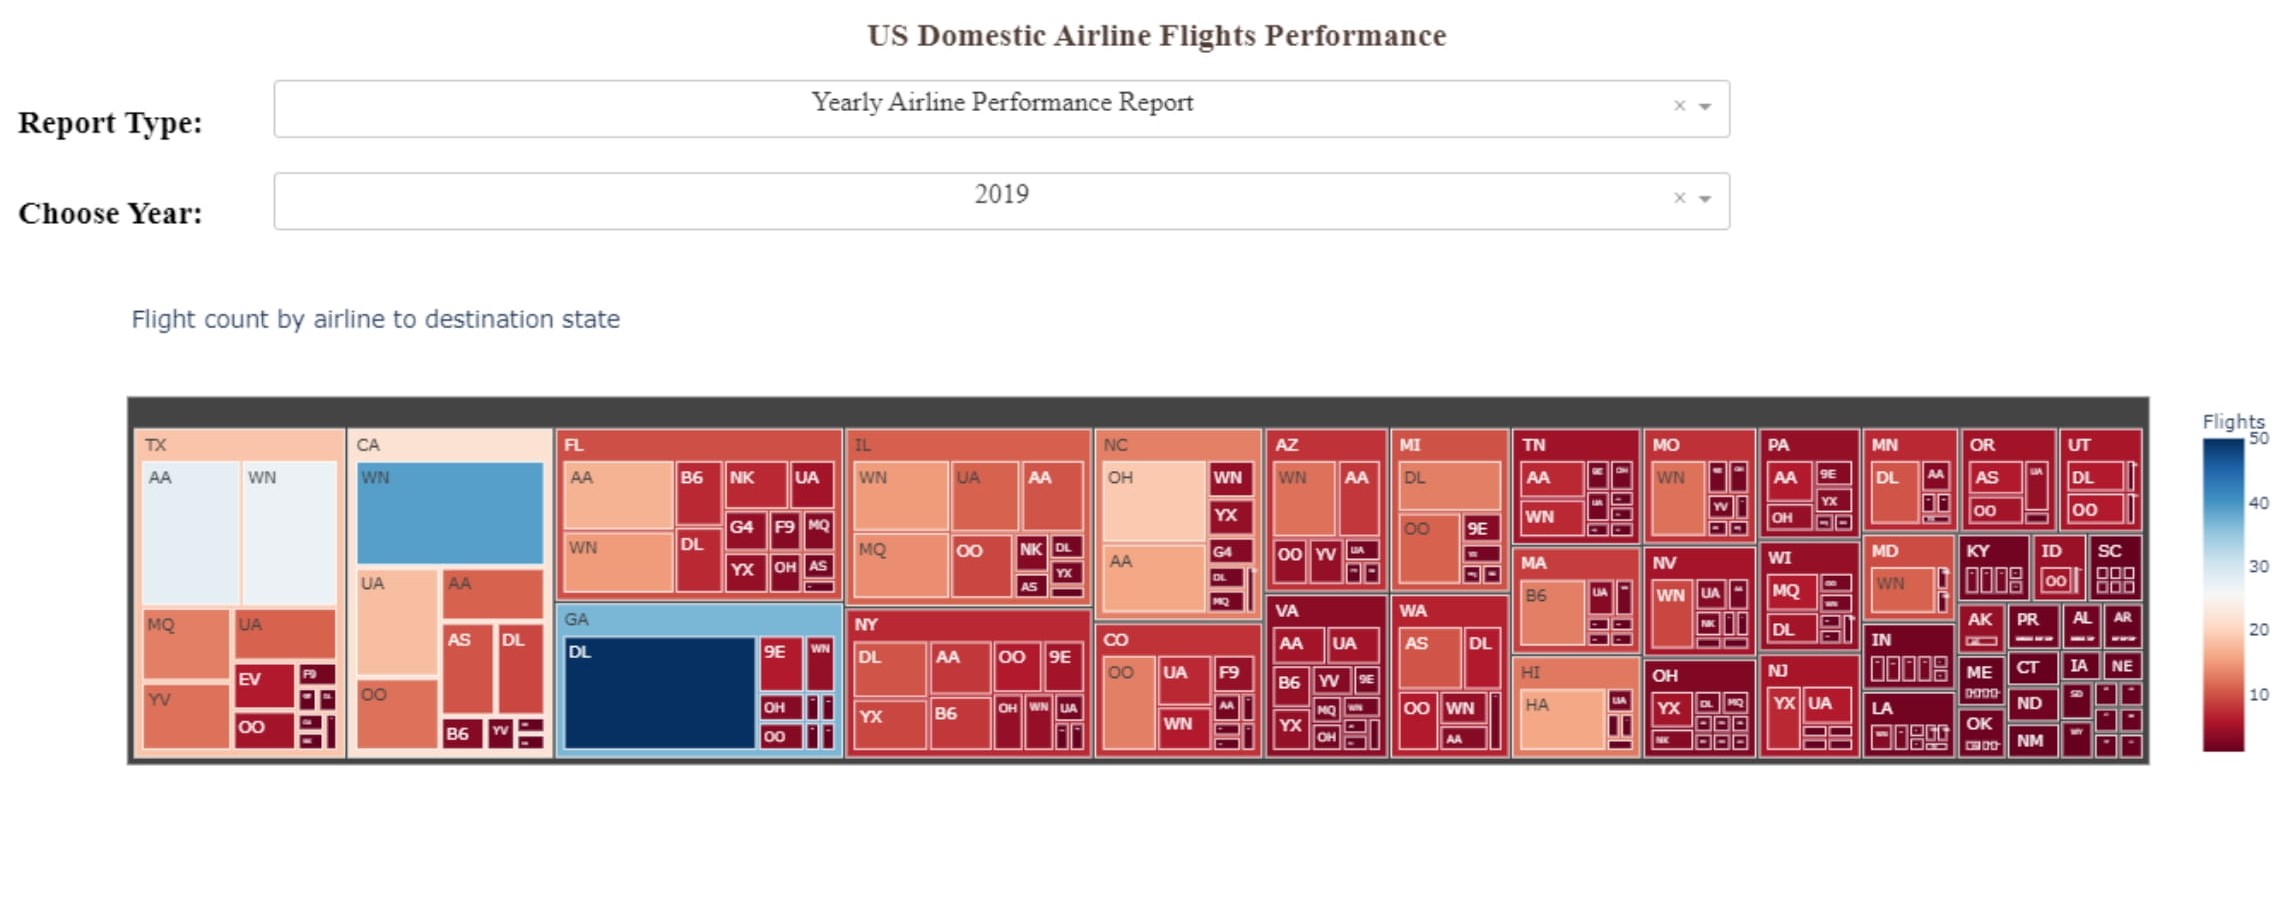
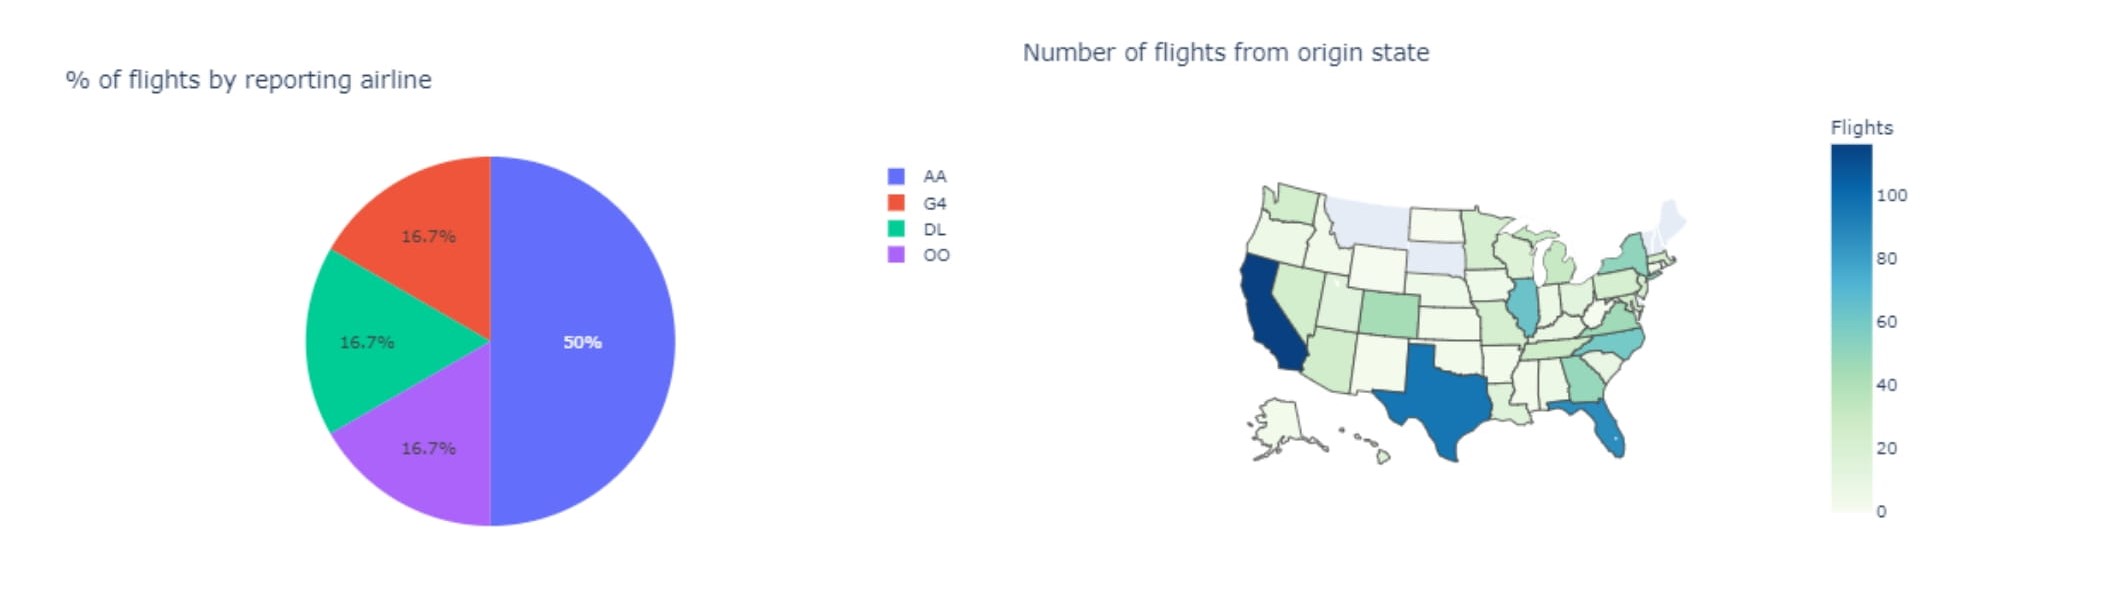
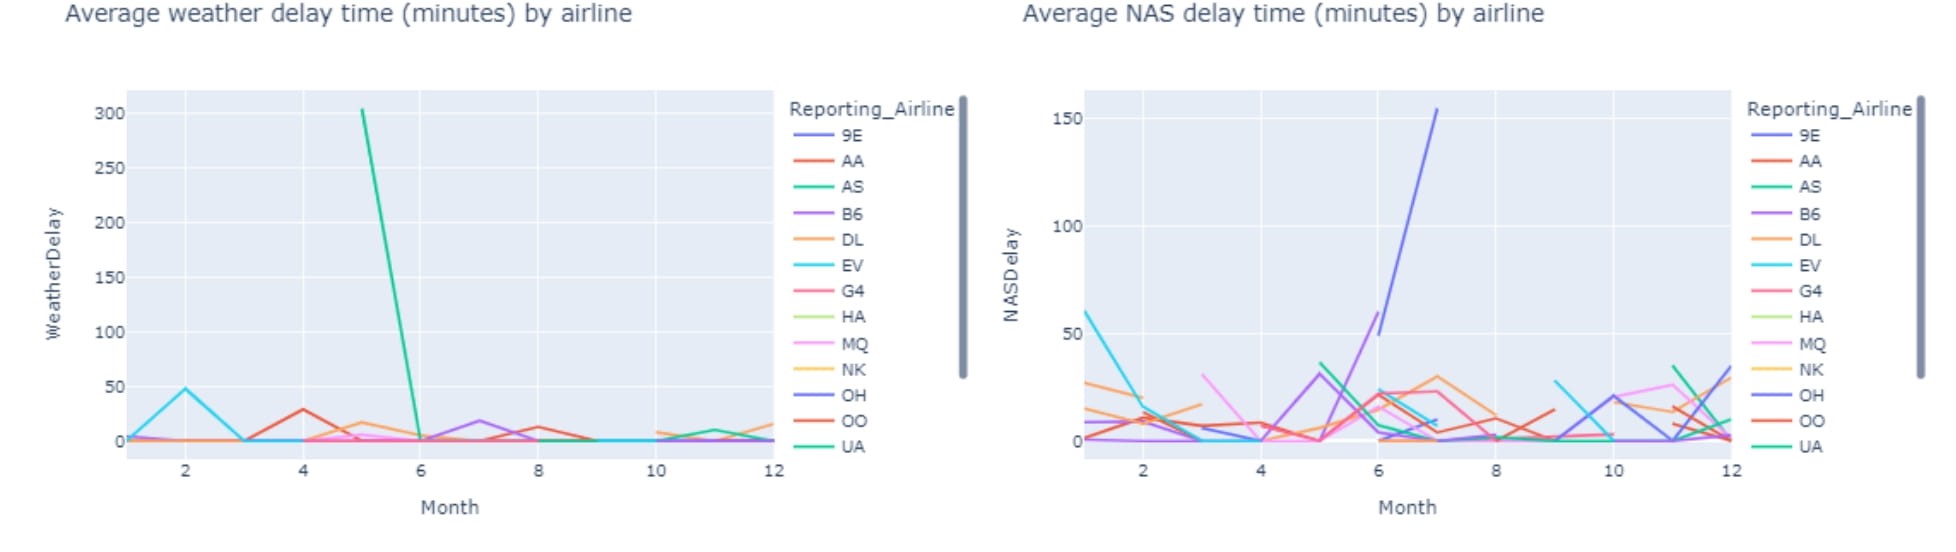
Dashboard is based on the concept of demonstrating US Domestic Airline Flights Performance and Yearly average flight delay statistics for a given year ( 2005 to 2020).