How to configure Rabbitmq Metric in Prometheus/Grafana Kubernetes #32932
Unanswered
MohdRashid01
asked this question in
Other Feature Feedback, Questions, & Ideas
Replies: 1 comment
-
|
root@rabbitmq-1:/# curl -s localhost:15692/metrics | head -n 3 # TYPE erlang_mnesia_held_locks gauge # HELP erlang_mnesia_held_locks Number of held locks. erlang_mnesia_held_locks 0 inside pod i run above command but still metric not showing in prometheus/garfana |
Beta Was this translation helpful? Give feedback.
0 replies
Sign up for free
to join this conversation on GitHub.
Already have an account?
Sign in to comment
Uh oh!
There was an error while loading. Please reload this page.
-
My question i want to add rabbitmq monitoring in prometheus. I already have rabbitmq running in Kubernetes but i dont know how to add rabbitmq metric in prometheus
I have install promethues and grafana through yaml file along with pv,pvc,storage,svc,config,deploy and cluster-role
Here is the screenshot of rabbitmq showing empty in promethues
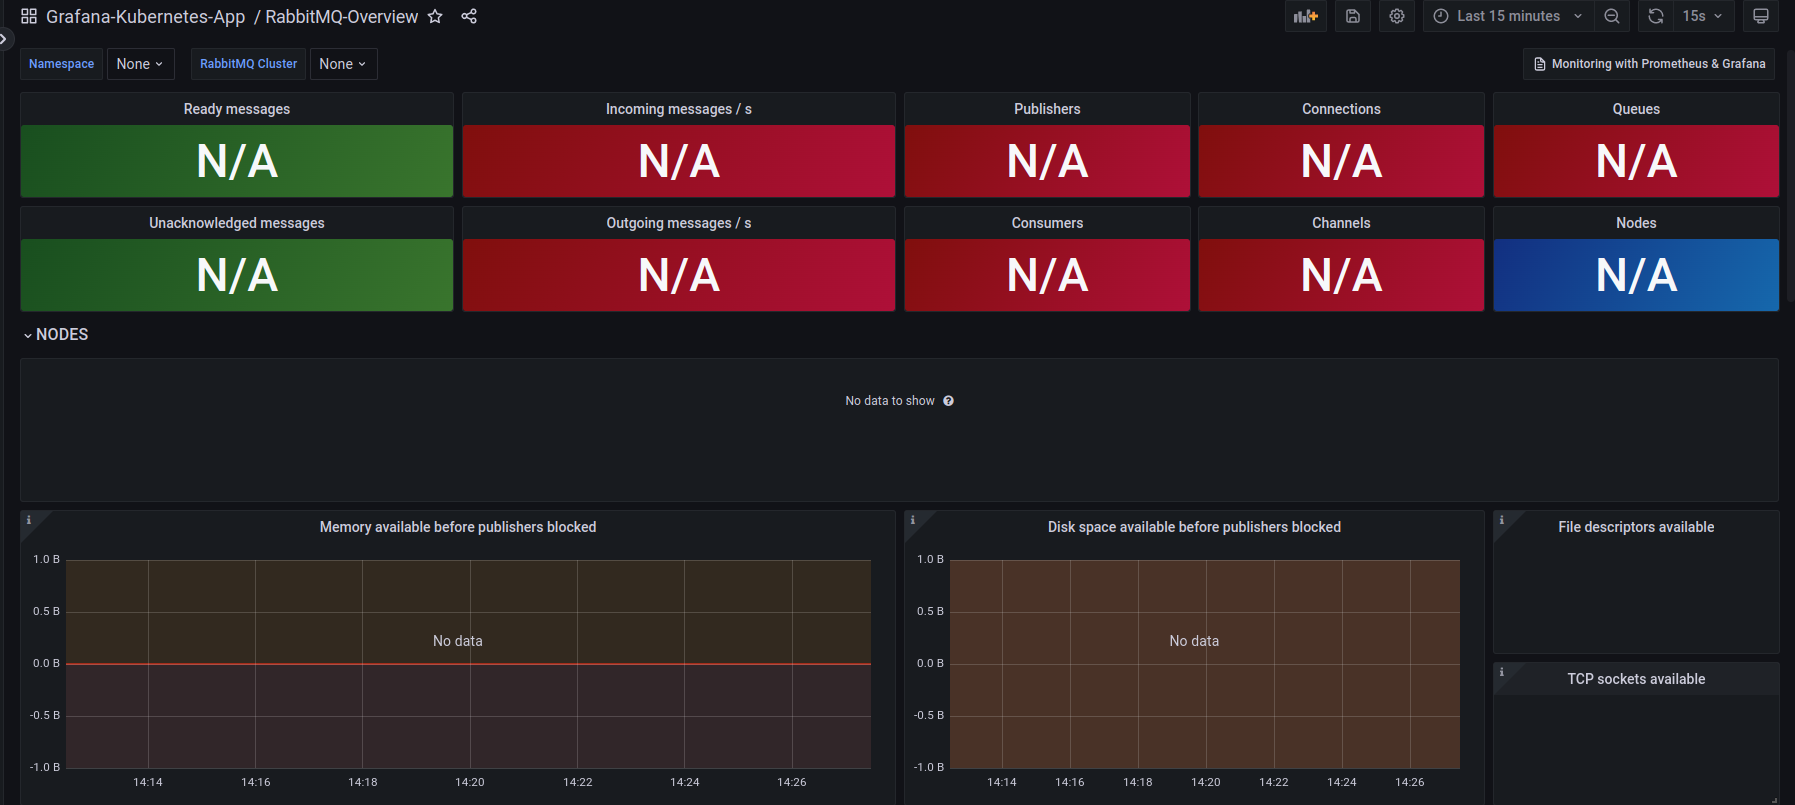
I have install Kubernetes in one vm with local storage i.e.., control-plane and node both install in one vm and everything is working fine
Here is my prometheus-config yaml file
here is my rabbitmq-svc yaml file
Please help me out how to get all information of rabbitmq in promethues/grafana
Beta Was this translation helpful? Give feedback.
All reactions