Plotting multiple PieCharts in grid makes the colors of the first be applied in all charts #162
Description
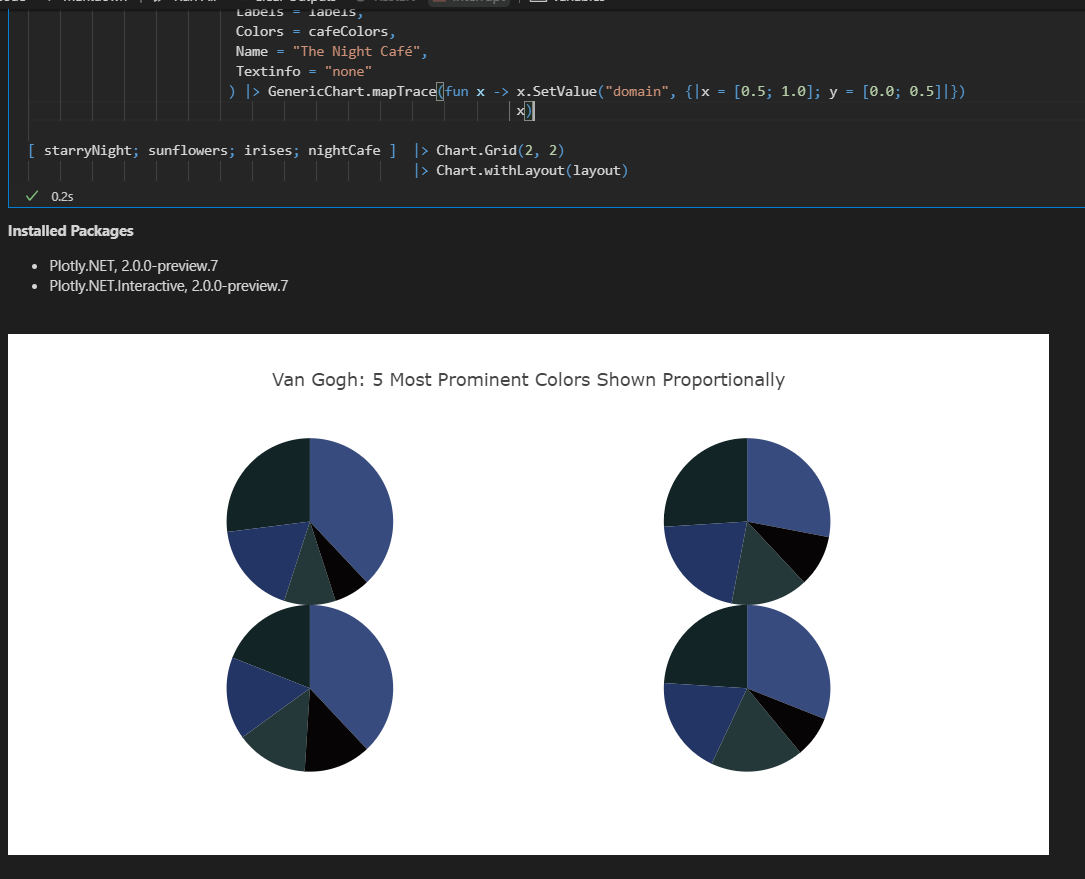
Regarding the second example of https://plotly.com/python/pie-charts/#pie-charts-in-subplots, that plots 4 pie charts, which each one has a different color configuration.
Rewriting the example in plotly.net, the color of the first pie chart is applied to the other ones:
#r "nuget: Plotly.NET, 2.0.0-preview.7"
#r "nuget: Plotly.NET.Interactive, 2.0.0-preview.7"
open Plotly.NET

let labels = ["1st"; "2nd"; "3rd"; "4th"; "5th"]
let nightColors = ["rgb(56, 75, 126)"; "rgb(18, 36, 37)"; "rgb(34, 53, 101)"; "rgb(36, 55, 57)"; "rgb(6, 4, 4)"]
let sunflowersColors = ["rgb(177; 127; 38)"; "rgb(205; 152; 36)"; "rgb(99; 79; 37)"; "rgb(129; 180; 179)"; "rgb(124; 103; 37)"]
let irisesColors = ["rgb(33; 75; 99)"; "rgb(79; 129; 102)"; "rgb(151; 179; 100)";"rgb(175; 49; 35)"; "rgb(36; 73; 147)"]
let cafeColors =  ["rgb(146; 123; 21)"; "rgb(177; 180; 34)"; "rgb(206; 206; 40)"; "rgb(175; 51; 21)"; "rgb(35; 36; 21)"]

let layout = Layout.init(Title = Title.init(Text = "Van Gogh: 5 Most Prominent Colors Shown Proportionally"),
                          Showlegend = false,
                          Width = 1000.0,
                          Height = 500.0)

let starryNight = Chart.Pie([38; 27; 18; 10; 7],
                          Labels = labels,
                          Colors = nightColors,
                          Name = "Starry Night",
                          Textinfo = "none"
                         ) |> GenericChart.mapTrace(fun x -> x.SetValue("domain", {|x = [0.; 0.5]; y = [0.5; 1.0]|})
                                                             x)

let sunflowers = Chart.Pie([28; 26; 21; 15; 10],
                           Labels = labels,
                           Colors = sunflowersColors,
                           Name = "Sunflowers",
                           Textinfo = "none"
                          ) |> GenericChart.mapTrace(fun x -> x.SetValue("domain", {|x = [0.5; 1.0]; y = [0.5; 1.0]|})
                                                              x)

let irises = Chart.Pie([38; 19; 16; 14; 13],
                       Labels = labels,
                       Colors = irisesColors,
                       Name = "Irises",
                       Textinfo = "none"
                      ) |> GenericChart.mapTrace(fun x -> x.SetValue("domain", {|x = [0.0; 0.5]; y = [0.0; 0.5]|})
                                                          x)

let nightCafe = Chart.Pie([31; 24; 19; 18; 8],
                          Labels = labels,
                          Colors = cafeColors,
                          Name = "The Night Café",
                          Textinfo = "none"
                         ) |> GenericChart.mapTrace(fun x -> x.SetValue("domain", {|x = [0.5; 1.0]; y = [0.0; 0.5]|})
                                                             x)

[ starryNight; sunflowers; irises; nightCafe ]  |> Chart.Grid(2, 2)
                                                |> Chart.withLayout(layout)