2d and 3d plots overlap when using 'subplot' -- previous solution doesn't work for plots with more than one rows #1949
Description
I met a similar issue to the one posted at 2d and 3d plots overlap when using 'subplot' #579, namely the plots do not align as expected with subplot(). The author of that issue put a solution there, but I found that the solution only works with plots with one row, but doesn't work with plots with several rows. For example:
p1 = plot_ly(x = 1, y = 1)
p2 = plot_ly(x = 1, y = 1, z = 1, type = "scatter3d")
subplot(p1, p2, nrows = 2) %>% layout(scene = list(domain = list(x = c(0, 1), y = c(0.5, 1))))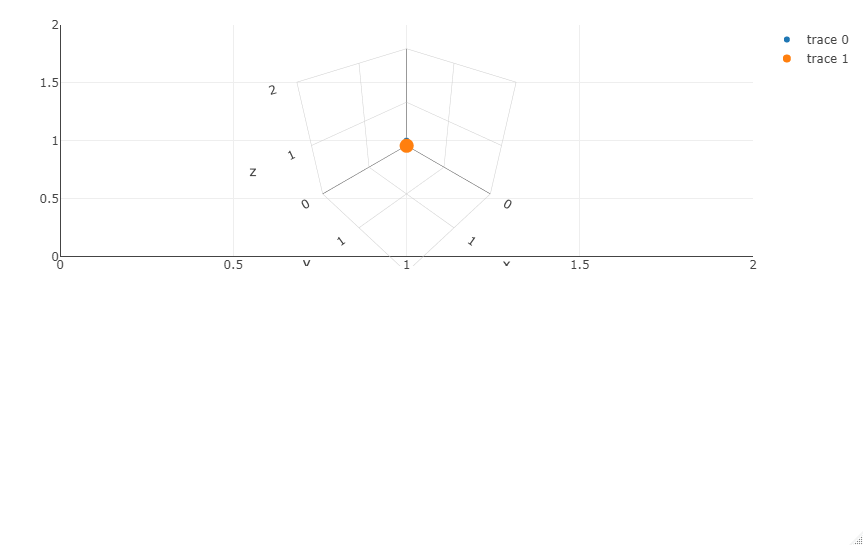
Is that a bug in the package? And are there possible workarounds? Thanks in advance for following this issue.