Could not change line edge color 'later' #1004
Description
Hi
I am trying to create a map like below (famous Arad Bucharest problem for Search algorithms) in plotly.
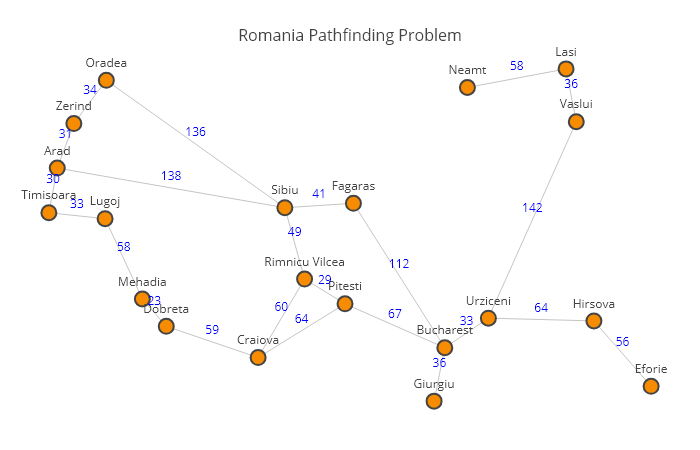
I want to change few edges(lines) colors. for eg, to show the chosen path. I could not find how to access the edges after Scatter object created.
...
edge_trace = Scatter(
    x=[],
    y=[],
    line=Line(width=0.5,color='#888'),
    hoverinfo='none',
    mode='lines+text',
    text= []
    )
...
for node, adjacencies in enumerate(G.adjacency()):
    node_trace['marker']['color'].append(len(adjacencies))
    node_info = 'Node: '+str(node)
    node_trace['text'].append(node_info)
    edge_trace['line]['color'].append(3)             #THIS DID NOT WORK
...