Second plot not working #381
Description
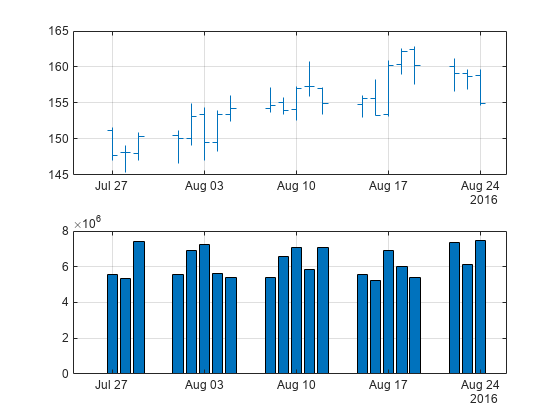
Here is the code. Bottom bar plot is generated well, however, top plot is not.
Reference: https://uk.mathworks.com/help/finance/priceandvol.html
load SimulatedStock.mat;
priceandvol(TMW(end-20:end,:));
produces: https://chart-studio.plotly.com/~danton267/1212/#/
instead of: https://uk.mathworks.com/help/examples/finance/win64/PriceVolumeChartForDataSeriesForStockExample_01.png
Metadata
Metadata
Assignees
Labels
No labels