[Bug Report] Chart not correctly resetting #473
Description
After being reset once, the chart visualisation element is not properly reset for any further resets. It will correctly do the first simulation and correctly adapt to one reset. However it then repeats past values for all subsequent runs.
This can easily be seen by changing the 'Number of agents' in the virus_on_networks example. Note that by the second run, the number of agents in the chart will not add up to the number of agents in the parameters.
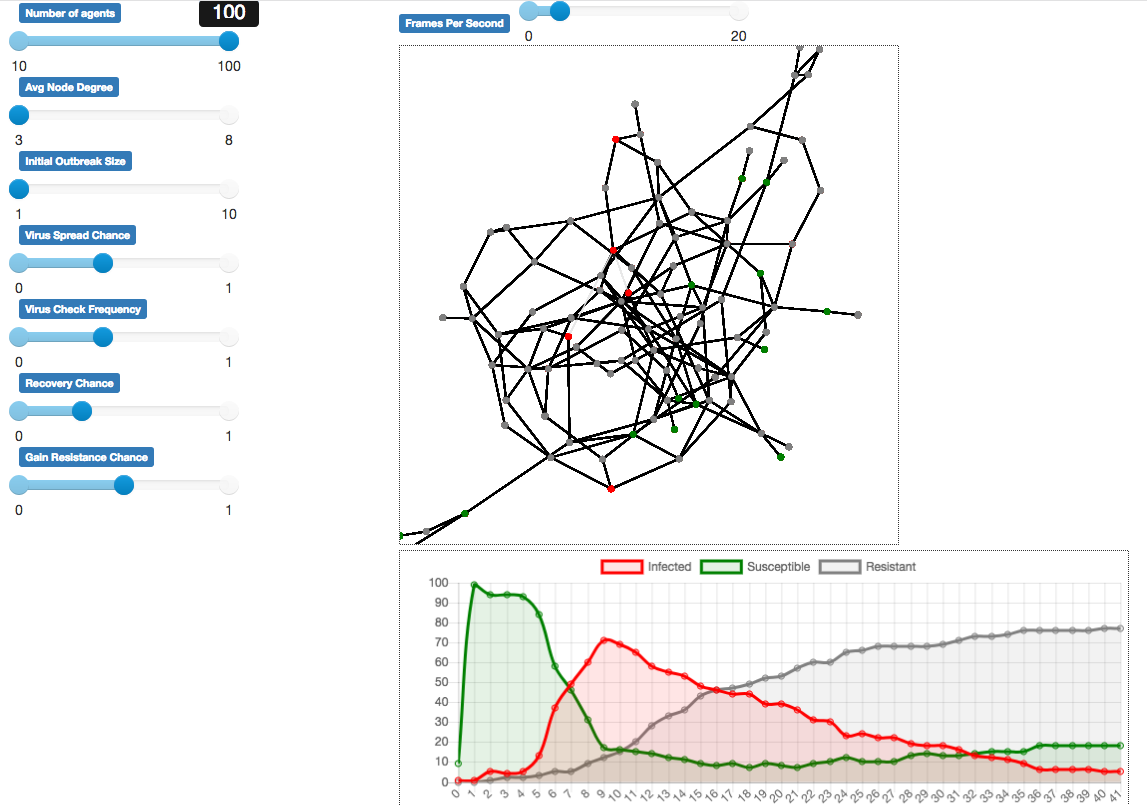
Simulation with 100 nodes with chart displaying correctly (no reset):
Simulation with 10 nodes (after reset from previous simulation):

Metadata
Metadata
Assignees
Labels
No labels