Repository navigation
Releases: proteomicsunitcrg/qcloud2-client
Release list
v1.3.0

Instrument view pages now show a small banner when that instrument has an unprocessed file error, linking straight to a pre-filtered Pipeline Status view. Also fixed: the lab system filter on the Pipeline Status dashboard now actually works.
v1.2.3
On the "Pipeline Status" tab, a file still being processed (with no elapsed time known yet) showed the bare word "processing" instead of a running clock. It now shows the actual elapsed time, ticking up live, same as any other in-progress file.
v1.2.2
On the "Pipeline Status" tab, a file could get stuck showing "queued" in the "Time to process" column even though it was already processing or had already finished successfully - the status icon was correct, only that one column lagged behind. It's fixed now: that column reflects the file's real status, and shows the actual elapsed time even in the rare case where the pipeline's own start-time signal never arrived.
v1.2.1
What's new
- Fixed the Find/Reload buttons sometimes wrapping onto two lines on the Pipeline Status tab.
- Clarified two column labels in the Results/Download popup: "Retention time" is now "Retention time drift" (min), and "Peak area" is now "Peptide area" (log2) - same values as before, clearer names.
v1.2.0
What's new
- New "Pipeline Status" tab: track incoming instrument files live as they move through the pipeline (received, processing, processed, or error), with automatic status refresh.
- Clicking an error shows a details popup with the sample, QC code, acquisition date, lab system, sample type, and a plain-language reason for the failure.
- Files tab restyled to match the new dashboard look, and made noticeably faster to load.
v1.1.2
Fix: the file results table and downloaded TSV files could show values under the wrong column (read by position instead of by parameter name), the "Sample type" filter was missing bsa_dia/hela_dia, and both Results and Download could list more metrics than the instrument's actual chart page shows. Table/TSV columns are now matched by name, units match the chart titles, and both views only include metrics genuinely displayed on the corresponding chart.
v1.1.1
Fix: charts and the traffic light dropdown could disagree with each other on whether a metric was actually within its threshold (e.g. a chart showing every point inside its band while the traffic light still marked it red, or the reverse). Both now consistently reflect the current threshold for every point shown.
Fixes #27.
v1.1.0
Release 1.0.20 [QCloud 2.1.1b]
We just published a new QCloud release (2.1.1b) with some internal improvements:
- QCloud Logo and QCrawler uploaders.
- Now the password for the administrator is synchronized with internal API credentials.
- Some minor bug fixes.
Release 1.0.19 [QCloud 2.1.1]
We just published a new QCloud release (2.1.1) with a new annotations system. We have reordered them in families and created a new hovering menu to simplify its access. Just take a look and if you have some comment or suggestion please let us know at qcloud@crg.eu. A screenshot:
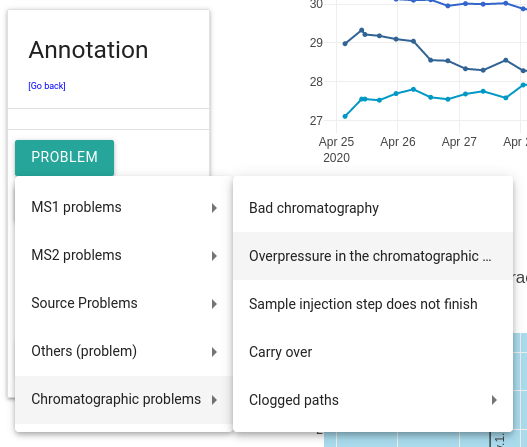
We also fixed some bugs at the threshold editor and the view creator.