Web Dashboard
yacron2 includes a built-in web dashboard: a single, self-contained HTML page
(one inline <script>, inline styles, no external assets, no build step, and no
database) served by the optional HTTP Control API. It turns the daemon
into a live, keyboard-driven control room — watch every job's status, tail its
output as it runs, review run history, and preview upcoming schedules, all from a
browser.
The dashboard is part of the HTTP interface, so it appears as soon as you add a
web section with at least one http:// listener (see
HTTP Control API for the full configuration reference):
web:
  listen:
    - http://127.0.0.1:8080
Open the listener's root path in a browser — http://127.0.0.1:8080/ for the
example above. The page is served at / on every http:// listener and is
self-contained, so nothing else needs to be installed or hosted.
The HTML document is returned with defence-in-depth security headers, including a
strict Content-Security-Policy (default-src 'self', connect-src 'self',
frame-ancestors 'none', anti-clickjacking X-Frame-Options: DENY, and
X-Content-Type-Options: nosniff). Any header you set under web.headers is
merged on top of these defaults, so you can relax or extend them deliberately.
To expose only the REST API and not the dashboard, set ui: false:
web:
  listen:
    - http://127.0.0.1:8080
  ui: false
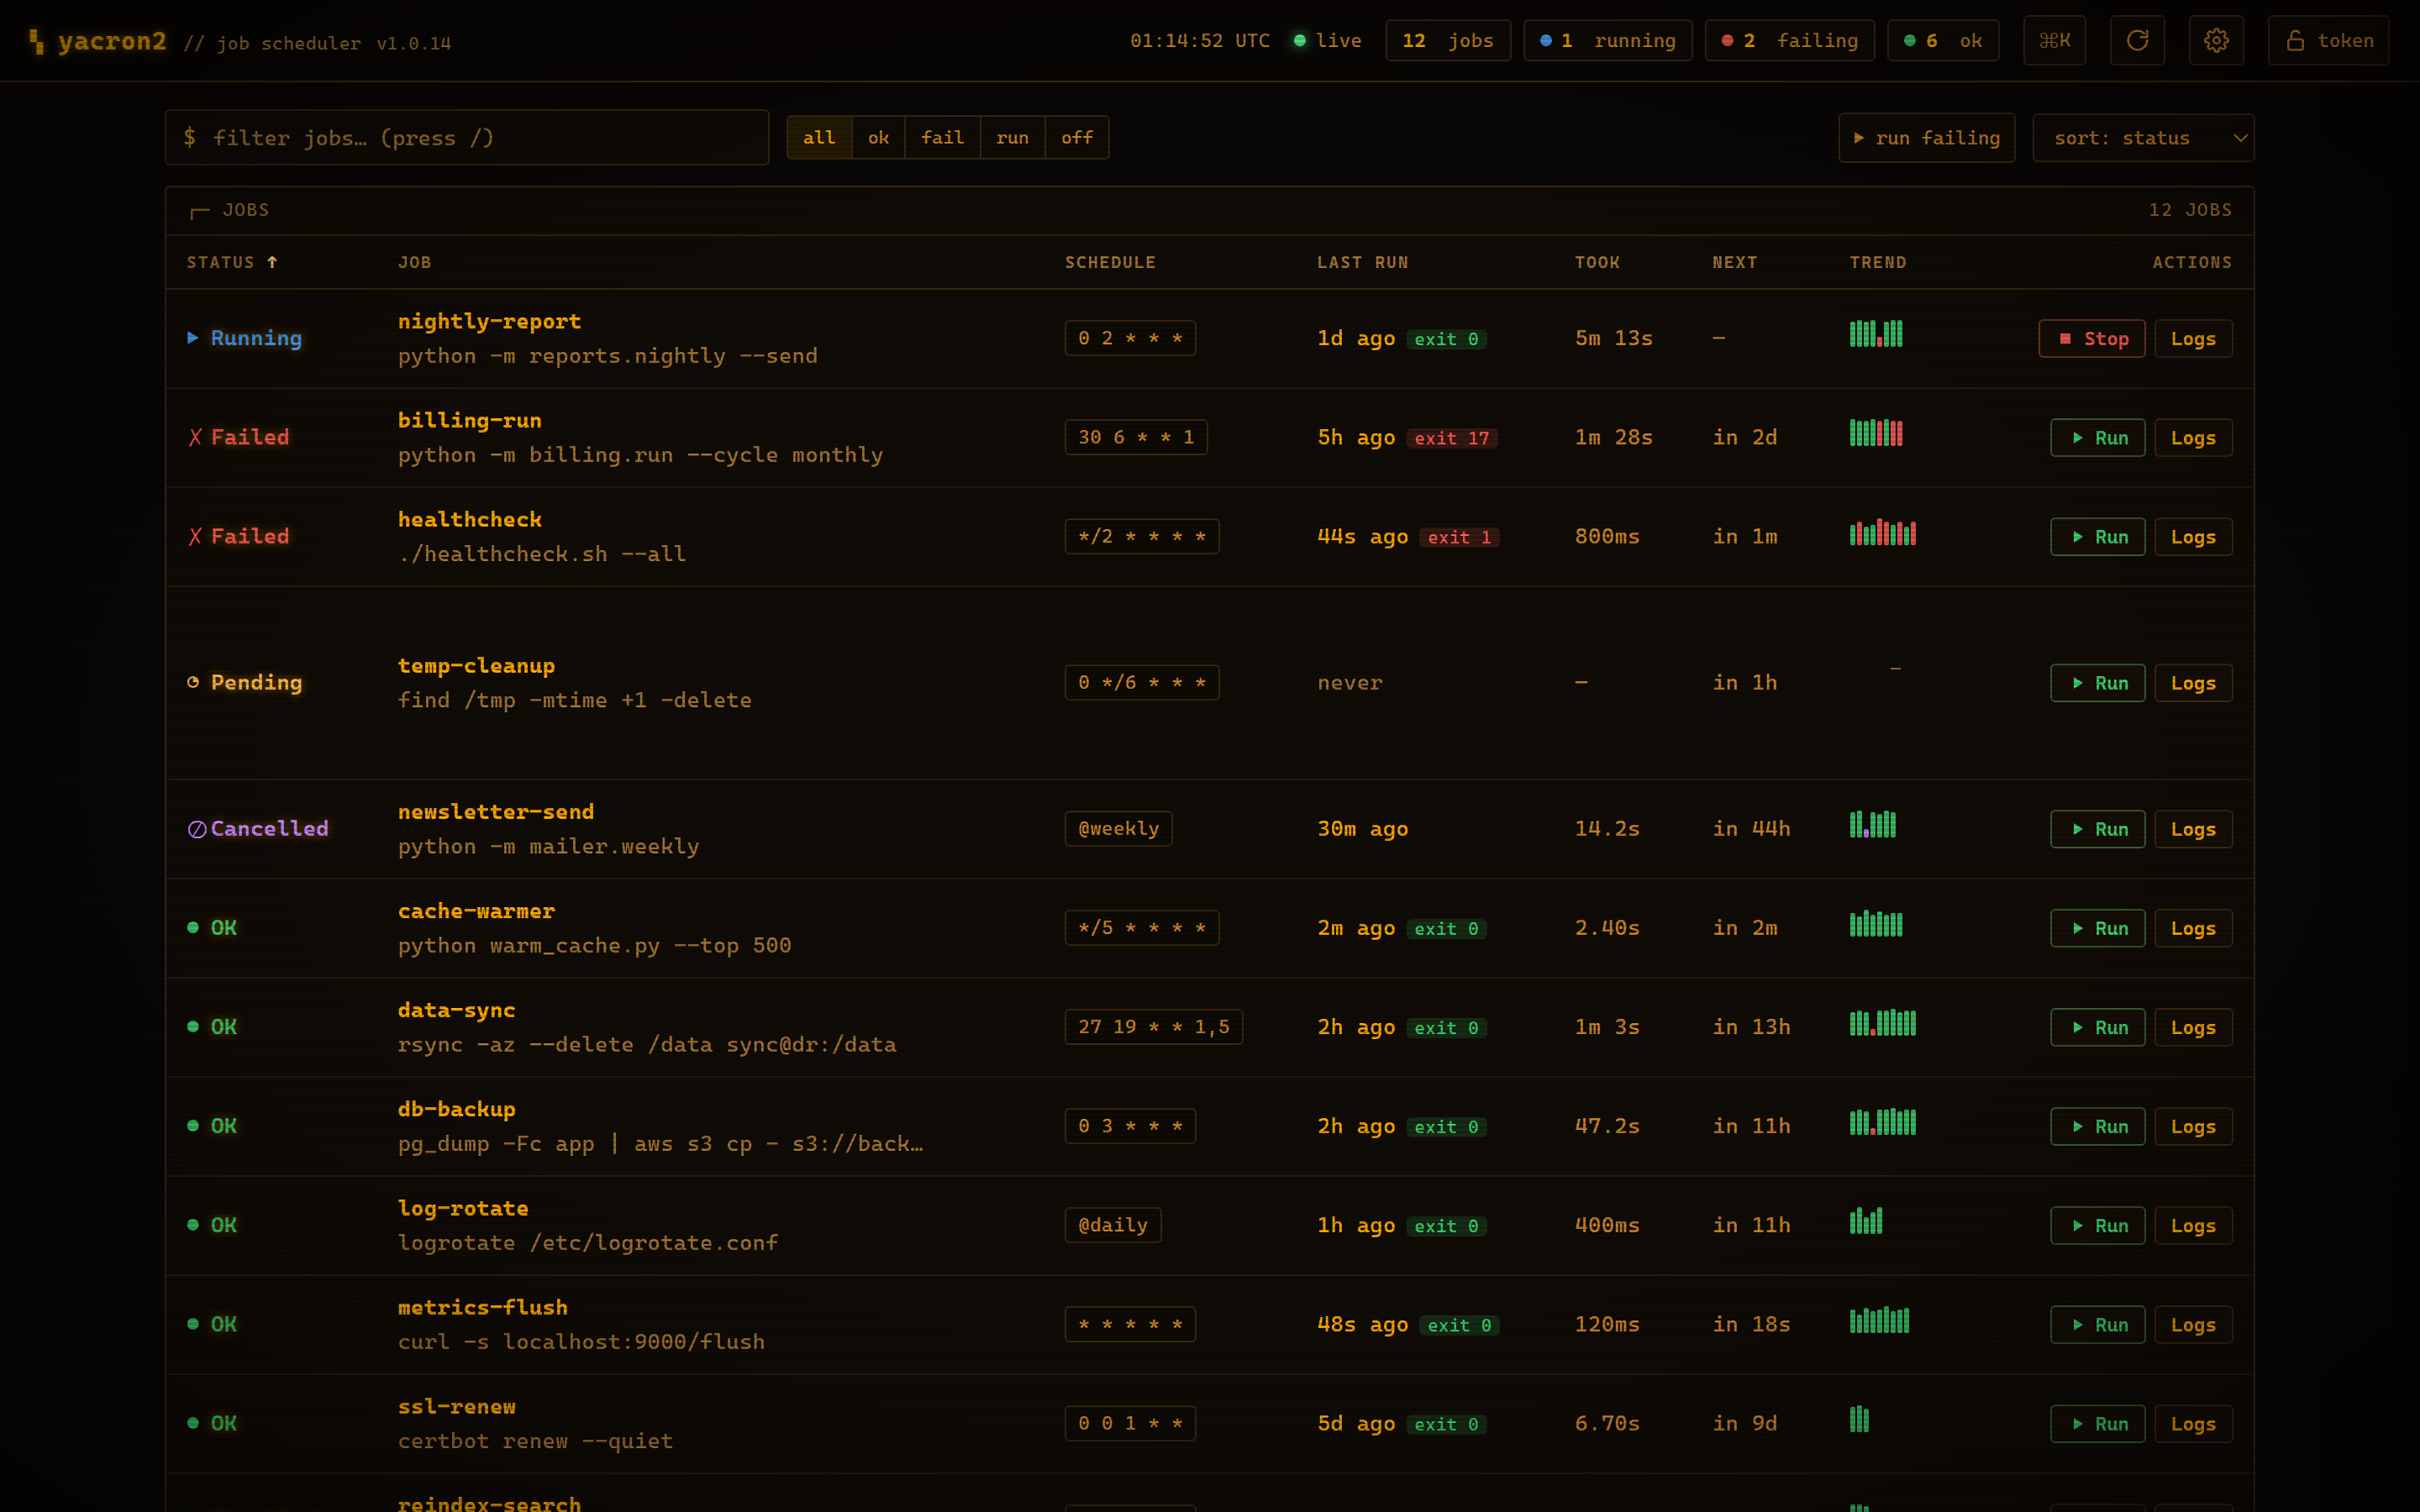
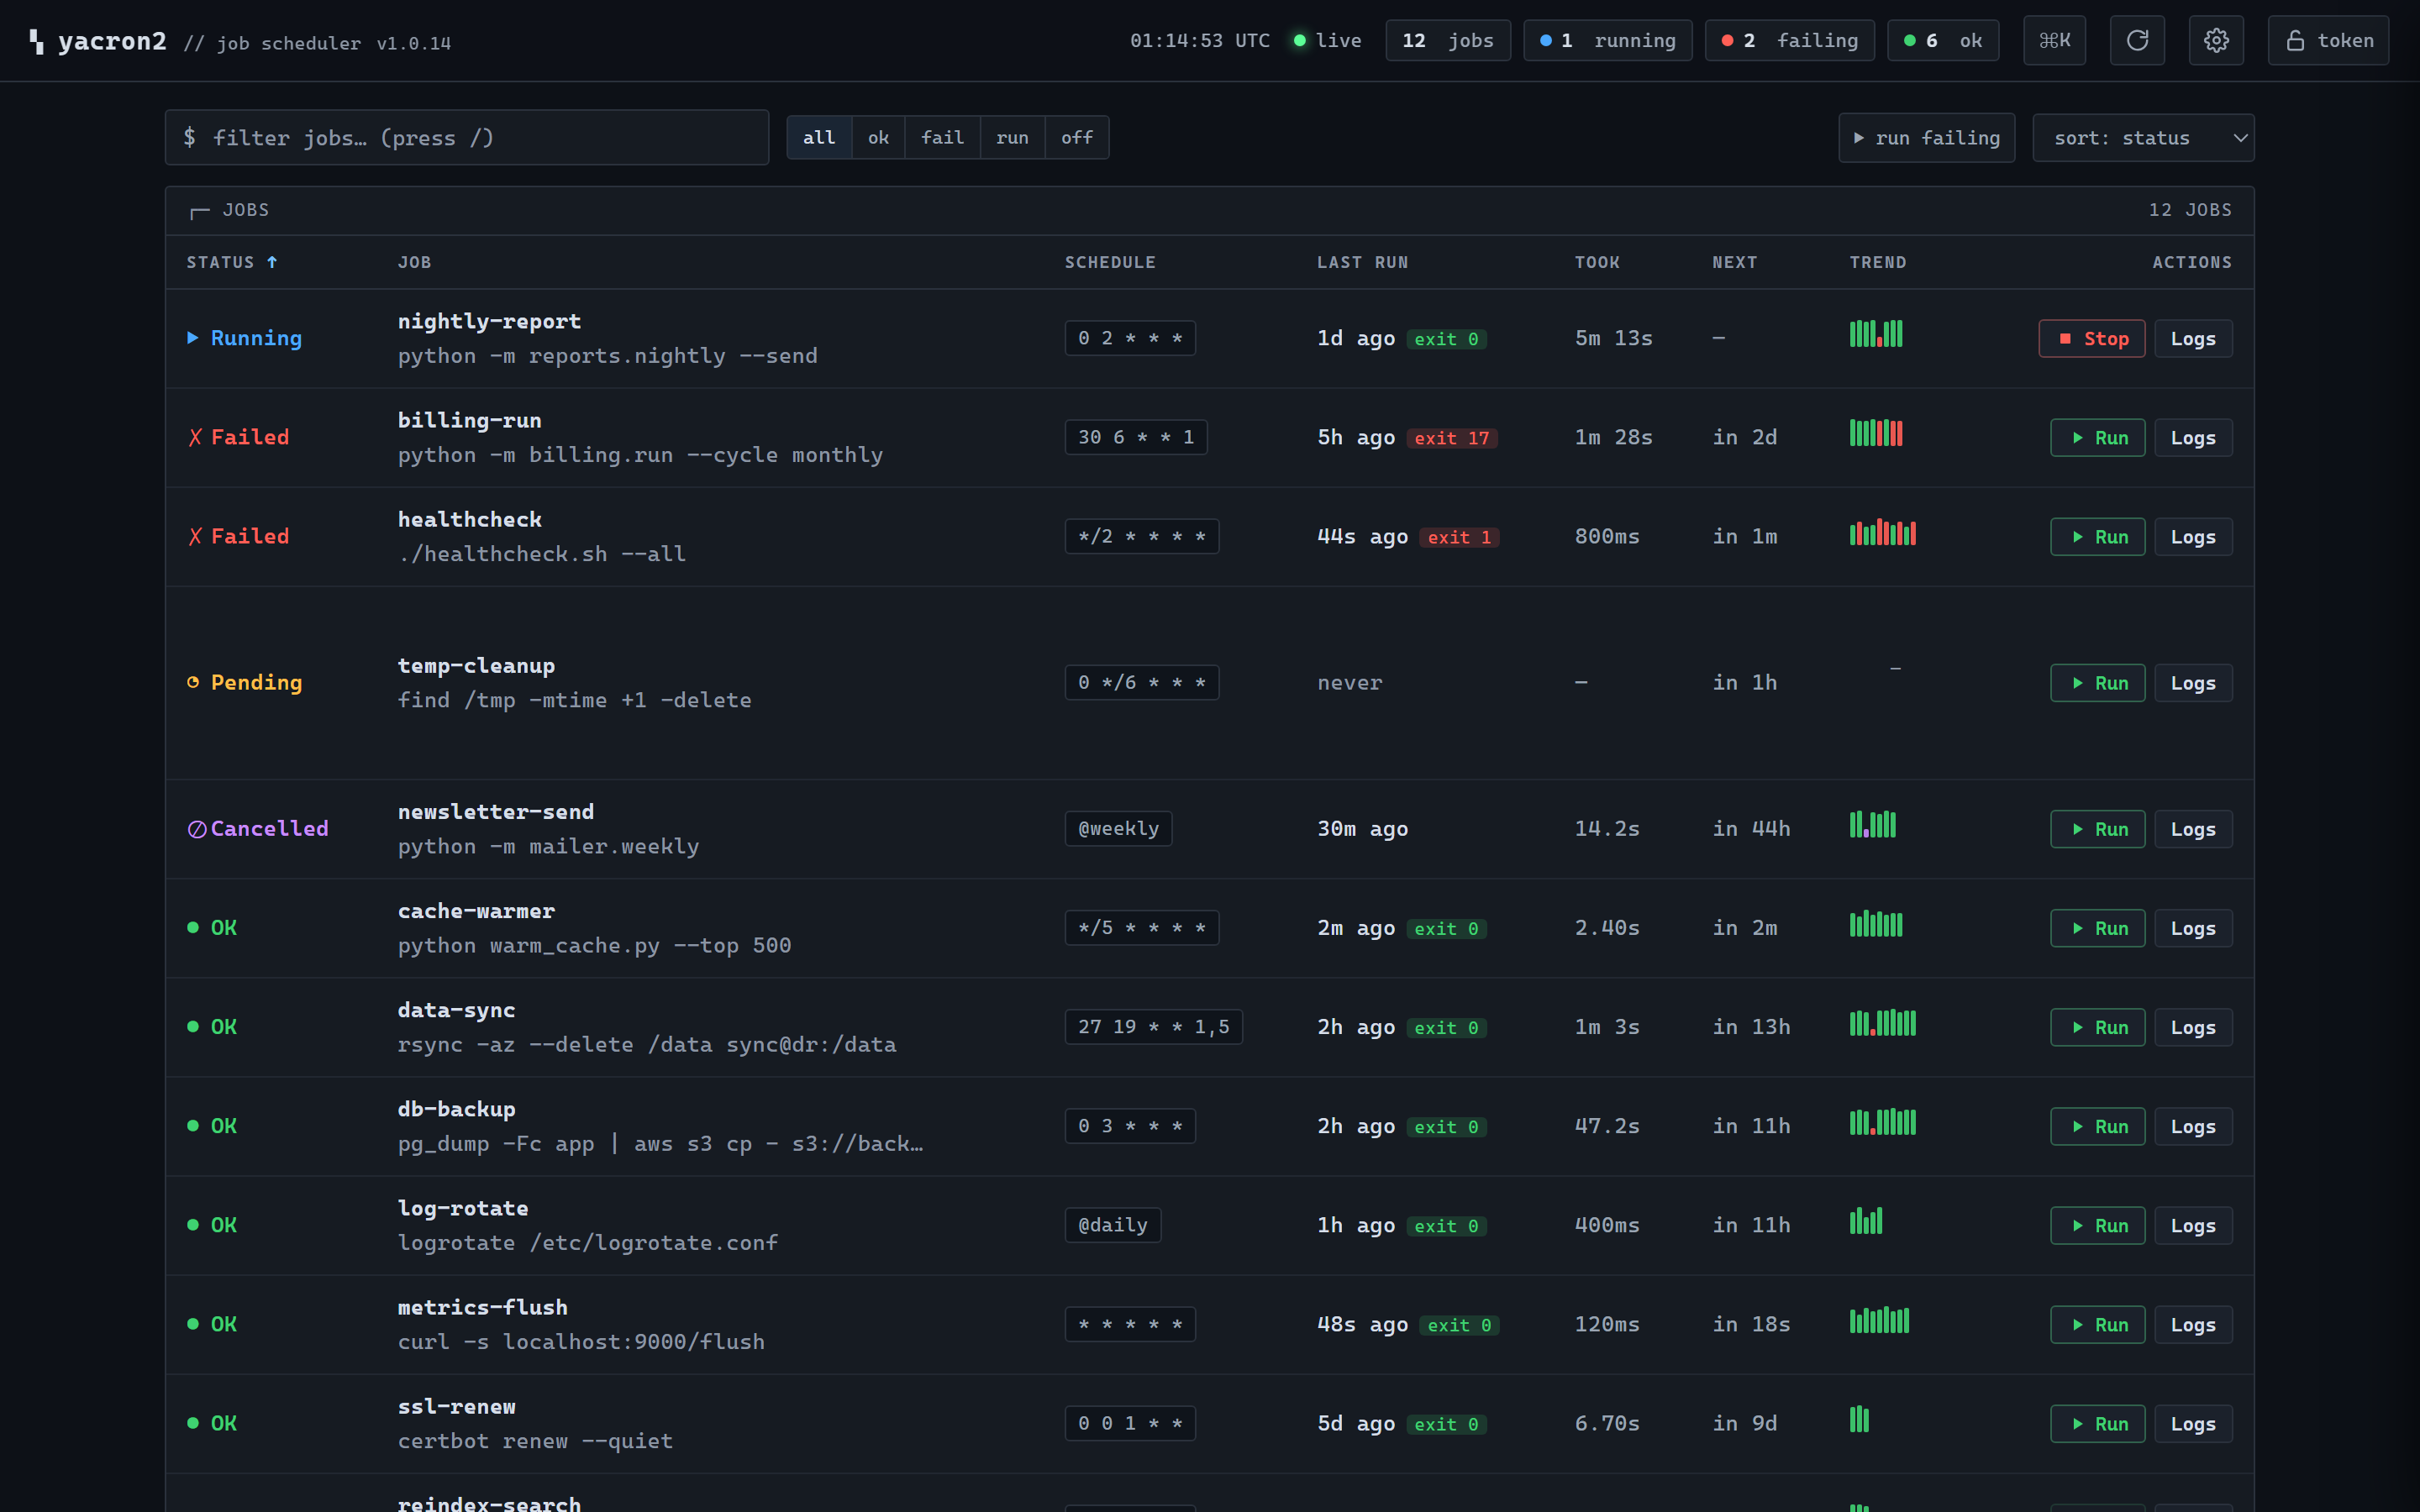
The landing page is a single sortable, filterable table of every configured job.
The header carries a live UTC clock, a connection indicator (live when the
server is responding, no signal when polls are failing — hover it to see how
long ago the last successful response arrived), and summary pills counting the
total jobs and how many are running, failing, and OK.
Each row shows:
| Column | What it shows |
|---|---|
| Status | The job's current health — one of Running, Failed, OK, Pending (enabled but never run yet), Cancelled, or Disabled (enabled: false) — each with a colour and glyph. |
| Job | The job name and its command. |
| Schedule | The raw schedule string; hover it for a plain-English reading. |
| Last run | How long ago the last run finished (kept fresh every second) and an exit-code badge. |
| Took | The last run's duration. |
| Next | A live countdown to the next scheduled run (— while running or disabled). |
| Trend | A sparkline of recent runs — one bar per run, height by duration, coloured by outcome. |
| Actions | One-click Run (or Stop, for a running job) and Logs. |
The toolbar above the table lets you:
-
filter by typing in the search box (matches name or command — press
/to focus it); - narrow by status with the all / ok / fail / run / off segmented control;
- sort by name, status, last run, next run, or duration (from the dropdown, or by clicking a column header — click again to reverse);
- run every failing job at once with the run failing button.
Clicking a job (or pressing Enter on the selected row) opens a detail drawer
with three tabs: Logs, History, and Schedule. The drawer header
repeats the job's status, schedule (with its plain-English reading), the running
PID(s), and a one-click button to copy the command. Jobs are deep-linkable —
opening a job updates the URL to #job/<name>, so you can bookmark or share a
direct link to it.
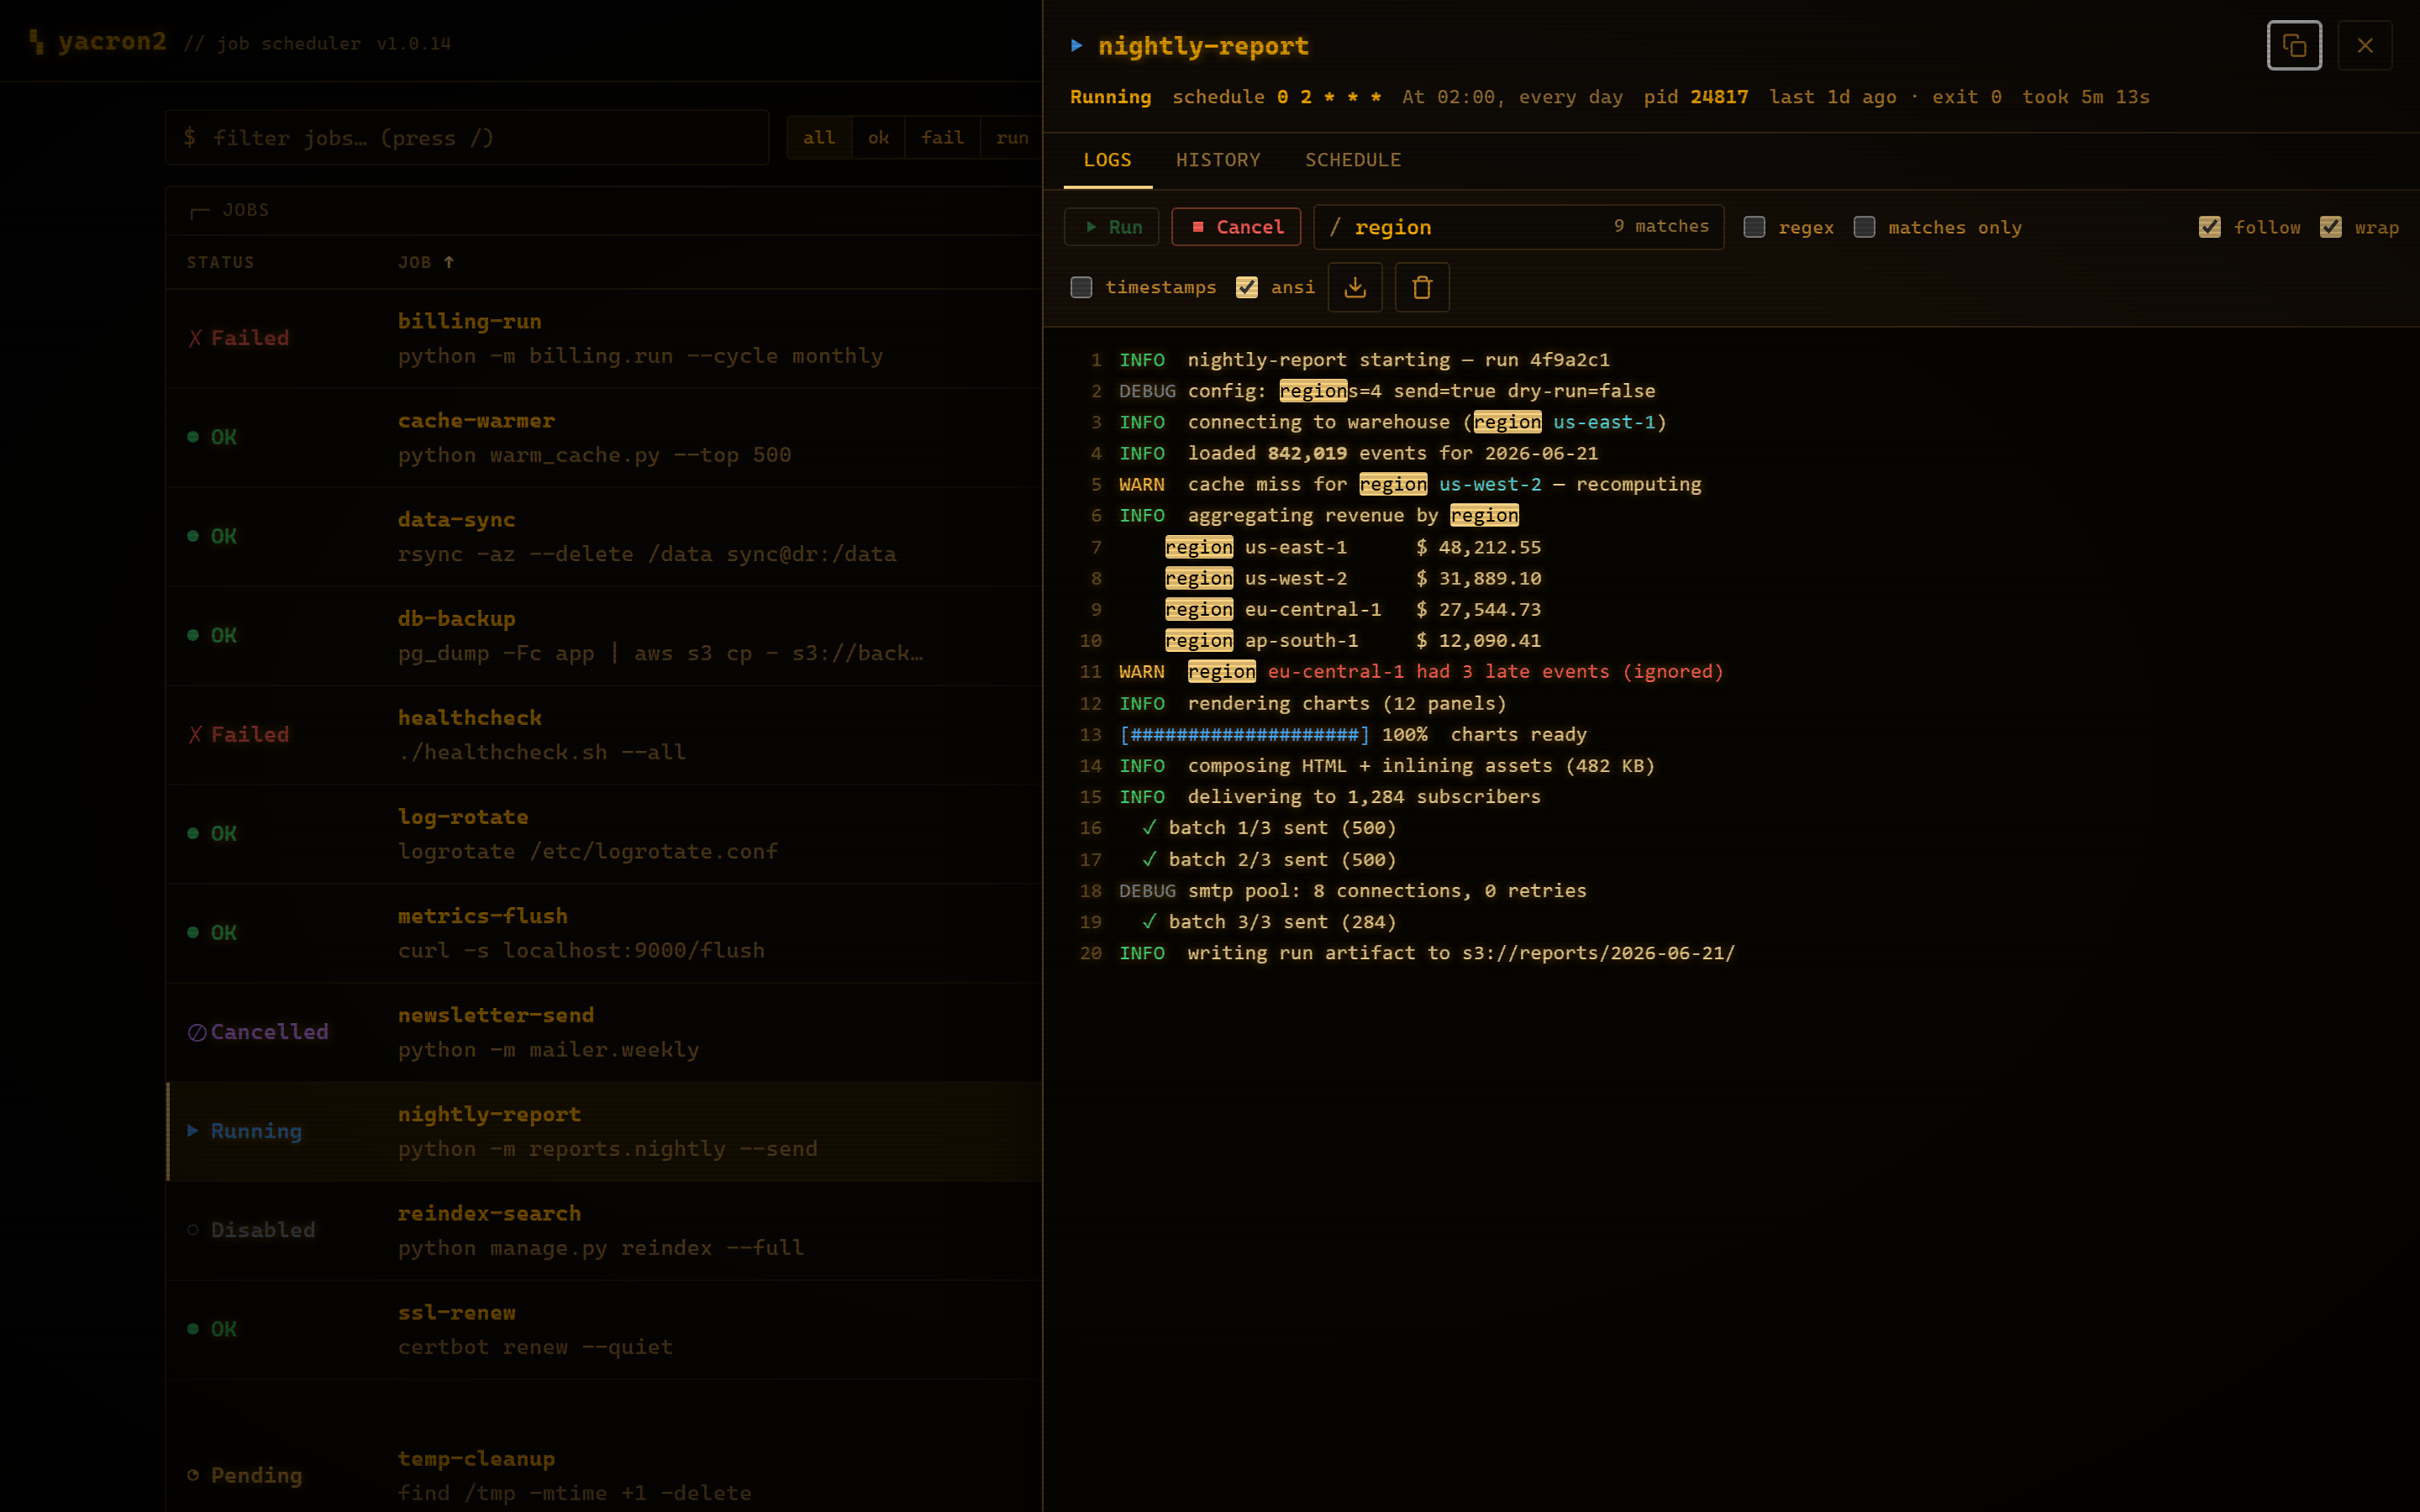
The Logs tab streams a job's captured output over Server-Sent Events: it replays the most recent buffered lines first, then appends new lines live as a running job produces them. Features:
-
ANSI colour rendering (toggle off to see raw text), with
stderrlines distinguished fromstdout; - absolute line numbers and optional per-line timestamps;
- in-log search / grep, plain-text or regex, with a live match count,
Enterto jump between matches, and a matches-only mode that hides non-matching lines; - follow (auto-scroll) and line-wrap toggles;
- one-click download of the buffered log, and a clear button;
- Run and Cancel buttons right above the output.
Output is only available for the streams a job captures, so enable
captureStdout / captureStderr on jobs whose output you
want to watch here. (If neither is enabled, the pane says so rather than sitting
empty.) The view is bounded to the most recent lines so a chatty job can't grow
the tab without limit.
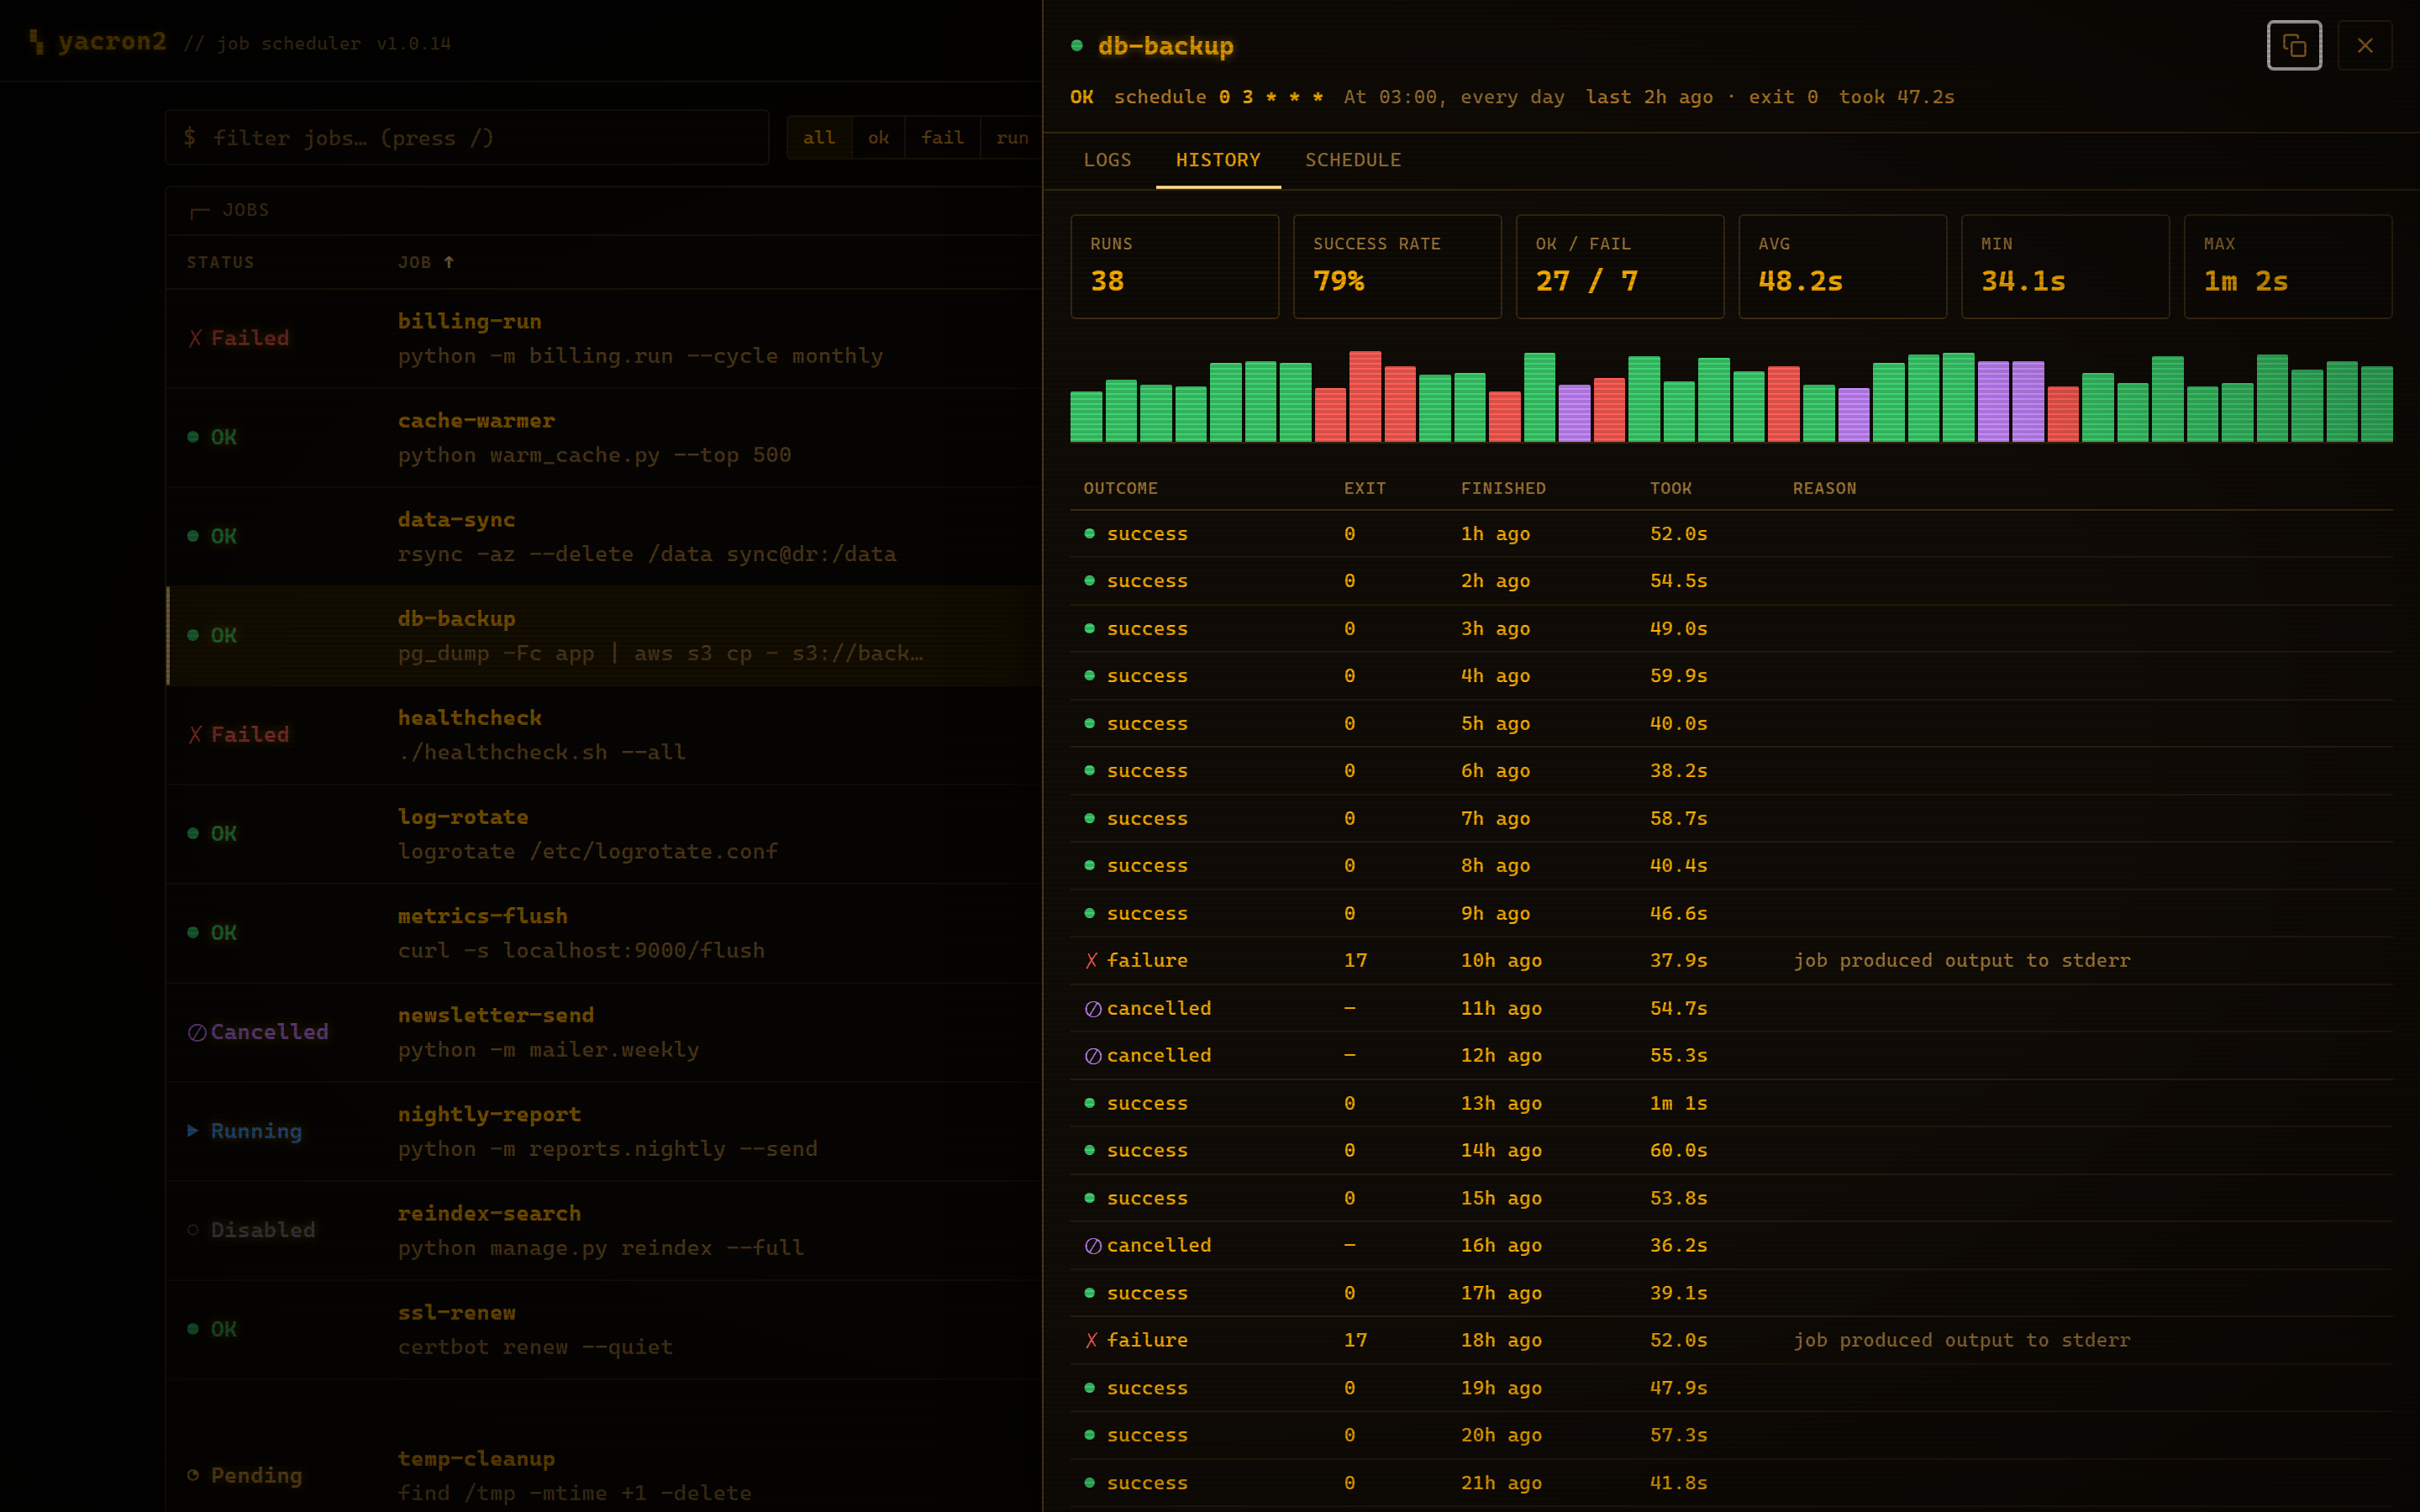
The History tab summarises the job's retained run history:
- a stats grid — total runs, success rate, OK / fail counts, and average / min / max duration. The success rate is computed over runs that ran to completion, so deliberate cancellations are excluded;
- a duration bar chart, one bar per run (newest on the right), coloured by outcome;
- a run table — outcome, exit code, when it finished, how long it took, and a reason for any run that carries one (failed runs, and runs cancelled from the dashboard).
History is retained in memory only, up to the most recent 50 runs per job, and resets when yacron2 restarts.
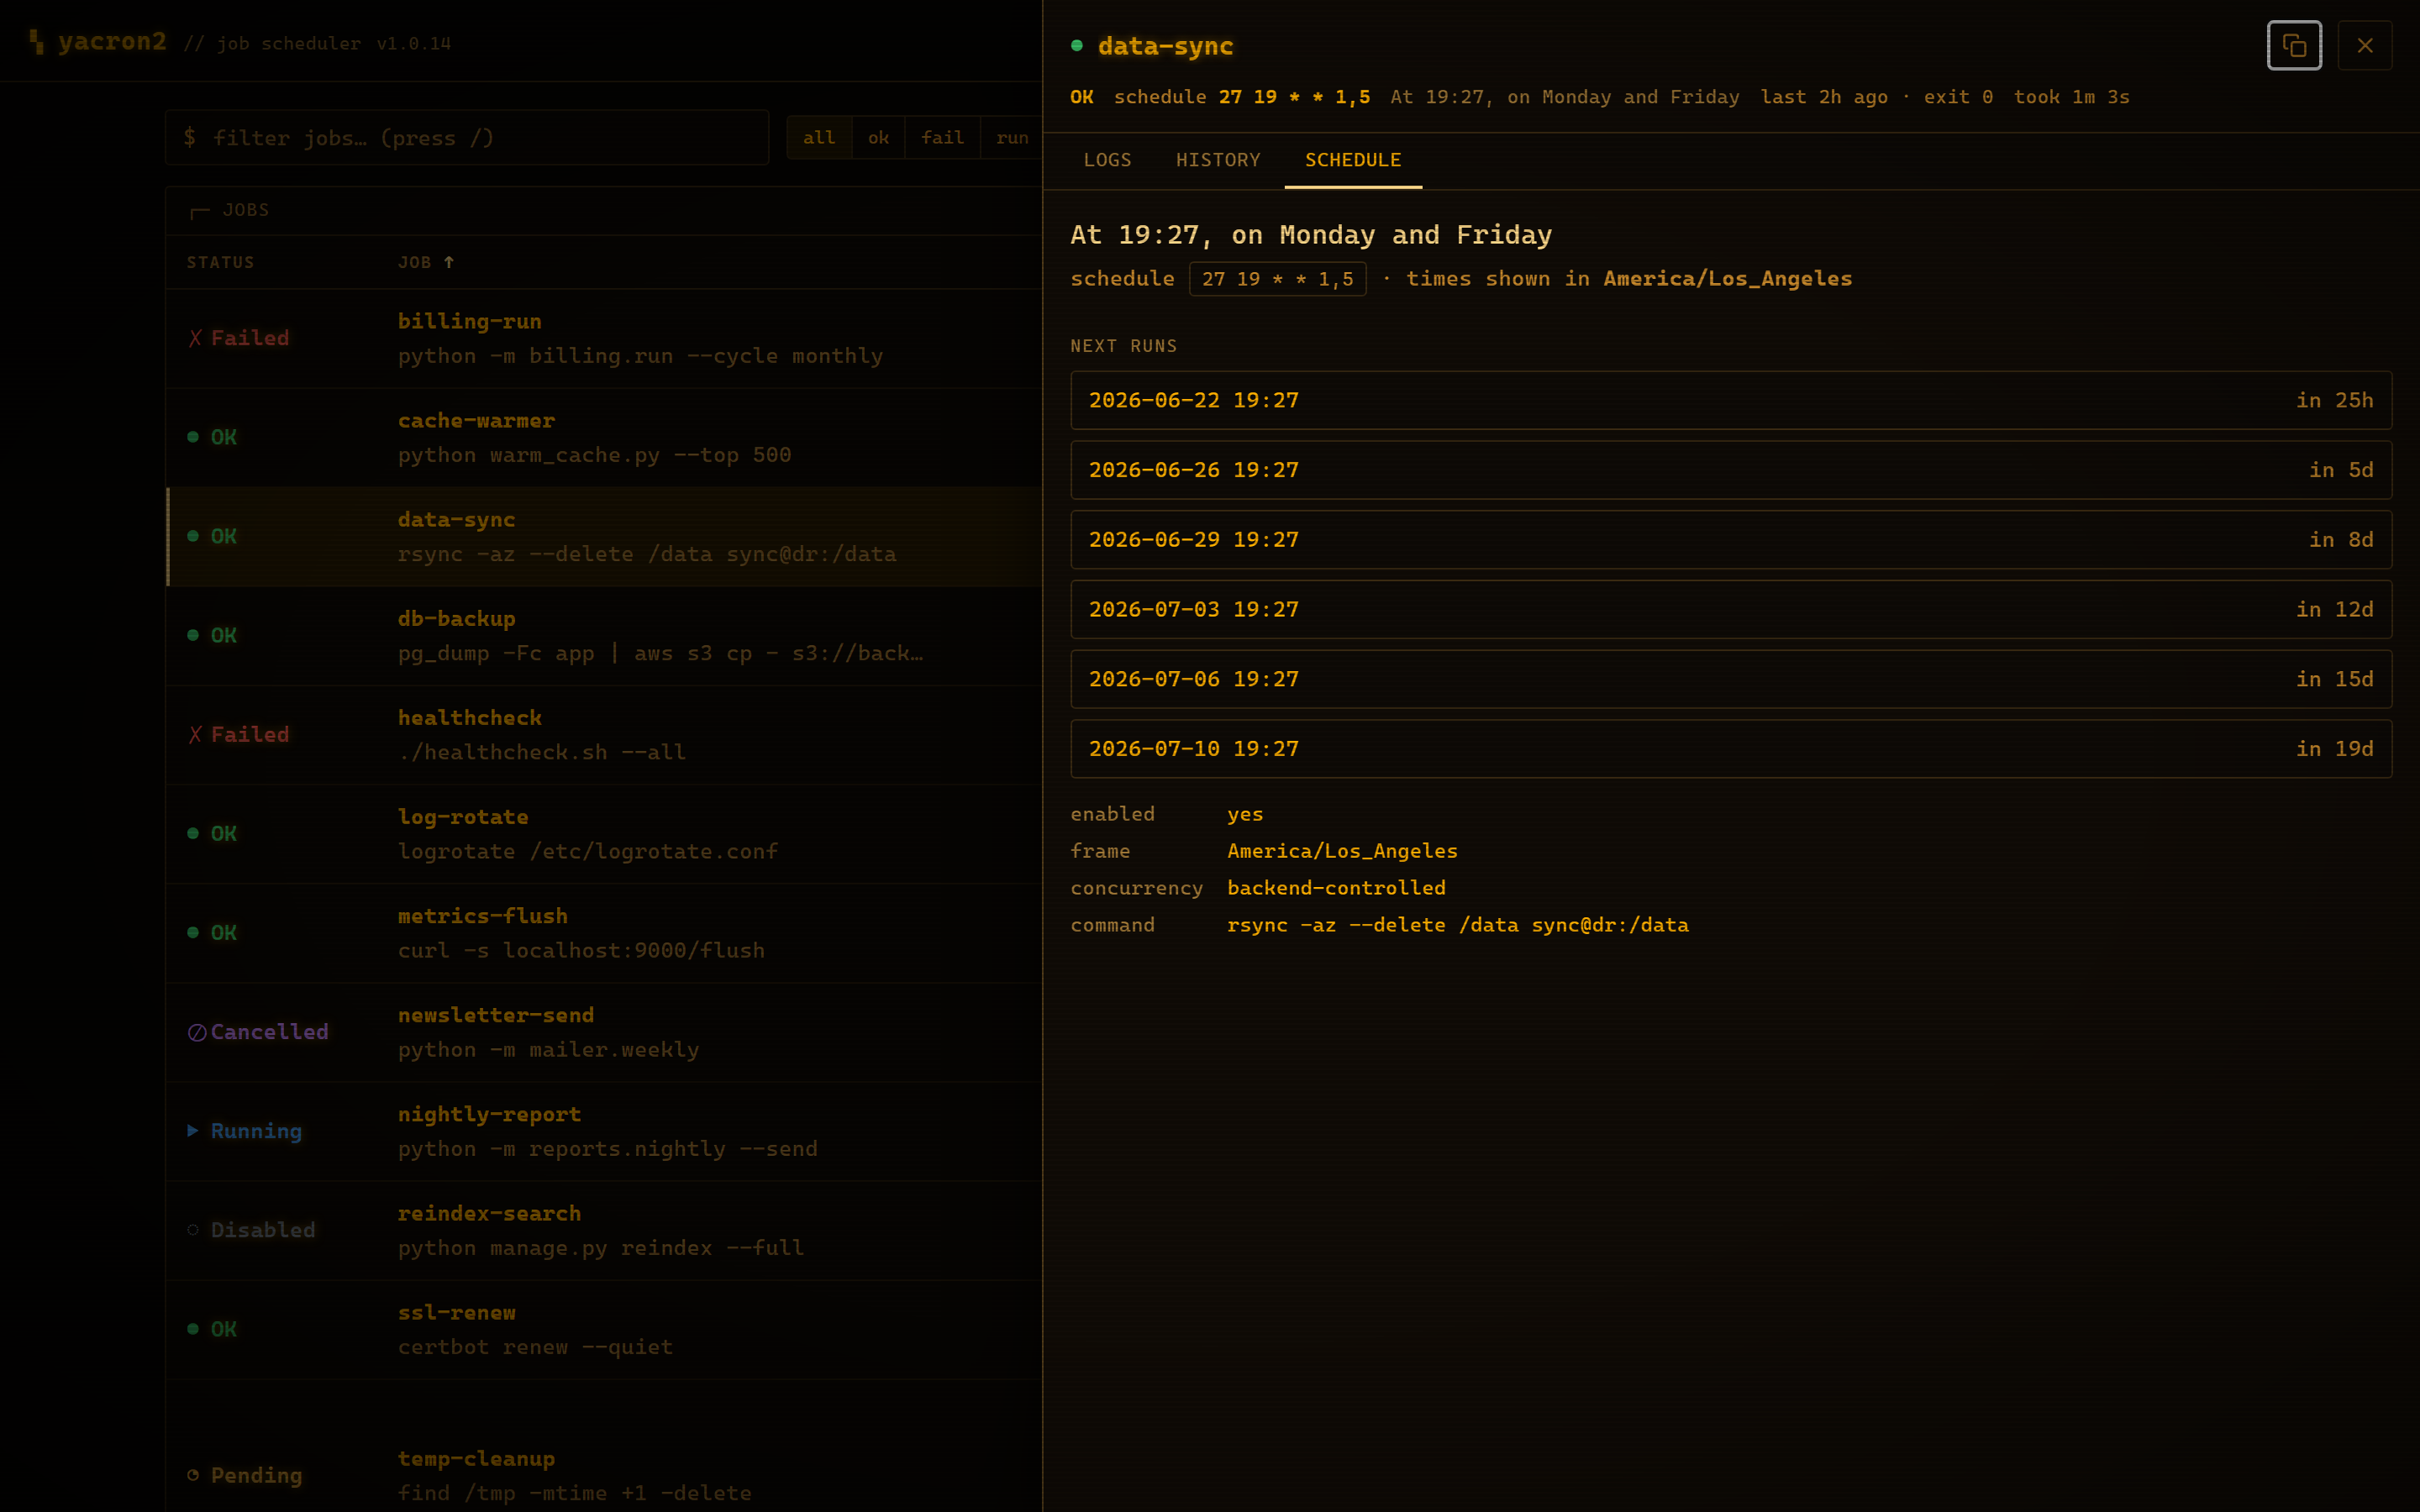
The Schedule tab turns the cron expression into something you can read at a glance:
- a plain-English description (e.g. "At 19:27, on Monday and Friday"), understanding ranges, steps, lists, names, and the
@daily/@hourly/@rebootmacros; - a preview of the next run times, computed live in the browser and shown in the job's own timezone (UTC, server-local, or an arbitrary IANA zone such as
America/Los_Angeles), each with a relative countdown; - impossible schedules (such as the 31st of February) are detected and called out rather than described as if they will fire;
- a key/value summary of whether the job is enabled, its timezone frame, a concurrency note, and its command.
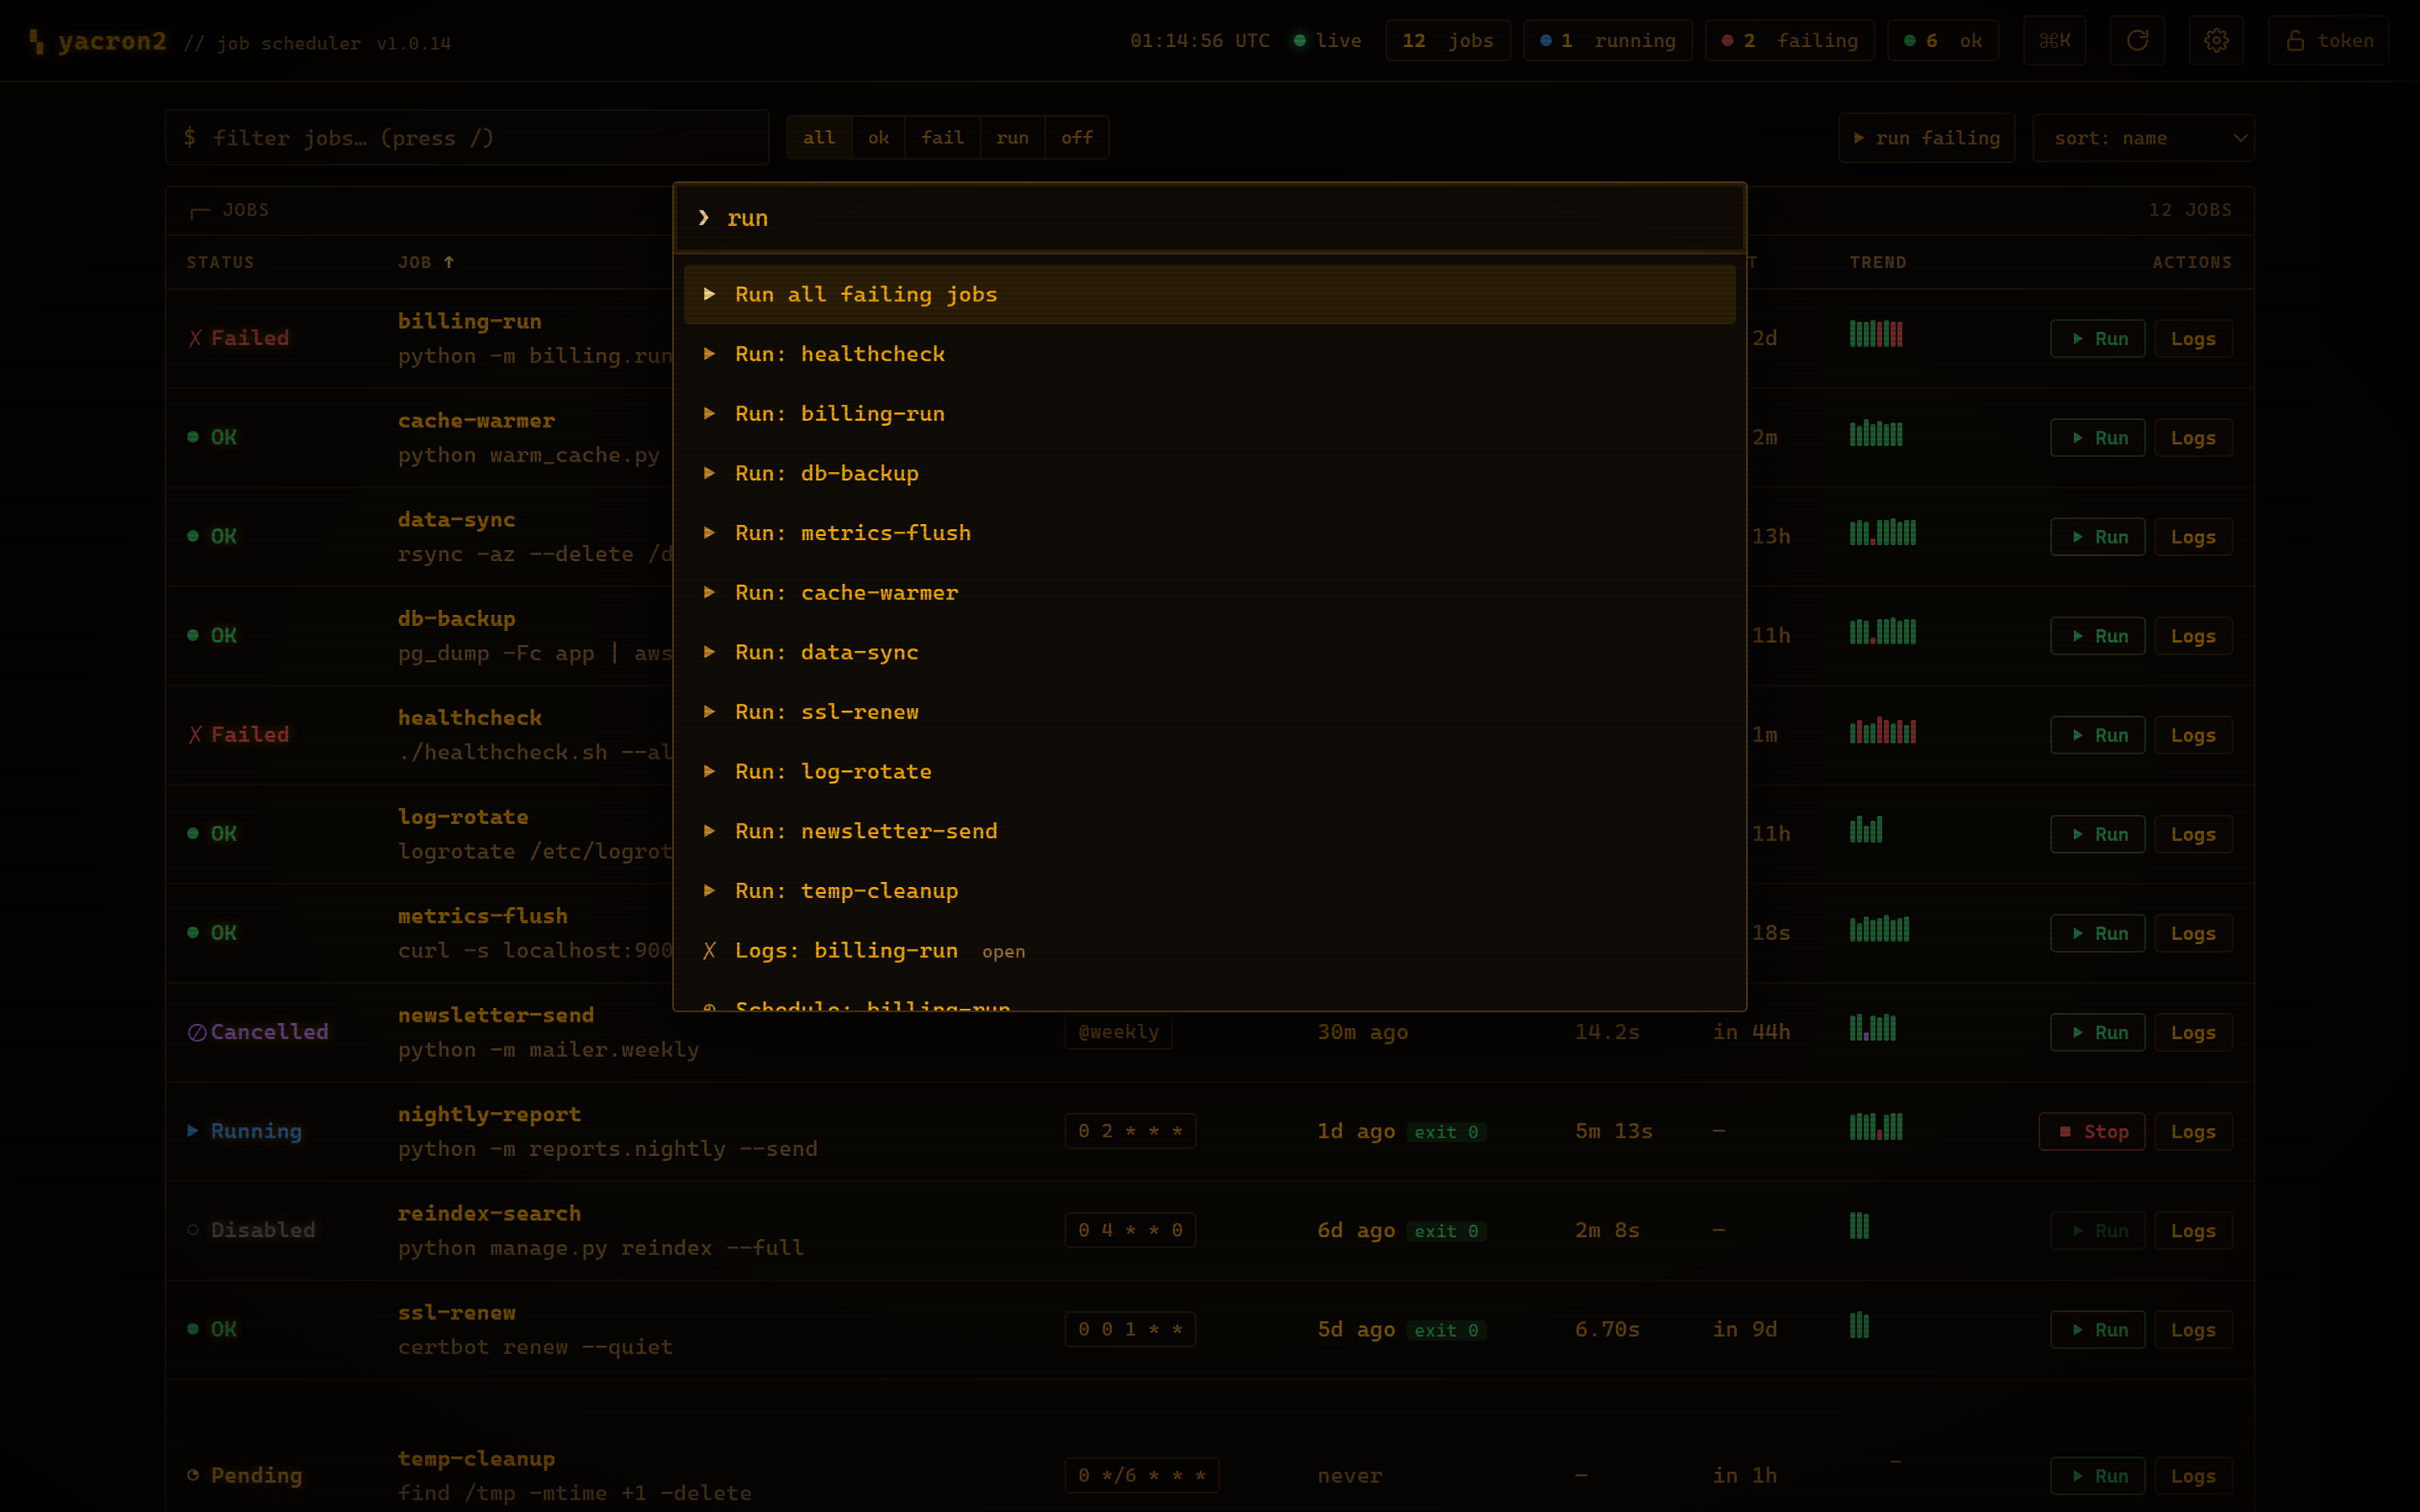
Press Ctrl-K (or ⌘K, or Ctrl-P) to open a fuzzy command palette. It
searches both global actions (refresh, run all failing jobs, cycle theme, toggle
effects, open settings, set the access token…) and a per-job action for every job
(open its logs, run it, cancel it, copy its command, view its schedule). Type to
filter, arrow keys to move, Enter to run.
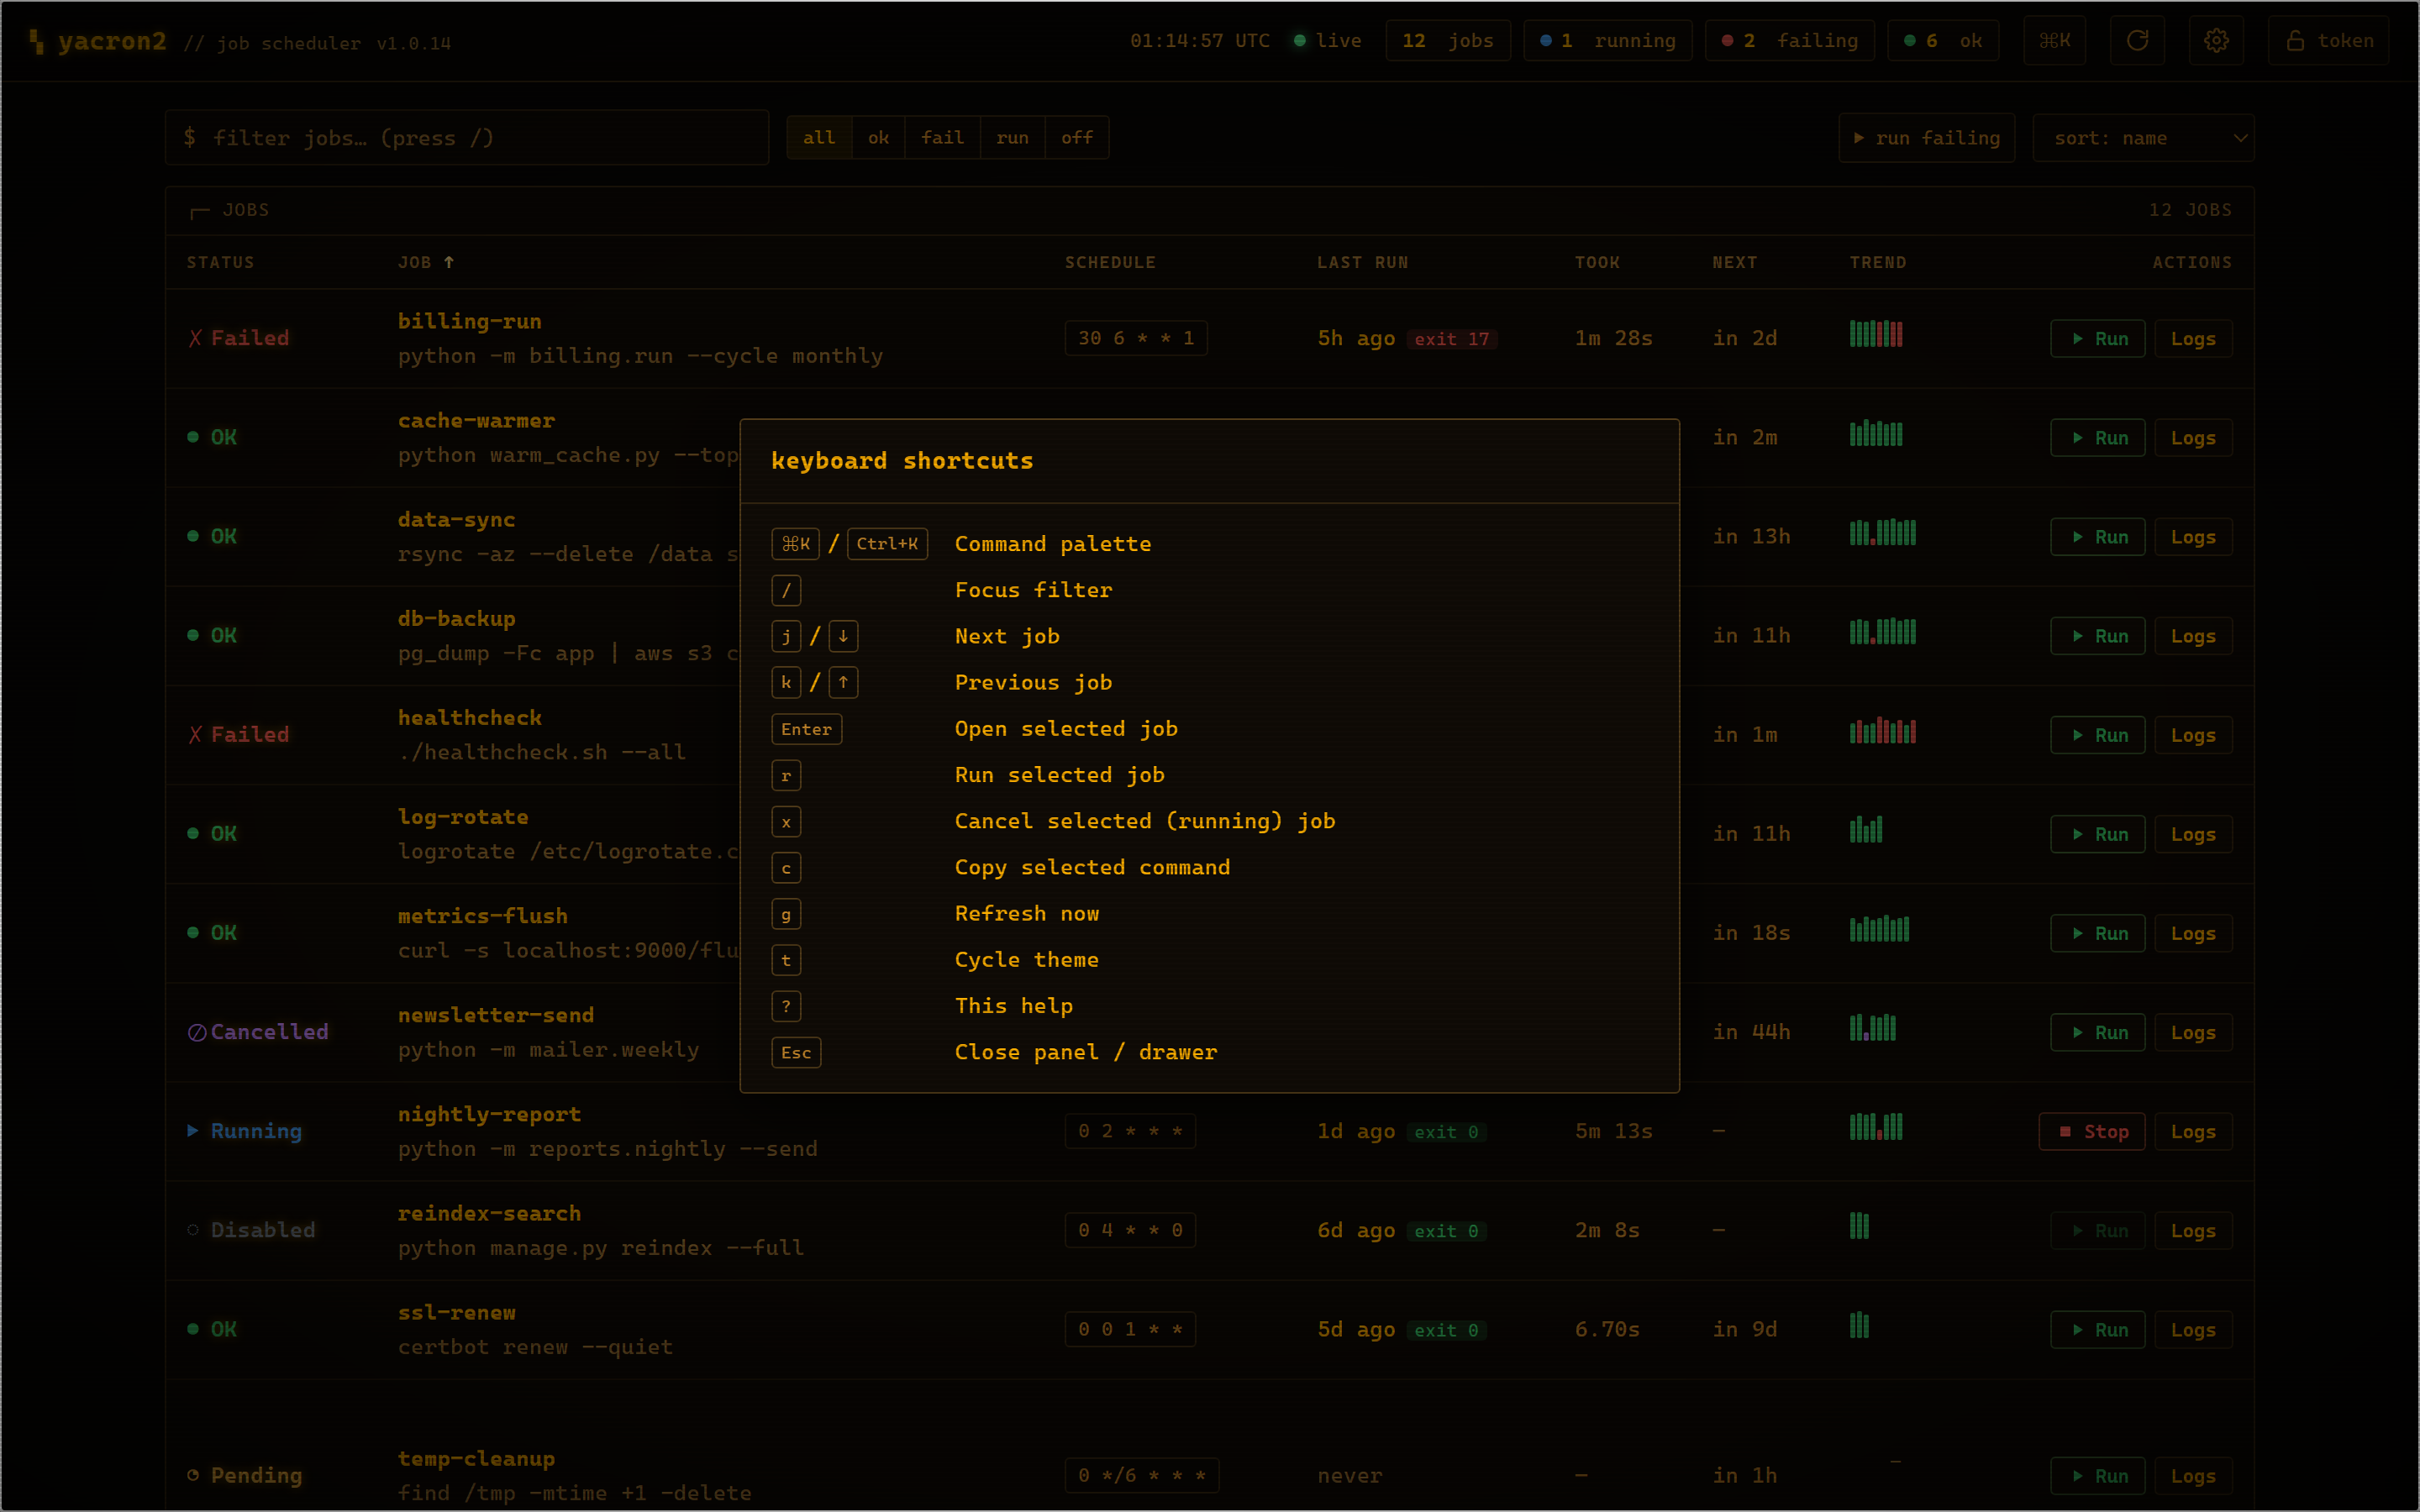
The dashboard is keyboard-first. Press ? at any time for this overlay.
| Key | Action |
|---|---|
Ctrl-K / ⌘K
|
Open the command palette |
/ |
Focus the filter box |
j / ↓
|
Select the next job |
k / ↑
|
Select the previous job |
Enter |
Open the selected job |
r |
Run the selected job |
x |
Cancel the selected (running) job |
c |
Copy the selected job's command |
g |
Refresh now |
t |
Cycle the theme |
? |
Show the shortcut list |
Esc |
Close the open panel or drawer |
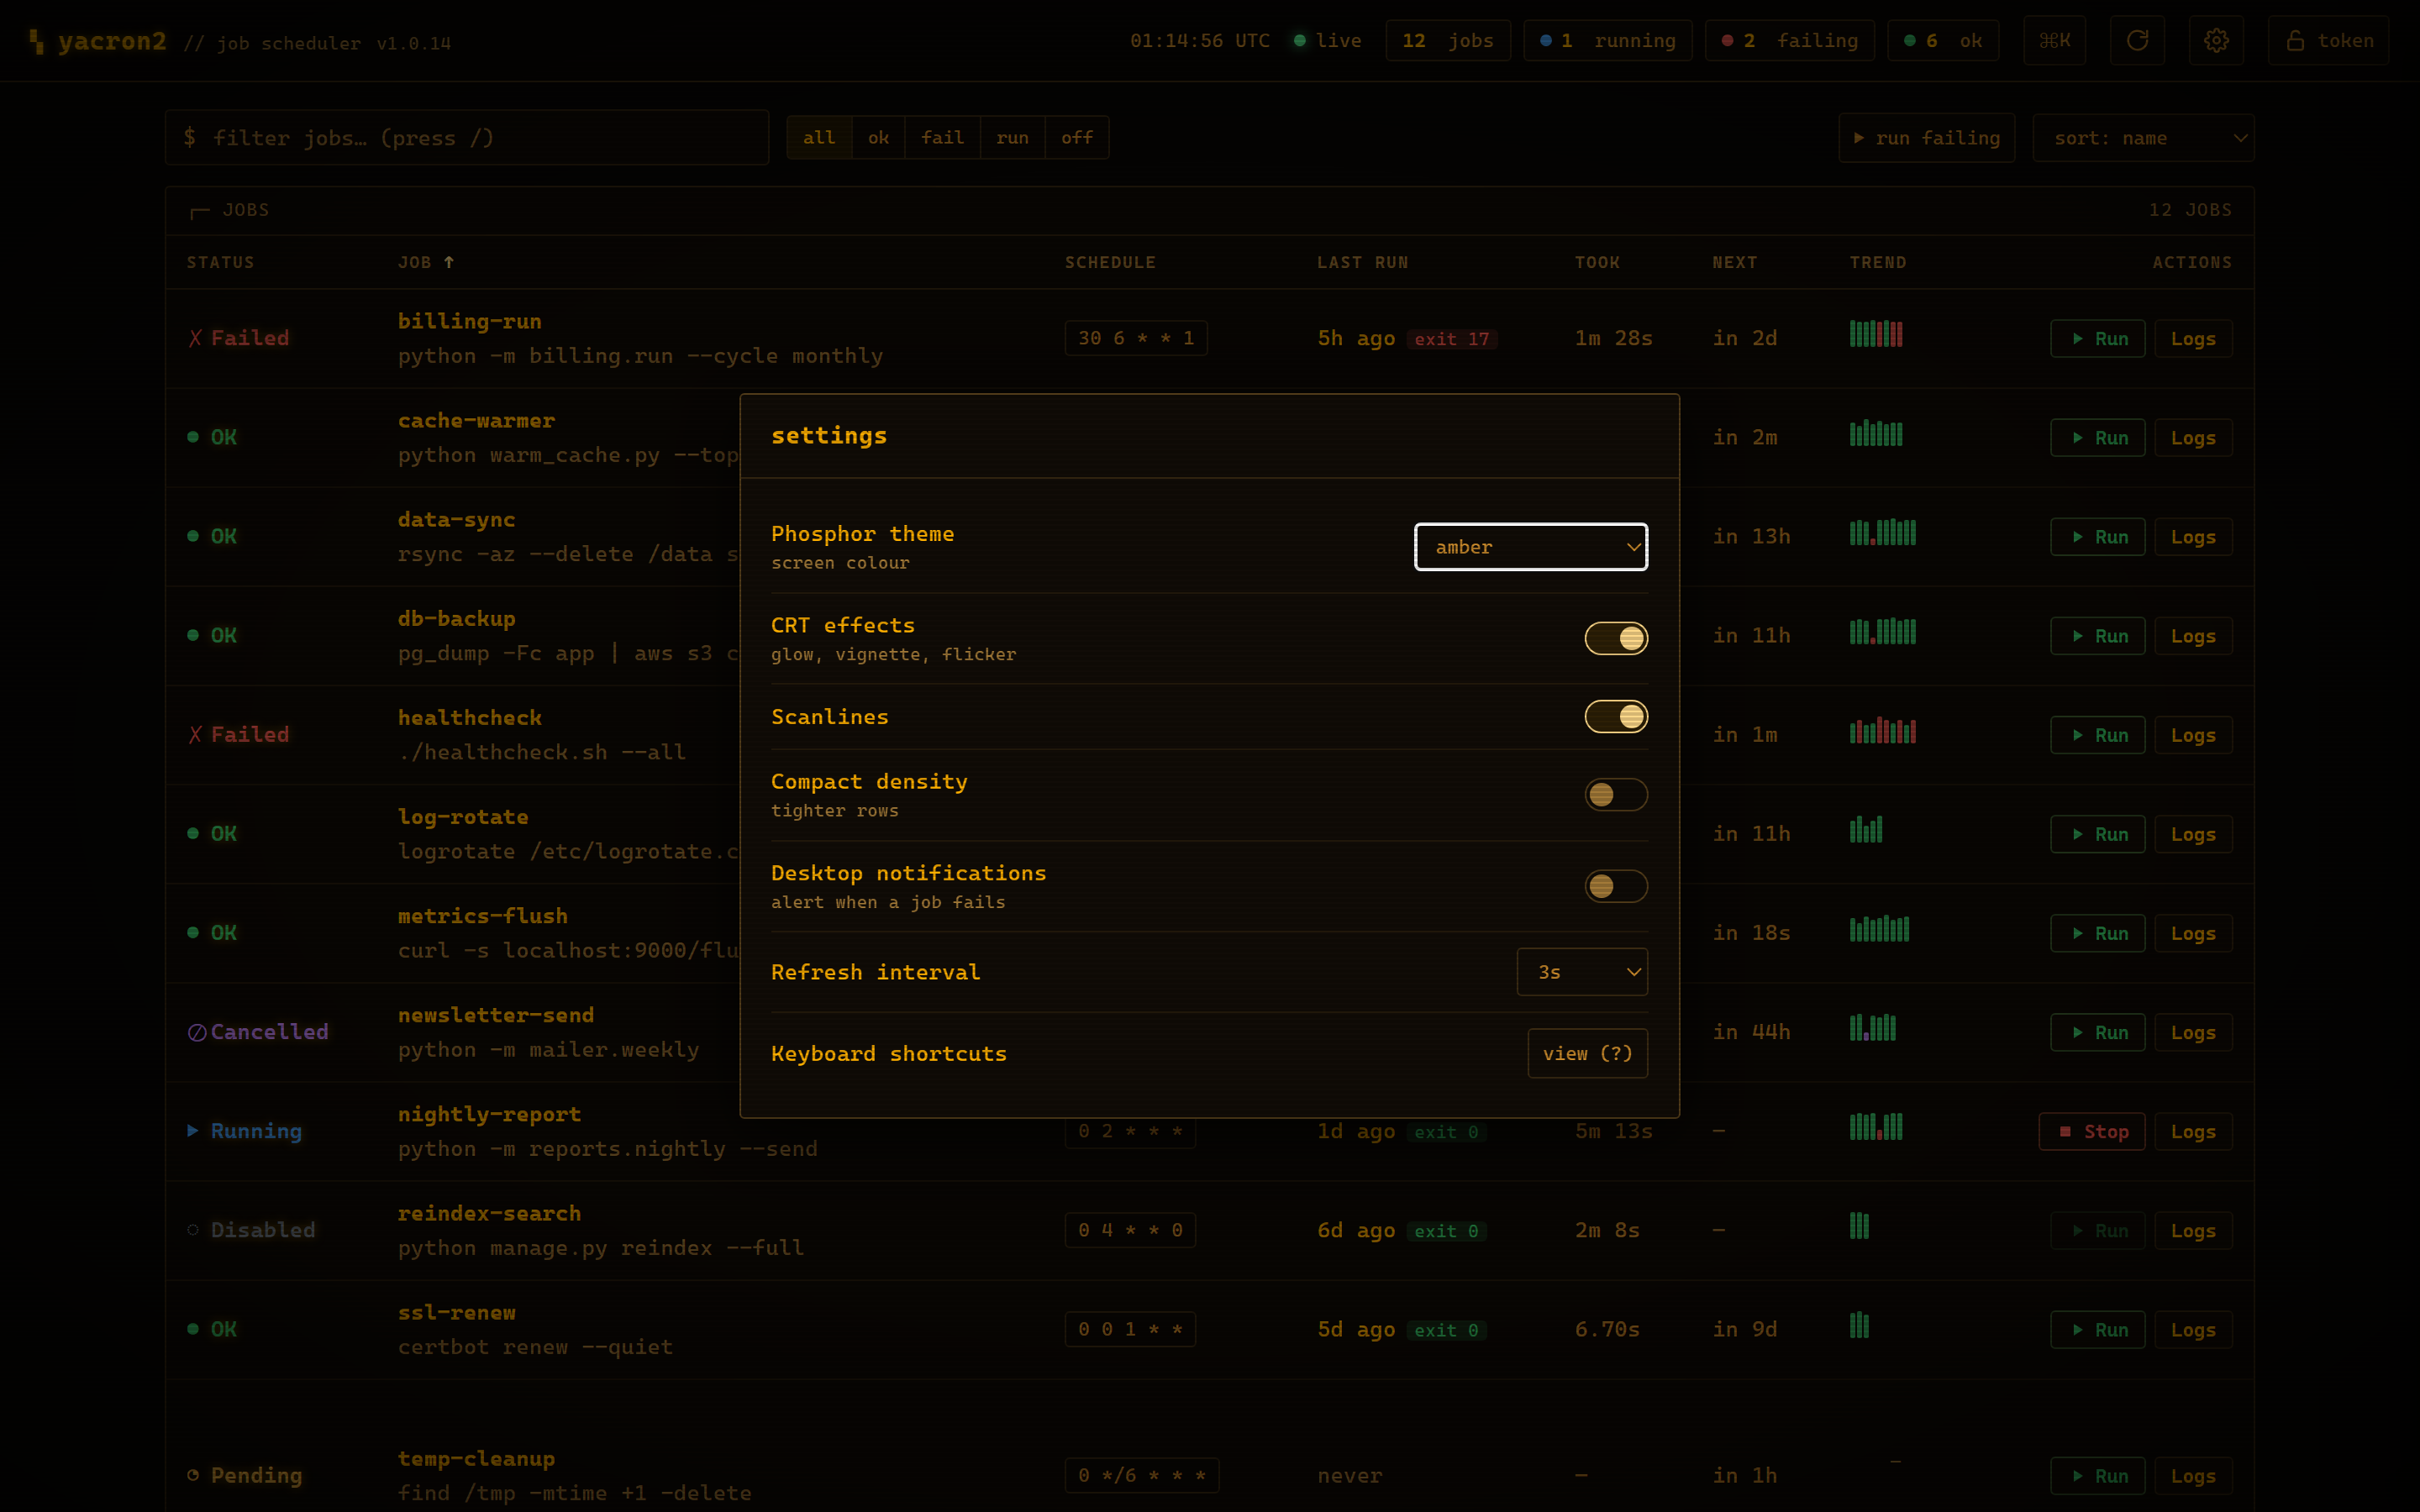
The settings panel (and the command palette) expose:
-
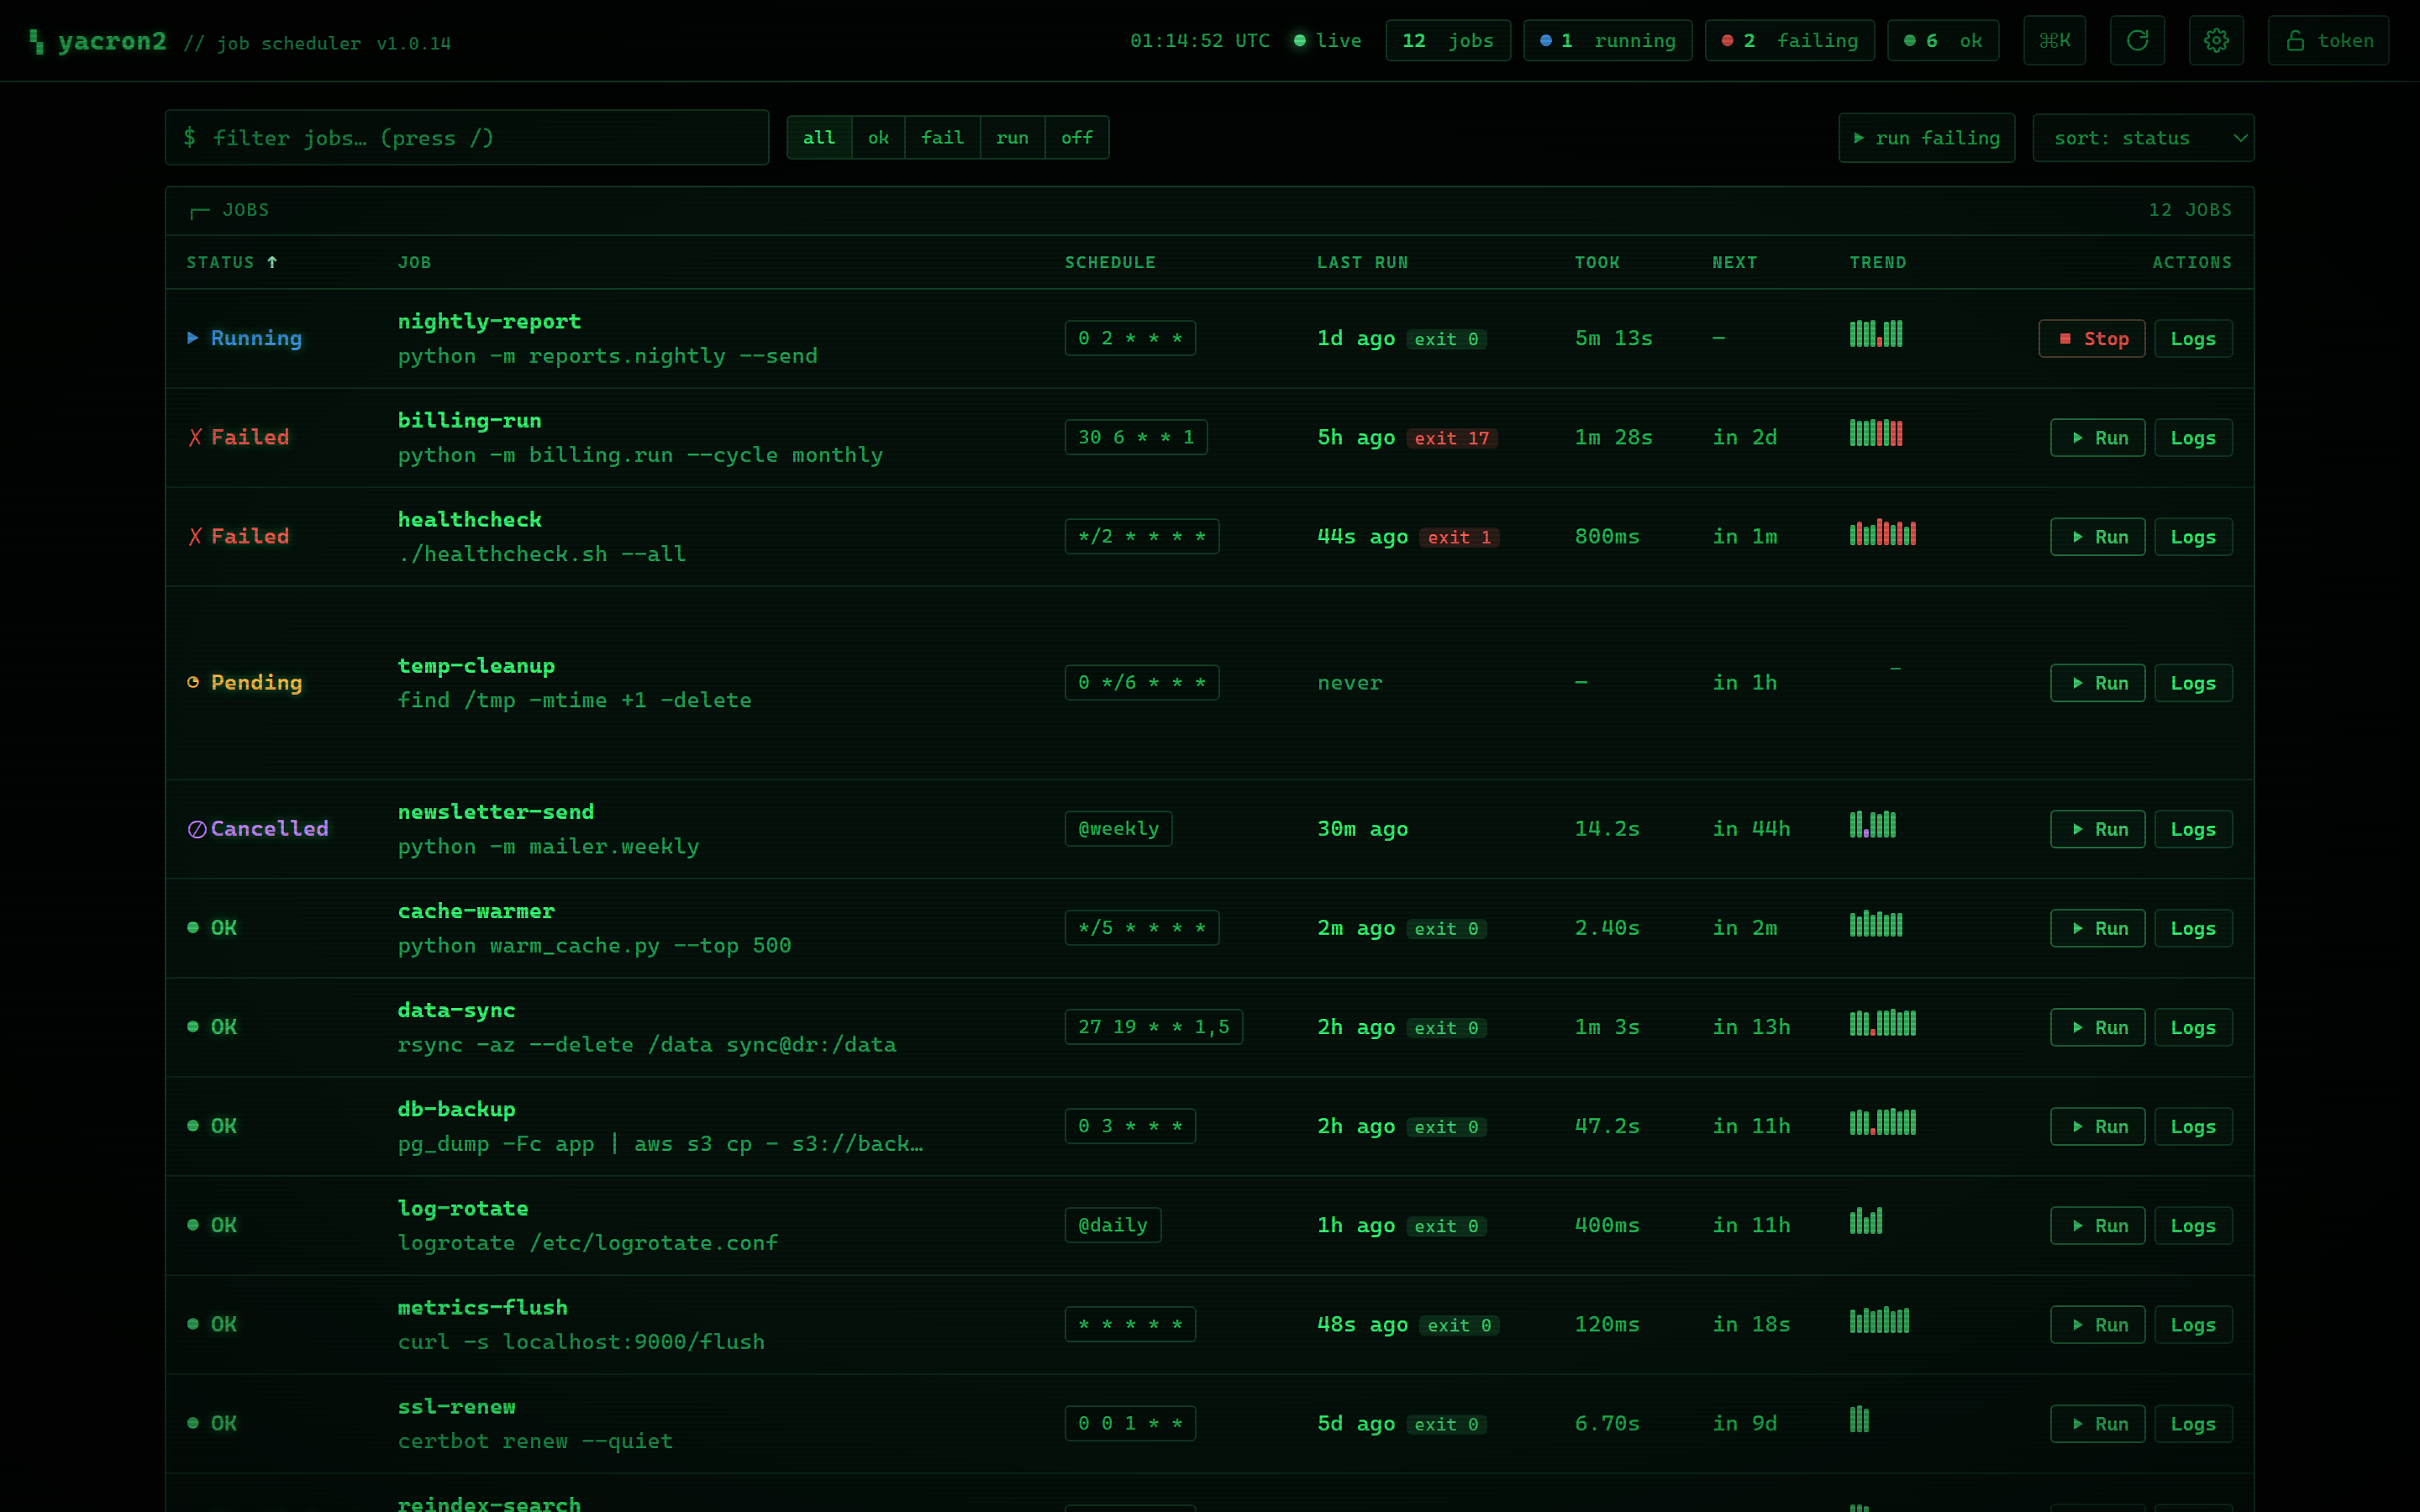
Three themes — amber and green phosphor CRT, or a flat modern theme. Cycle them with
t. -
CRT effects — phosphor glow, vignette, and a subtle flicker — and scanlines, each toggleable. They apply only to the CRT themes and automatically respect
prefers-reduced-motion. - Compact density for tighter rows.
- Desktop notifications that fire when a job fails (after you grant the browser permission).
- A refresh interval of 1s / 2s / 3s / 5s / 10s, or paused.
All preferences are remembered in the browser's localStorage, so the dashboard
comes back the way you left it.
| Green phosphor CRT | Flat modern theme |
|---|---|
 |
 |
When bearer-token authentication is enabled
(web.authToken), the dashboard page itself loads without a token — it
carries no data and no secrets. The first data request returns 401, and the
dashboard then prompts you for the token, stores it only in that browser tab
(sessionStorage), and attaches it as Authorization: Bearer … on every
subsequent request. You can update or clear the stored token from the header's
token button at any time.
The dashboard is a thin client over the HTTP Control API:
- it polls
GET /jobson the refresh interval for the overview (each job carries a compact tail of recent runs for the sparkline); - opening a job's History tab fetches
GET /jobs/{name}/runs(full retained history plus aggregate stats); - opening the Logs tab opens the
GET /jobs/{name}/logsSSE stream; - the Run / Stop buttons call
POST /jobs/{name}/startandPOST /jobs/{name}/cancel; - the version in the header comes from
GET /version.
All run history and captured output lives in memory in the running daemon (the most recent 50 runs per job) and is never written to disk, so the dashboard adds nothing to yacron2's read-only-root-filesystem deployment story and resets cleanly on restart.
- HTTP Control API — the REST endpoints, configuration schema, authentication, and Unix-socket options the dashboard is built on.
-
Output Capturing —
captureStdout/captureStderr, which control what the Logs tab can show. - Schedules and Timezones — the schedule strings and timezones the Schedule tab explains and previews.
- Production and Container Deployment — running the interface under a hardened, read-only-root-filesystem deployment.