Data analysis and Data Visualization of Countries's GDP, Life Expectancy comparison across continents, GDP per Capita Relative Growth, Population Reative Growth comparison etc using Pandas, Matplotlib.
- pandas - fast, powerful, flexible and easy to use open source data analysis and manipulation tool
- Matplotlib - a comprehensive library for creating static, animated, and interactive visualizations in Python
- NumPy - package for scientific computing with Python
- Jupyter Notebook - Notebook system for data analysis
- Country GDP per Captial Visualization - Line Chart
- Comparing Asia and Europe's GDP per Capita for 2007 Visualization - Histogram
- Comparing Europe and America's Life Expectancy in 1997 Visualization - Histogram
- GDP per Capita Growth comparison in US and China - Timeseries Line Chart
- Population Growth comparison in US and China - Timeseries Line Chart
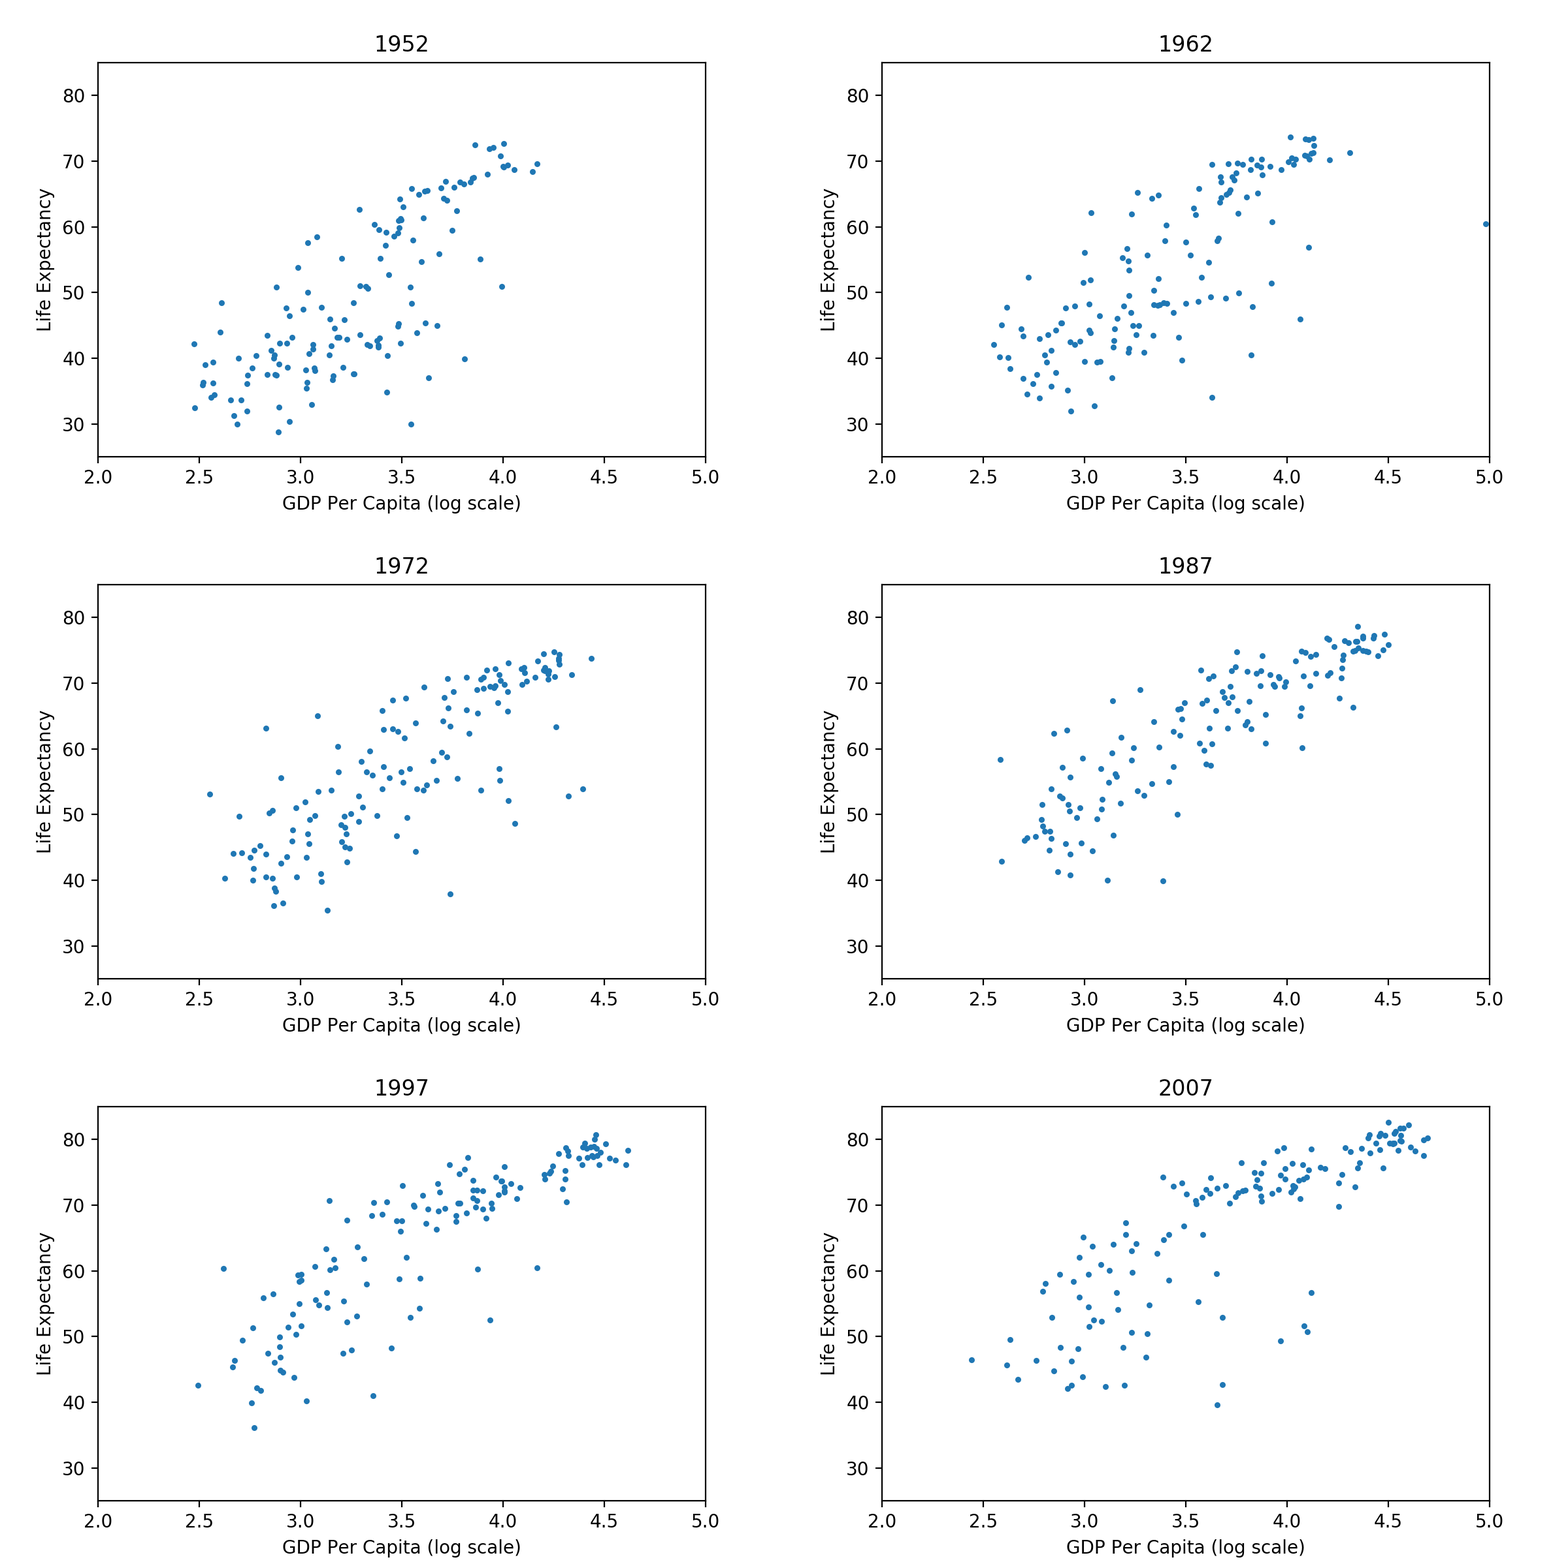
- Realtionships between GDP per Capita and Life Expectancy - Scatter Plots
- Realtionships between GDP and Life Expectancy in 2007 - Scatter Plots
- Comparison of 10 Most Populous Countries in 2007 - Bar Graphs
- Comparison of GDP for 10 Most Populous Countries in 2007 - Bar Graphs
- Data Aggregration for Obama Approval Rates
- Data Sampling for Obama Approval Rates
- Richest Country on a per-person basic
Projects are part of Data Visualization with Python by YK Sugi
This project is licensed under the MIT License - see the LICENSE.md file for details
