Widgets
The most common front facing resource on Ocean Watch are widgets. Widgets are built off of Ocean Watch datasets.
A widget is a visual specification of how to style and render the data of a dataset (think of a map, or a pie, bar or line chart). Each widget is associated with a single dataset on the Resource Watch API. You can represent the same data in different ways by creating different widgets for the same dataset. Widgets are well documented in the RW API documentation.
There are three types of widgets on Ocean Watch
- Map widgets (standard)
- Chart widgets (standard)
- Indicator widgets (custom)
A catalog of standard widgets (charts and maps) and a catalog of indicators can be found ins the Ocean Watch Data directory in SharePoint (see Sustainable Ocean Initiative\Documents\Ocean Watch\Development\Data\)
It is often useful to view a widget in the Resource Watch front end to check its display. Standard widgets can be viewed using
https://resourcewatch.org/data/widget/<widget_id>
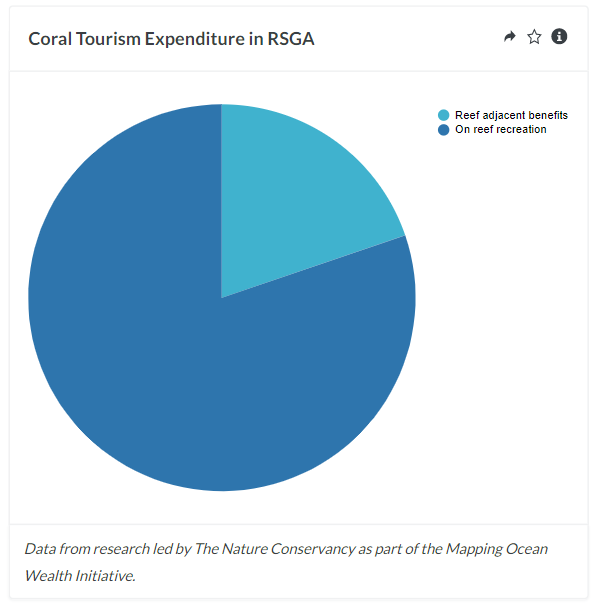
Example: Coral Tourism Expenditure in RSGA
Parametrized widgets can be viewed at
https://resourcewatch.org/data/widget/<widget_id>?geostore_env=geostore_prod&geostore_id=<geostore_id>
It is also useful to view the raw JSON specification that is stored in the API. There are separate API endpoints for the widget and its metadata. Widgets can be viewed at
https://api.resourcewatch.org/v1/widget/<id>
Example: Coral Tourism Expenditure in RSGA_
Metadata can be viewed at
https://api.resourcewatch.org/v1/dataset/<id>/widget/<id>/metadata
Example: Coral Tourism Expenditure in RSGA
Widgets have 5 key attributes. These can be viewed from the API.
-
Widget configuration
ThewidgetConfigproperty of thewidget[attributes]property corresponds to the widget configuration. The configuration controls the rendering of the widget. It is a JSON object and its organization is free form. For more information on how to create thewidgetConfigfor different widget types, navigate to their respective pages in the wiki using the sidebar.
{
  "id": "feddec38-7b28-4be6-881a-0c4761598ed8",
  "type": "widget",
  "attributes": {
    "widgetConfig": {...}
  }
}-
Title
Thenameproperty of thewidget[attributes]property corresponds to the title of above the rendered display. On Ocean Watch, many titles are parameterized with country or territory names using{{geostore_country_name}}as a placeholder.
{
  "id": "feddec38-7b28-4be6-881a-0c4761598ed8",
  "type": "widget",
  "attributes": {
    "name": "Desertification in {{geostore_country_name}}, 2015-2019",
  }
}-
Description
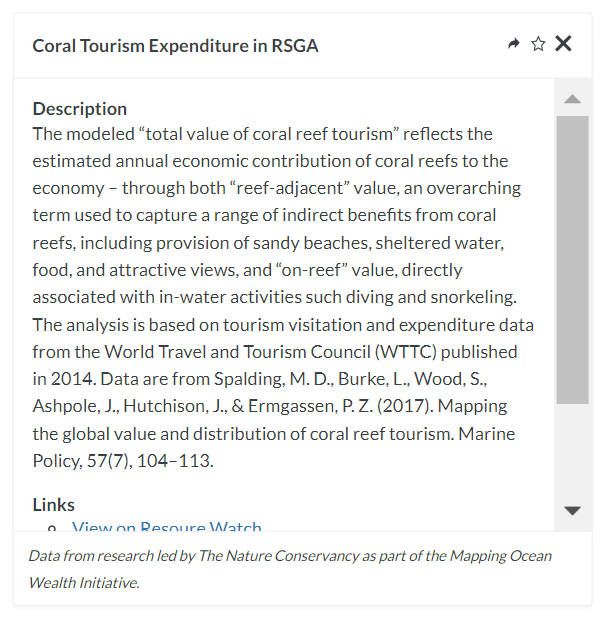
Thedescriptionproperty of thewidget[attributes]corresponds to the "Description" section on the backside of the widget (click the "i"). On Ocean Watch this descriptive text describes
{
  "id": "feddec38-7b28-4be6-881a-0c4761598ed8",
  "type": "widget",
  "attributes": {
    "description": "The desertification of soils makes them more vulnerable to erosion by wind or rainfall. Widespread desertification increases the amount of sediment that enters water bodies and the coastal zone where it can smother ecosystems and limit photosynthesis at the sea-floor. The loss of ecosystems such as shrubland and grassland, forests, wetlands, and croplands increases desertification risks due to the loss of root networks and decline in soil biodiversity. This chart highlights the major biome conversions that are contributing to the country's total desertified areas."
  }
}-
Caption
Thecaptionproperty of themetadata[attributes][info]property corresponds to the italicized text below the rendered display. On Ocean Watch, widgets usually do not have captions so this property is blank.
[
  {
    "id": "618e94096cd78b001acc1b7e",
    "type": "metadata",
    "attributes": {
      "info": {
        "caption": "Data from research led by The Nature Conservancy as part of the Mapping Ocean Wealth Initiative."
      }
  }
]-
Links
Thelinksproperty of themetadata[attributes][info]property corresponds to the hyperlinks on the backside of the widget (click the "i"). These links direct users to the source(s), the underlying dataset(s), and any processing documentation.
[
  {
    "id": "618e94096cd78b001acc1b7e",
    "type": "metadata",
    "attributes": {
      "info": {
        "widgetLinks": [
          {
            "link": "https://resourcewatch.org/data/explore/ocn013-Coral-Reef-Tourism-Value",
            "name": "View on Resource Watch"
          },
          {
            "link": "https://www.sciencedirect.com/science/article/pii/S0308597X17300635",
            "name": "\"Mapping the global value and distribution of coral reef tourism\" in Marine Policy"
          },
          {
            "link": "http://maps.oceanwealth.org/",
            "name": "Mapping Ocean Wealth Explorer"
          },
          {
            "link": "https://wttc.org/",
            "name": "World Travel and Tourism Council"
          }
        ]
      }
    }
  }
]How you create a widget will depend on the type of widget you are creating. It can be easier to create simple chart and map widgets in the back office. For embed maps with multiple layers, slide maps, and advanced chart widgets, it is more reliable to use the API.
The Ocean/Resource Watch data team use the advanced-widget-writer to create and edit widgets and their metadata using the API. Refer to the creating a widget section of the RW API documentation for information on the POST request. Reference information about each of the supported body fields is also available in the API documentation. To create a new widget, use the advanced_chart_widget_create script. Fill in the fields, including the widgetConfig, the title, and the description.
Titles appear at the top of the widget and the description appears on the back (when a user clicks the i button). Titles and description are written by the Ocean Watch Data team and reviewed by the WRI Communications team. Titles of widgets on Ocean Watch can be parameterized by adding the placeholder {{geostore_country_name}}. For example,
name = 'Contribution of blue food to protein supply in {{geostore_country_name}}'After you run the script, it will return the id of the newly created widget.
After you have created the widget, you can use the advanced_chart_widget_metadata_create script to create metadata for the widget. Metadata fields inlcude links and a caption.
The content of the links property depends on the type of underlying datasets. Always include a link to the source(s) website(s). Include a link to the Resource Watch explore page for any published datasets. Include a link to the dataset folder in github is the dataset is unpublished. If the widget is a chart widget, include a link to the widget folder in github. Use the below as an example.
"widgetLinks": [
        {"link":"https://land.copernicus.eu/global/products/lc","name":"Copernicus Land Cover"},
        {"link":"https://resourcewatch.org/data/explore/Global-Land-Cover-UN-FAO-LCCS-Classification","name":"Explore the underlying Land Cover data on Resource Watch",
        {"link":"https://github.com/resource-watch/ocean-watch-data/tree/main/datasets/ocn_calcs_016_land_cover_change","name":"Learn more about the dataset"},
        {"link":"https://github.com/resource-watch/ocean-watch-data/tree/main/widgets/soc_104_w3_urbanization","name":"How the data team created this widget"}
]To edit an existing widget or its metadata, the Ocean Watch data team uses the advanced_chart_widget_edit script and the advanced_chart_widget_metadata_edit script respectively. If making minor changes, it can be helpful to first make an API call to the widget endpoint, copy the properties you wish to edit, and edit them in a text editor before copying them into the script.