Repository navigation
State gallery
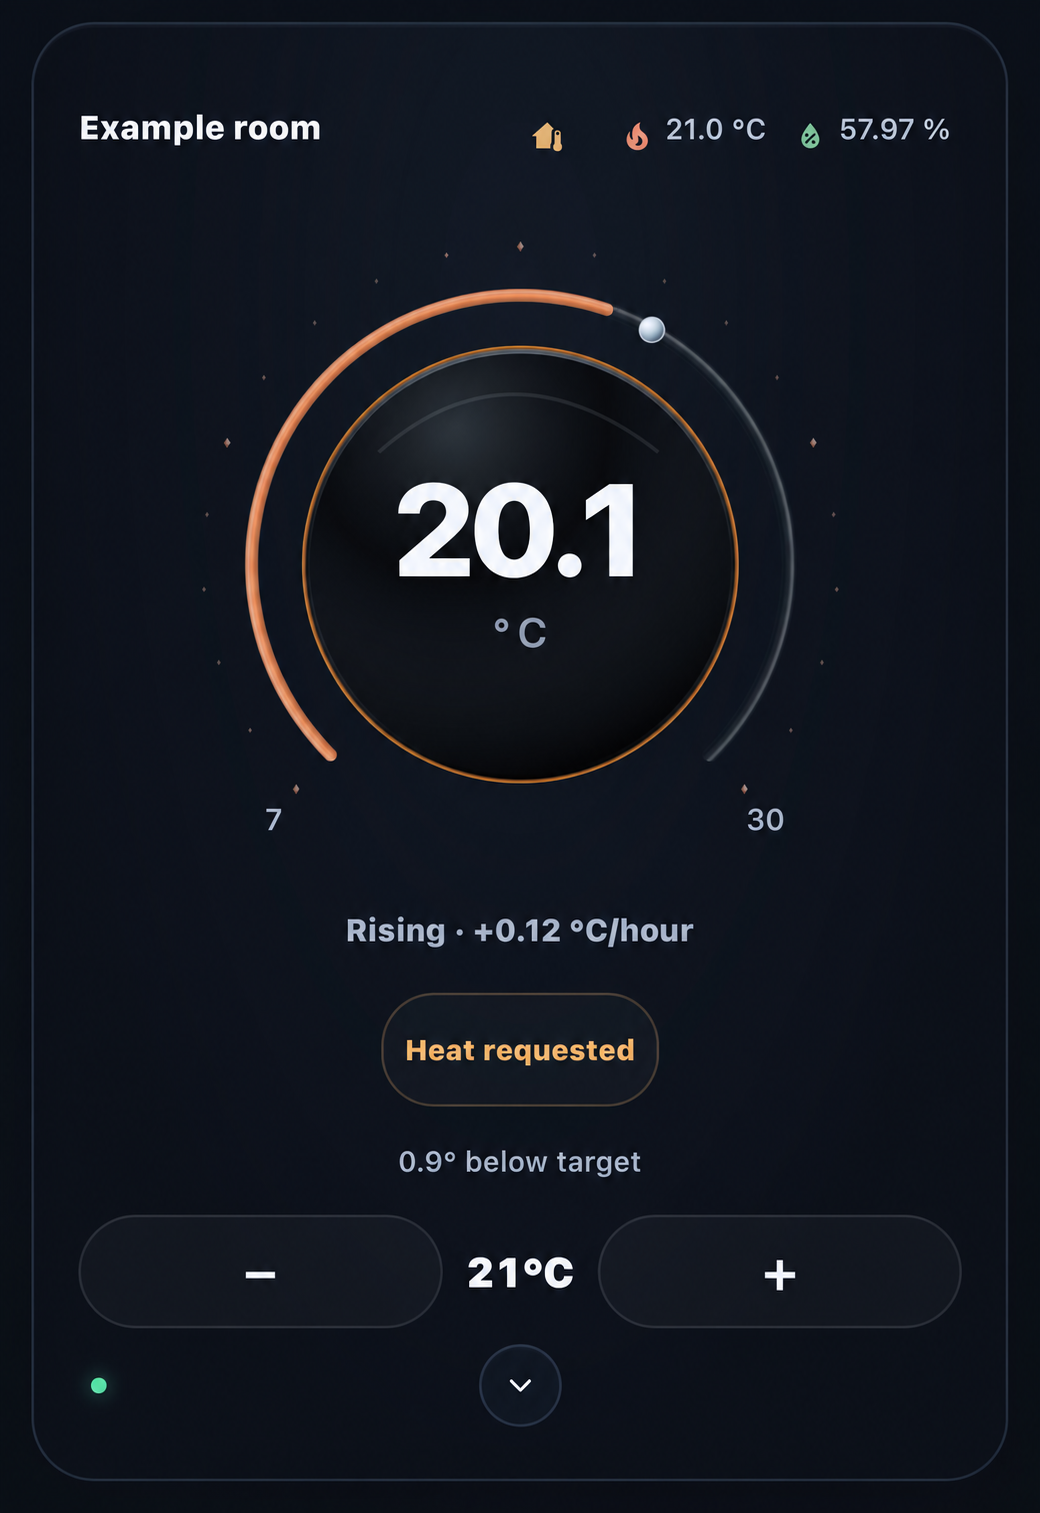
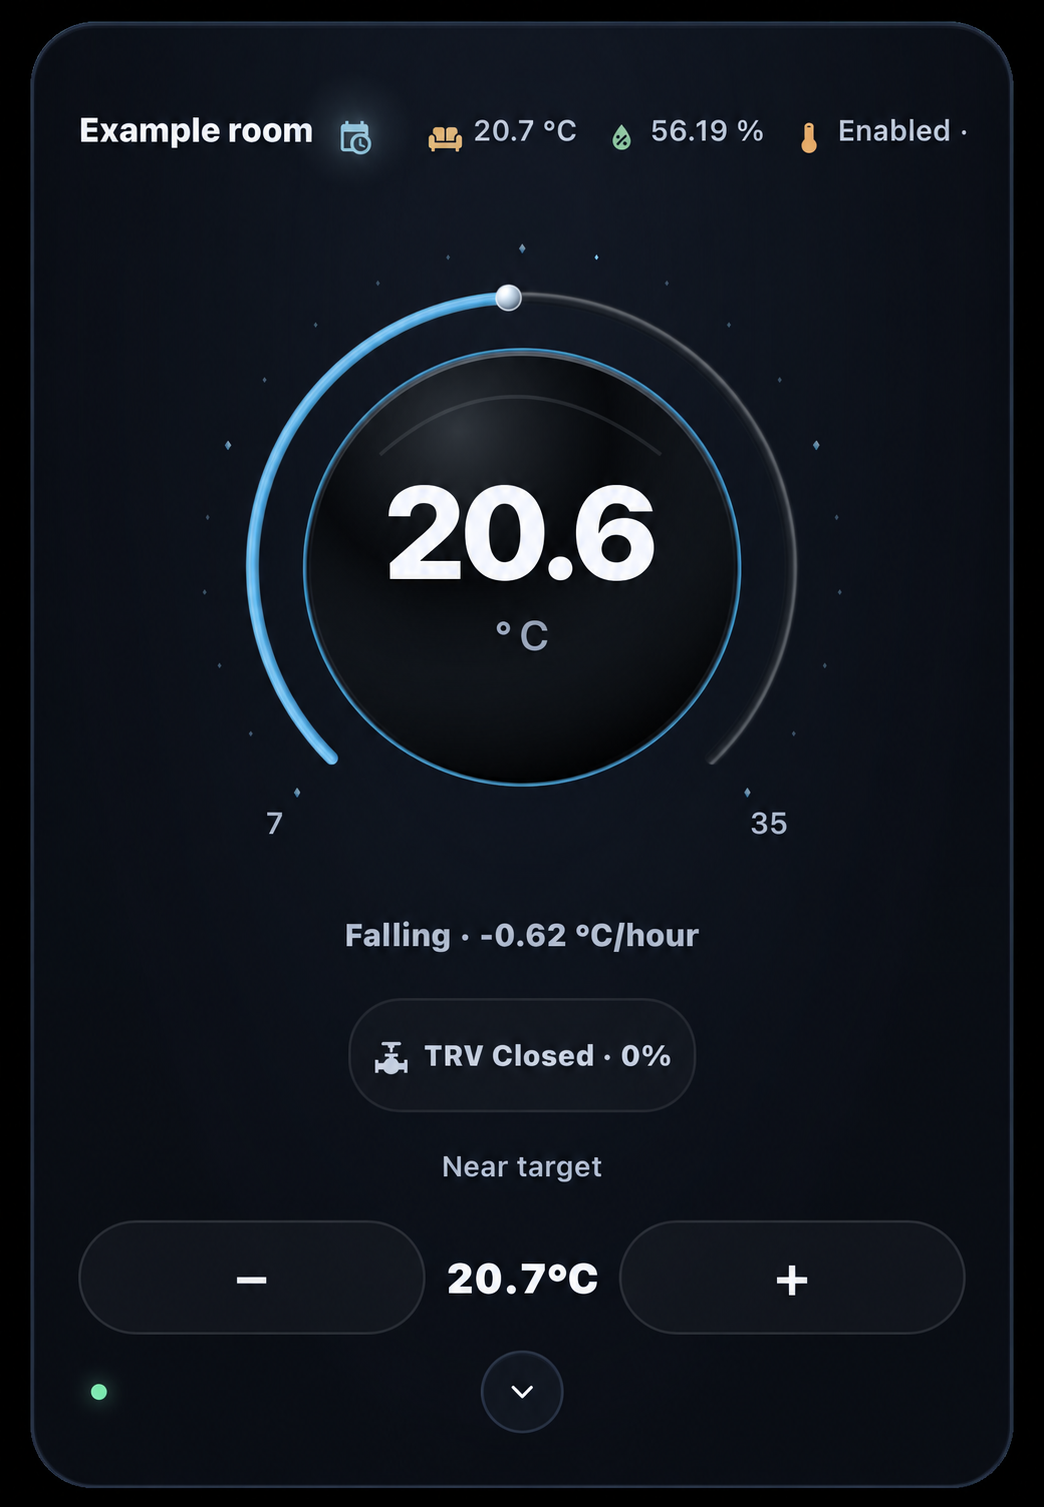
These examples show how one card presents different combinations of temperature, trend and thermostat observations. The outer arc, fine slope ring and status chip carry separate information; they do not need to share one colour.
About these images: These anonymised installation examples have unrecorded source builds. Some schedule, ownership and cutoff indicators belong to the wider TI system and are outside the standalone release candidate. See Image notes for editing context and the RC guide for the current package.
| Heat requested | TRV open |
|---|---|
 |
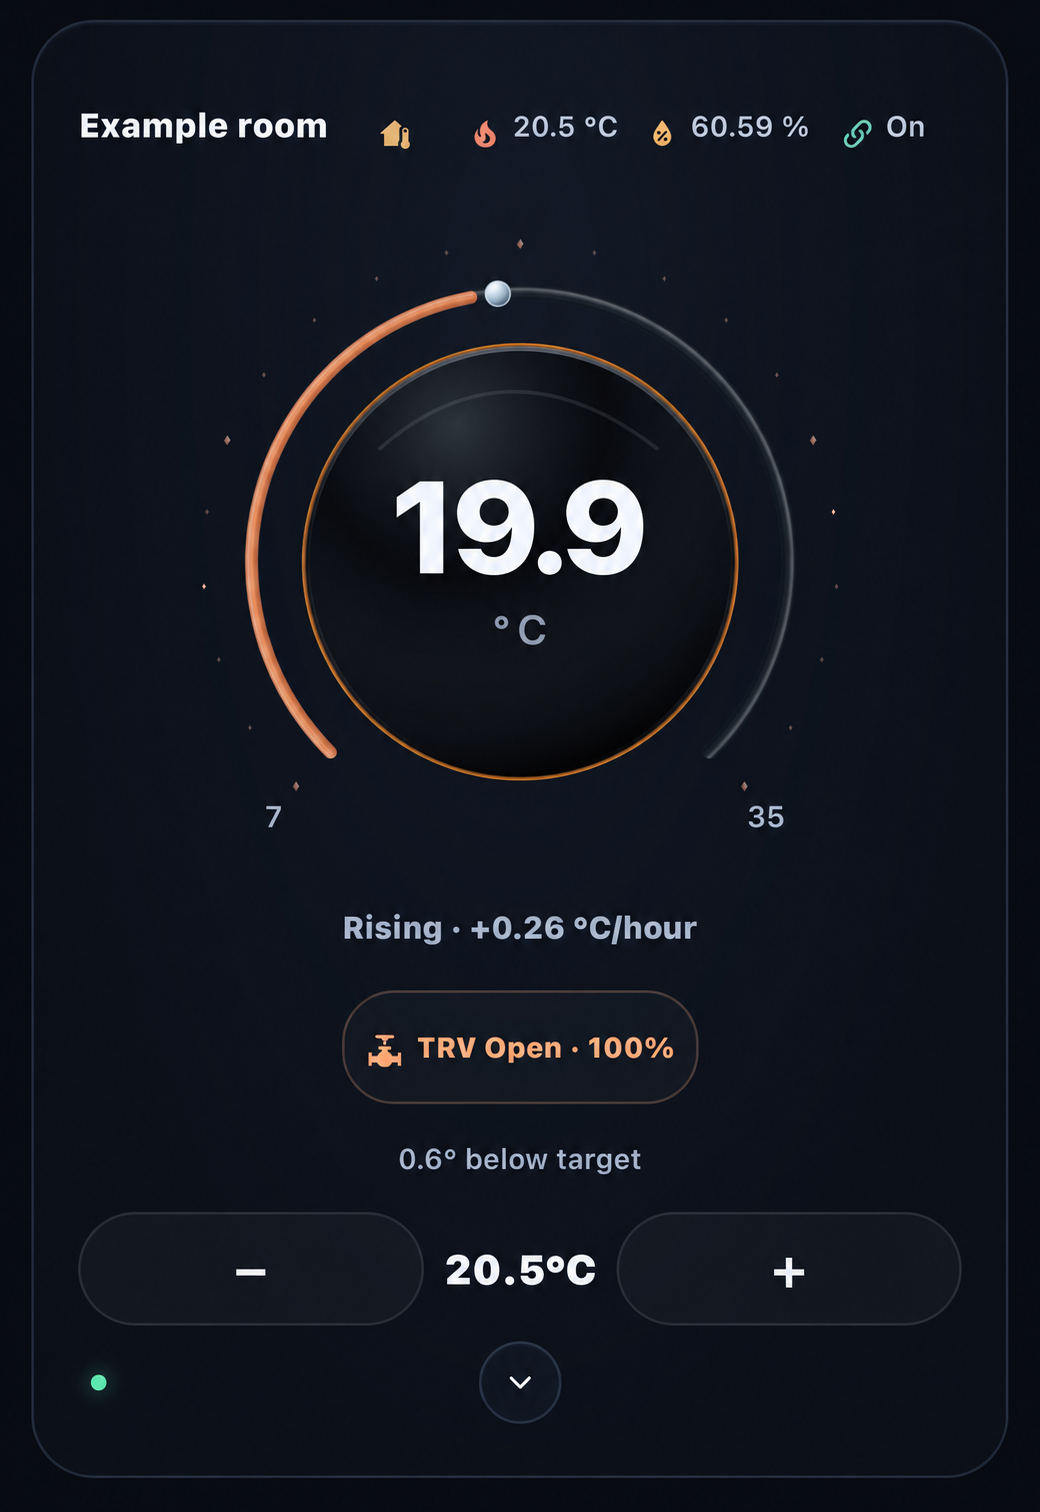 |
Both captures show an orange arc and a rising trend. The chips report different facts: a thermostat heat request on the left, and a reported thermostatic radiator valve (TRV) opening on the right. Neither screenshot alone proves accepted output or physical heat transfer. In RC.1, orange requires the configured response evidence.
| Closed and falling | Closed and rising |
|---|---|
 |
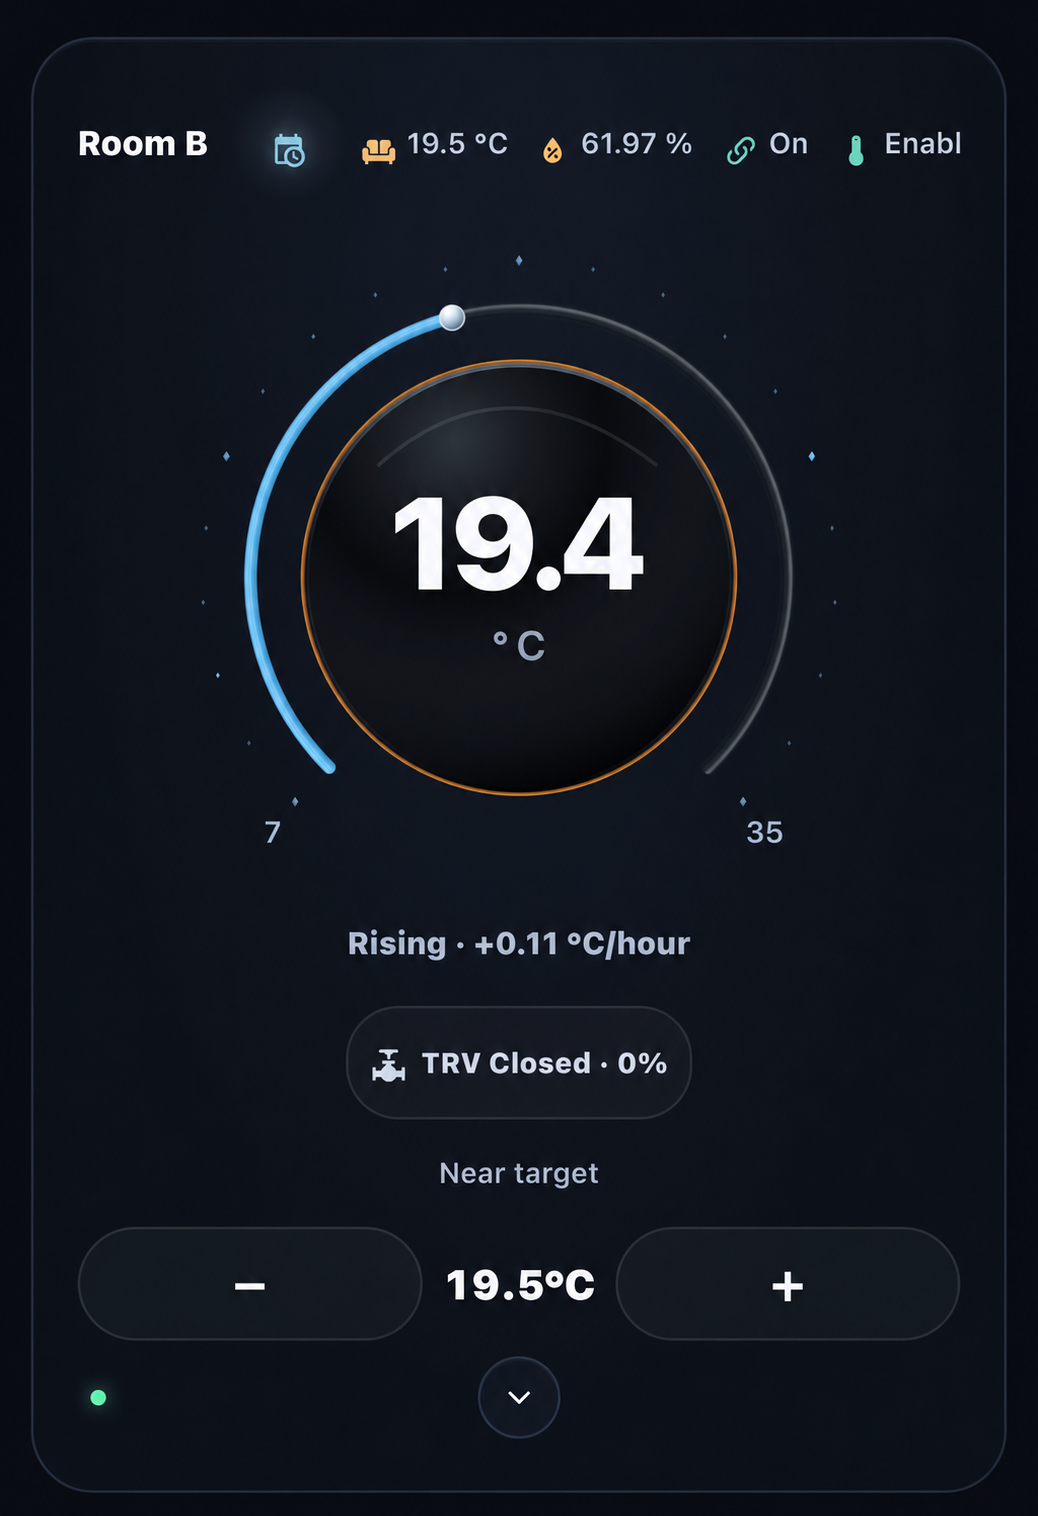 |
The right-hand card is a useful distinction: the valve reports closed while the room temperature is still rising. Its warm slope ring preserves that observation, while the blue outer arc does not assert an established warming response. Falling temperature on the left is a measured trend; it does not mean an HVAC cooling mode is active.
Above target, with rising or falling readings
| Above target and rising | Above target and falling |
|---|---|
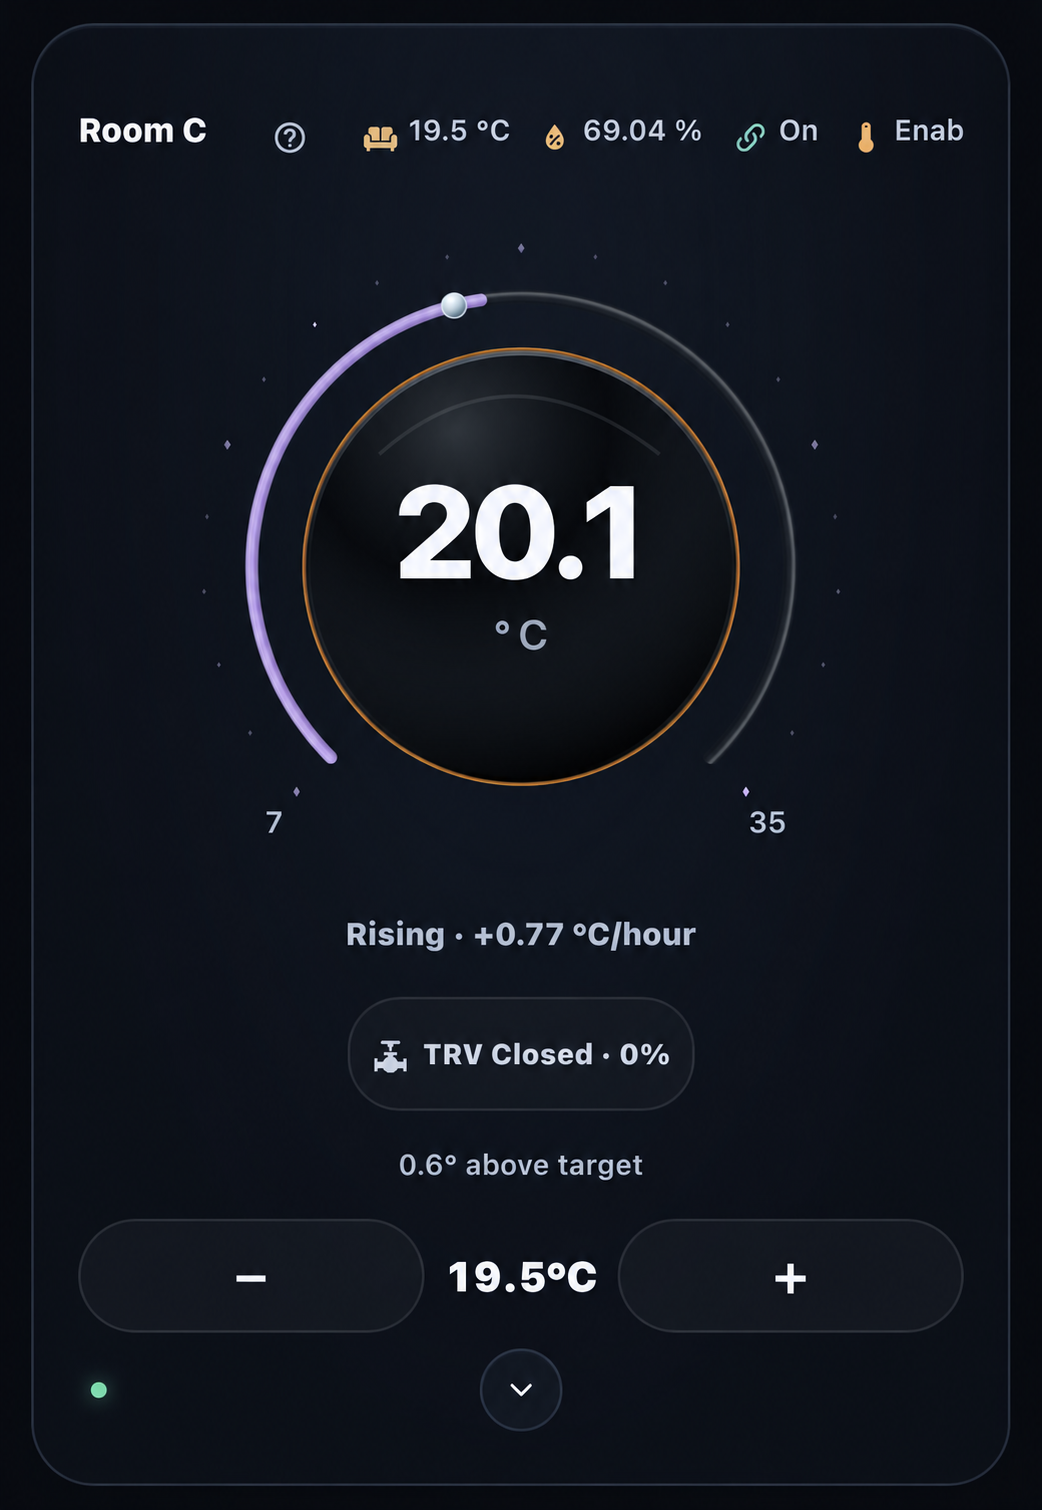 |
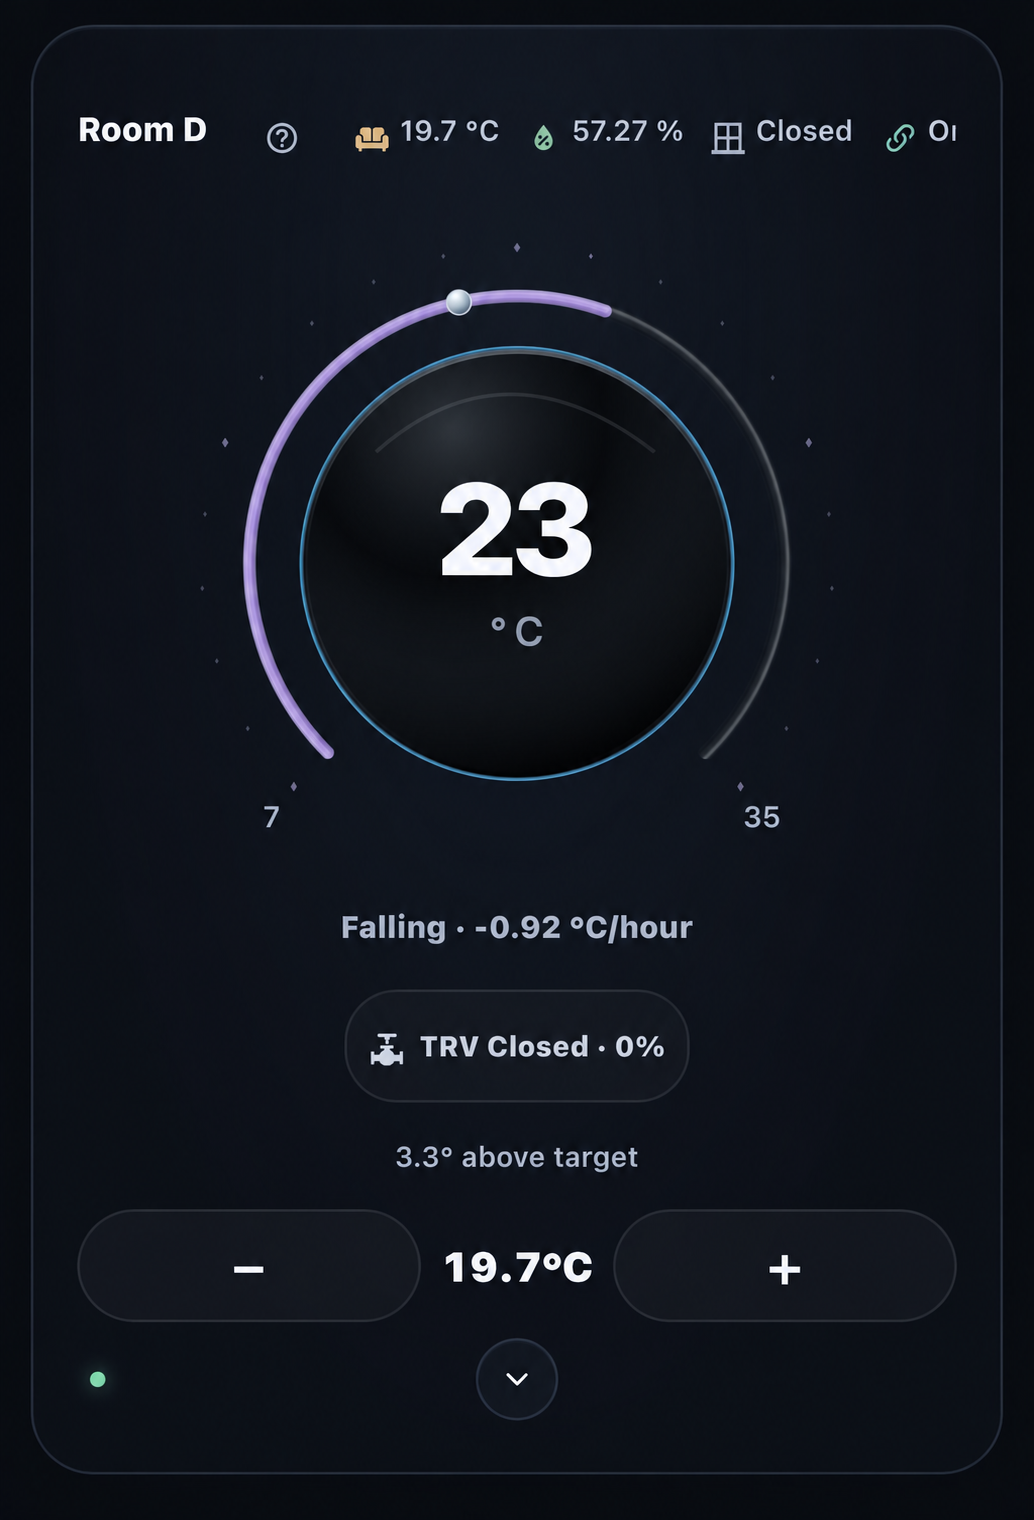 |
Both outer arcs are lavender because the displayed temperature is above target. The fine ring distinguishes rising from falling readings. The header also shows different humidity colours and a Closed window observation without replacing the main temperature display.
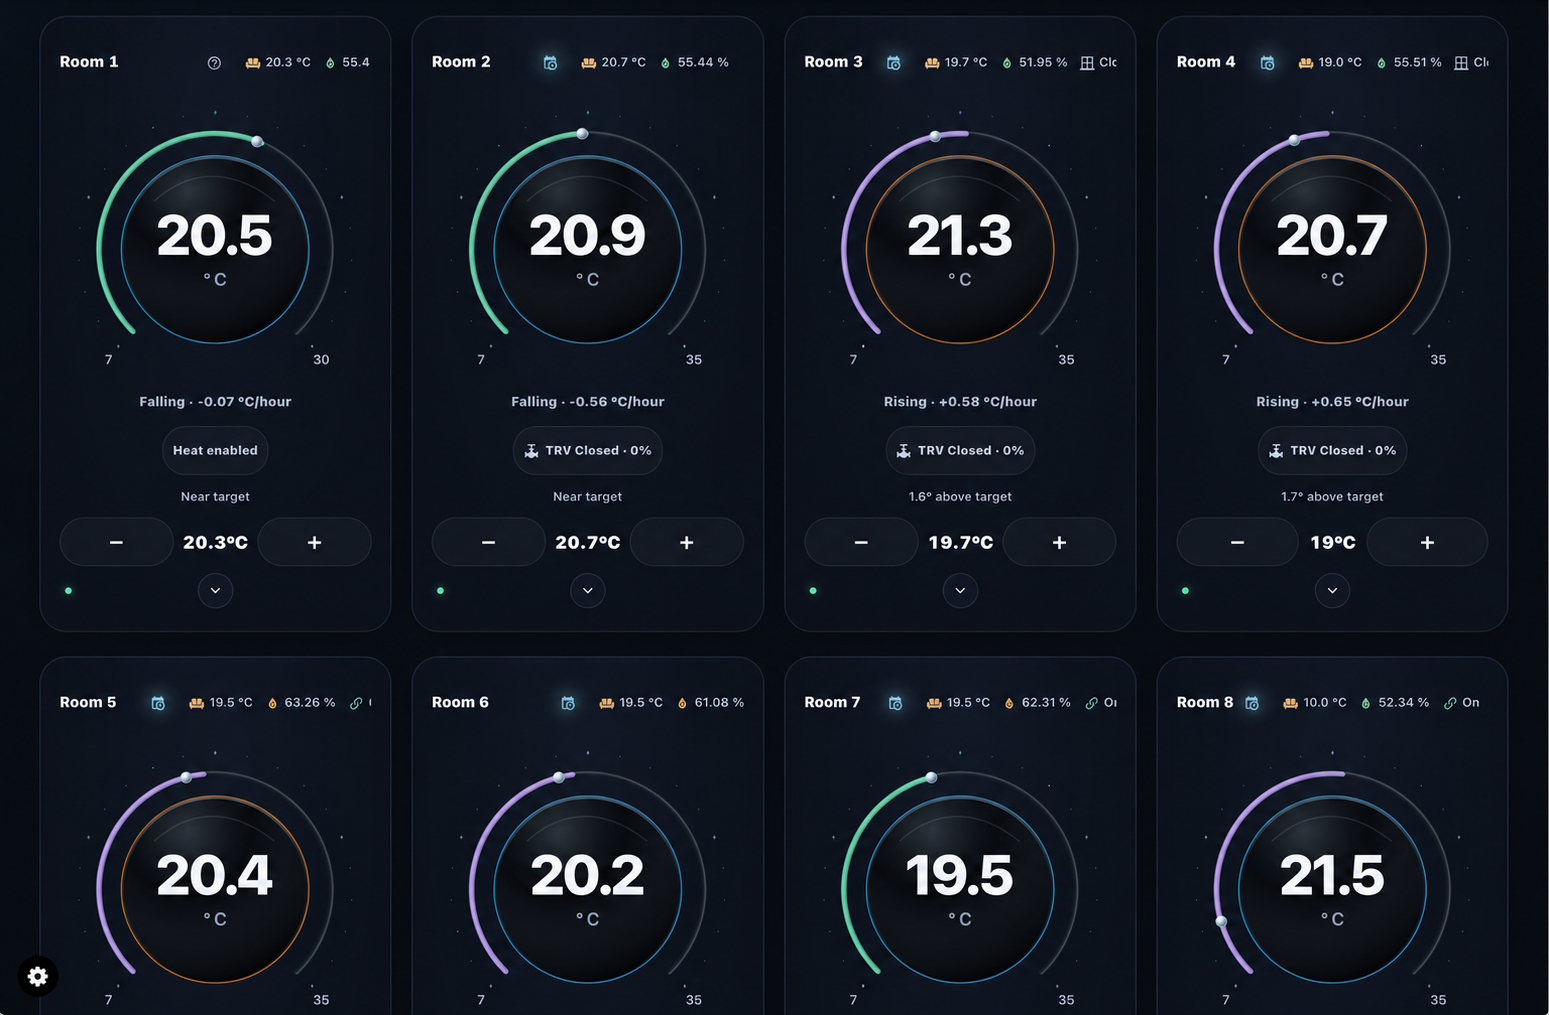
Each card keeps its own readings, target, status and header choices. The original capture includes only part of the second row; some header text is clipped at the horizontal viewport edge. Those limits are retained rather than filled in. This is an illustration of a wider installation layout, not a complete dashboard supplied with RC.1 or a physical-tablet validation record.
Explore detail panels
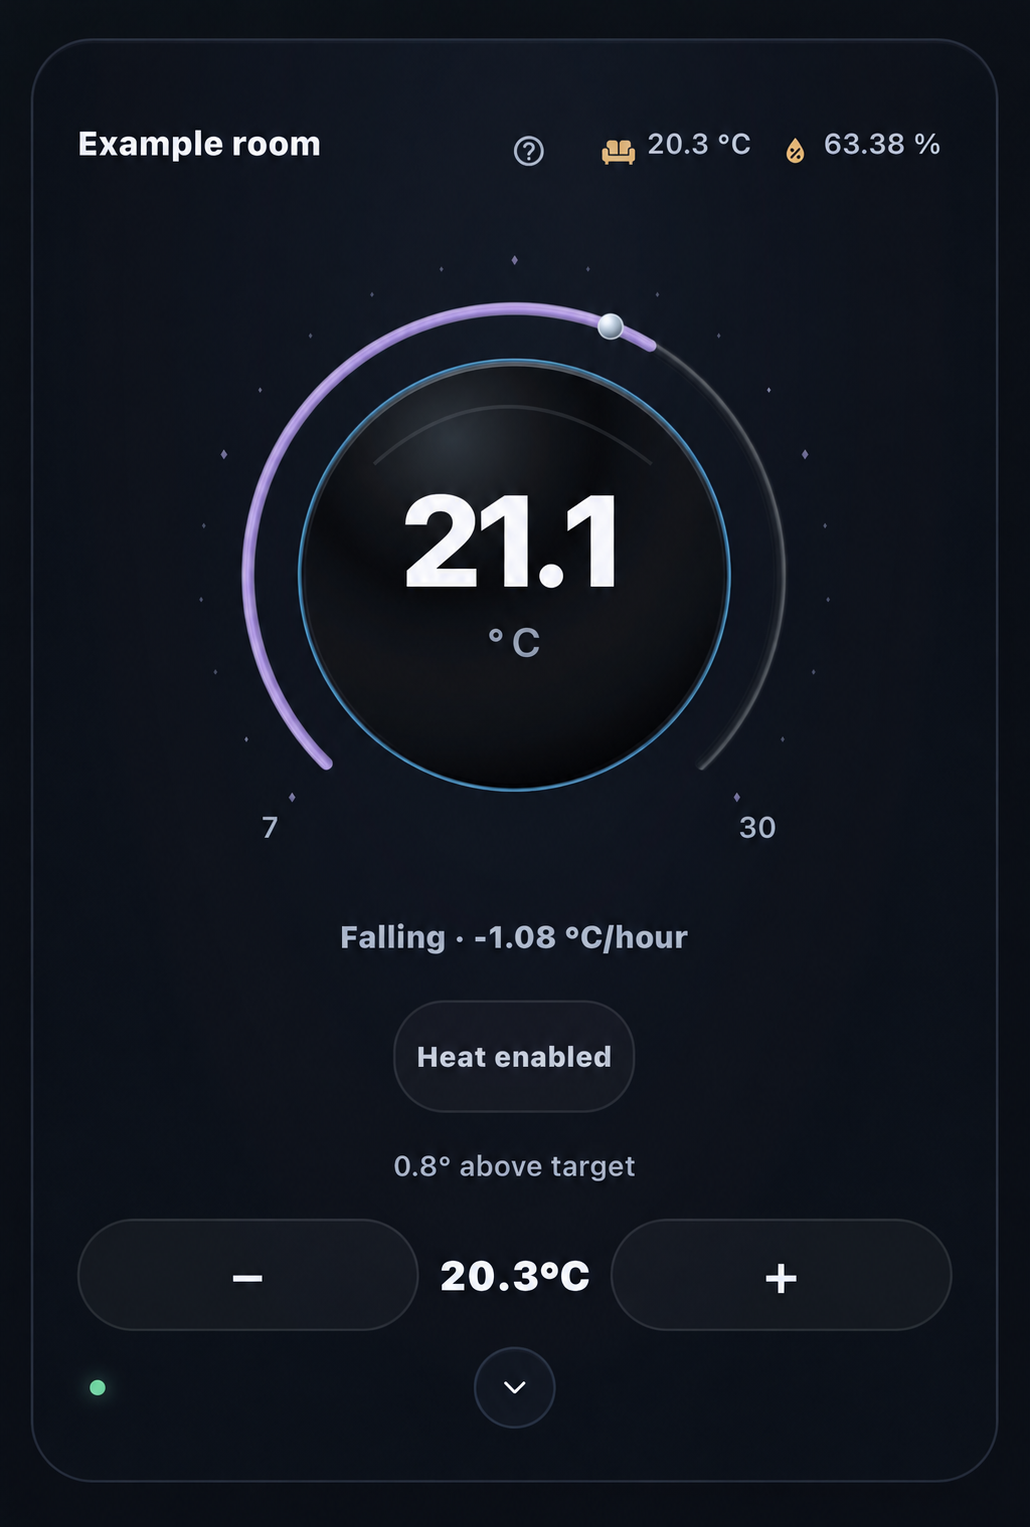
Heat enabled describes the selected mode. Window detection opens a focused view of detector state and the configured response:
| Heat enabled | Window detection |
|---|---|
 |
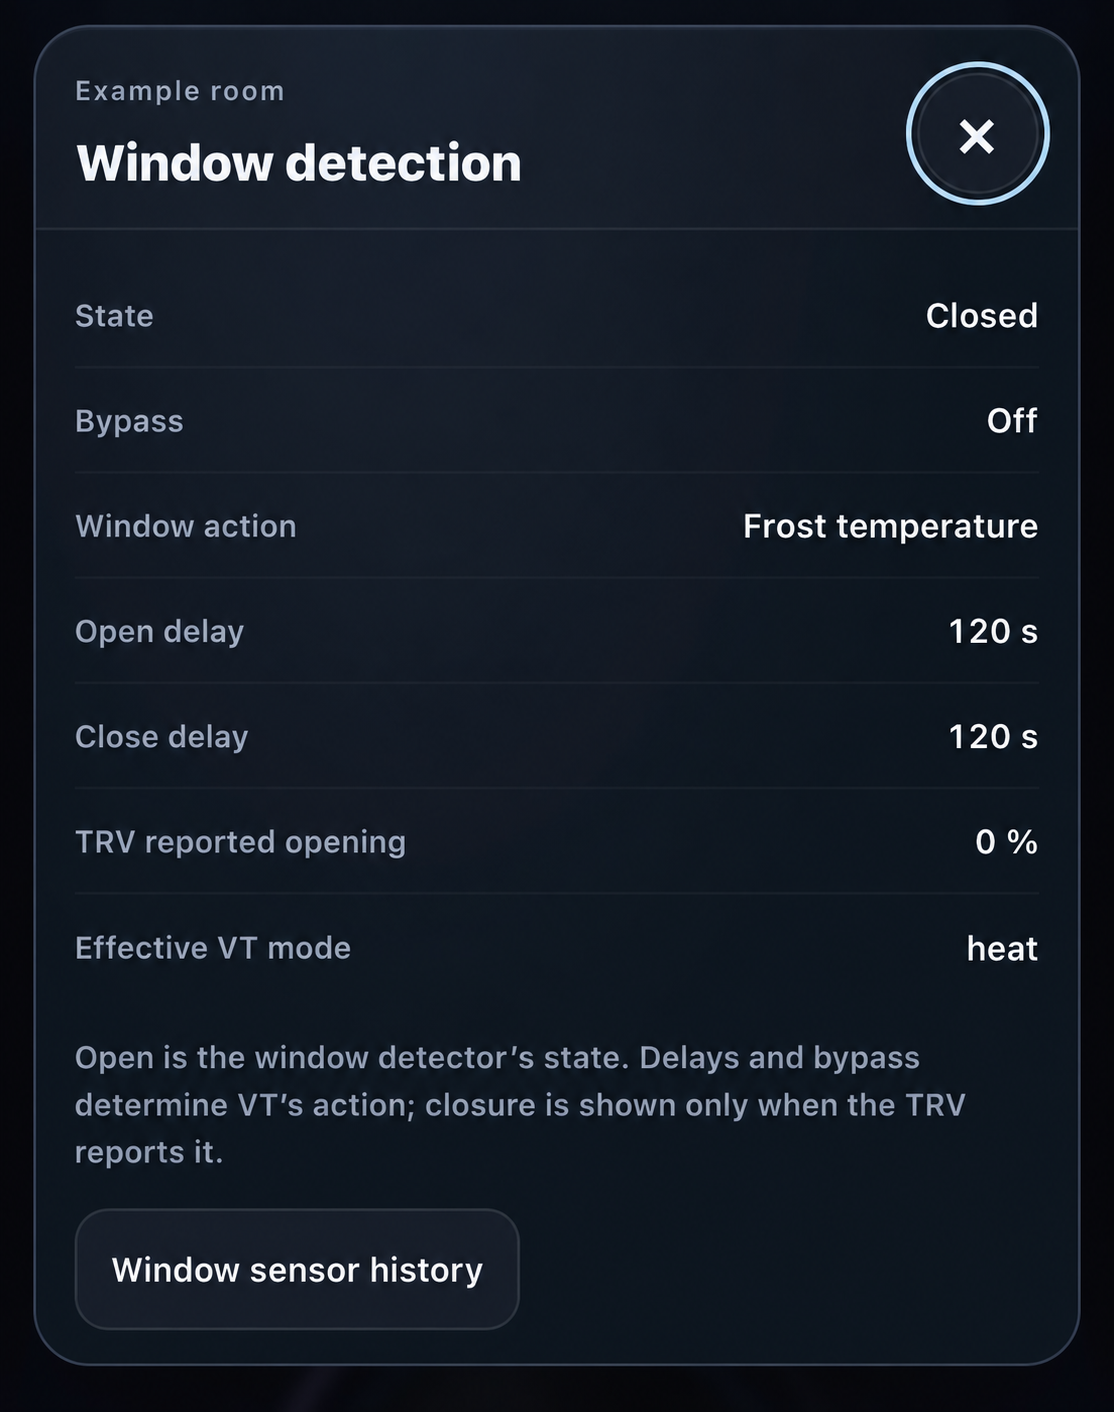 |
Heat enabled describes the selected HVAC mode. The window panel keeps detector state, configured action, delays and reported valve position separate. No readings or UI states were changed to make the examples appear more favourable.

Explore our other projects
Humidity Intelligence →