In this project, researchers are searching for a bacterial species that can synthesize proteins that taste like beef. Since human body is the source of thousands of types of bacteria, researchers believe that ideal bacterial species to make synthetic beef is found in human belly button. A sample is taken from navels of people across the country to identify bacterial species that is present in human belly.
We have used Javascript and Plotly.js( a JavaScript data visualization library) to create an interactive data visualization for bacterial data in the web.
Tools used: VS Code, Web Browser, Command Line Interface, Github, HTML
- Create basic plots with Plotly, including bar charts, line charts, and pie charts.
- Use D3.json() to fetch external data, such as CSV files and web APIs.
- Parse data in JSON format.
- Use functional programming in JavaScript to manipulate data.
- Use JavaScript's Math library to manipulate numbers.
- Use event handlers in JavaScript to add interactivity to a data visualization.
- How to use interactivity to enhance your visualizations.
- Deploy an interactive chart to GitHub Pages
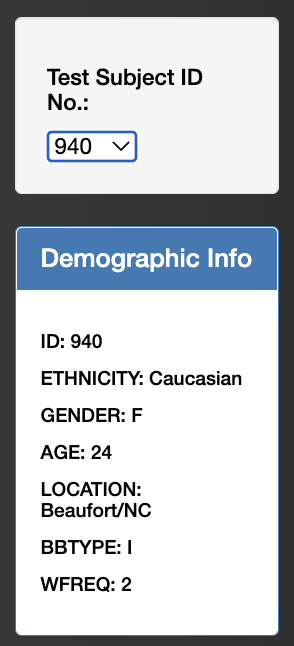
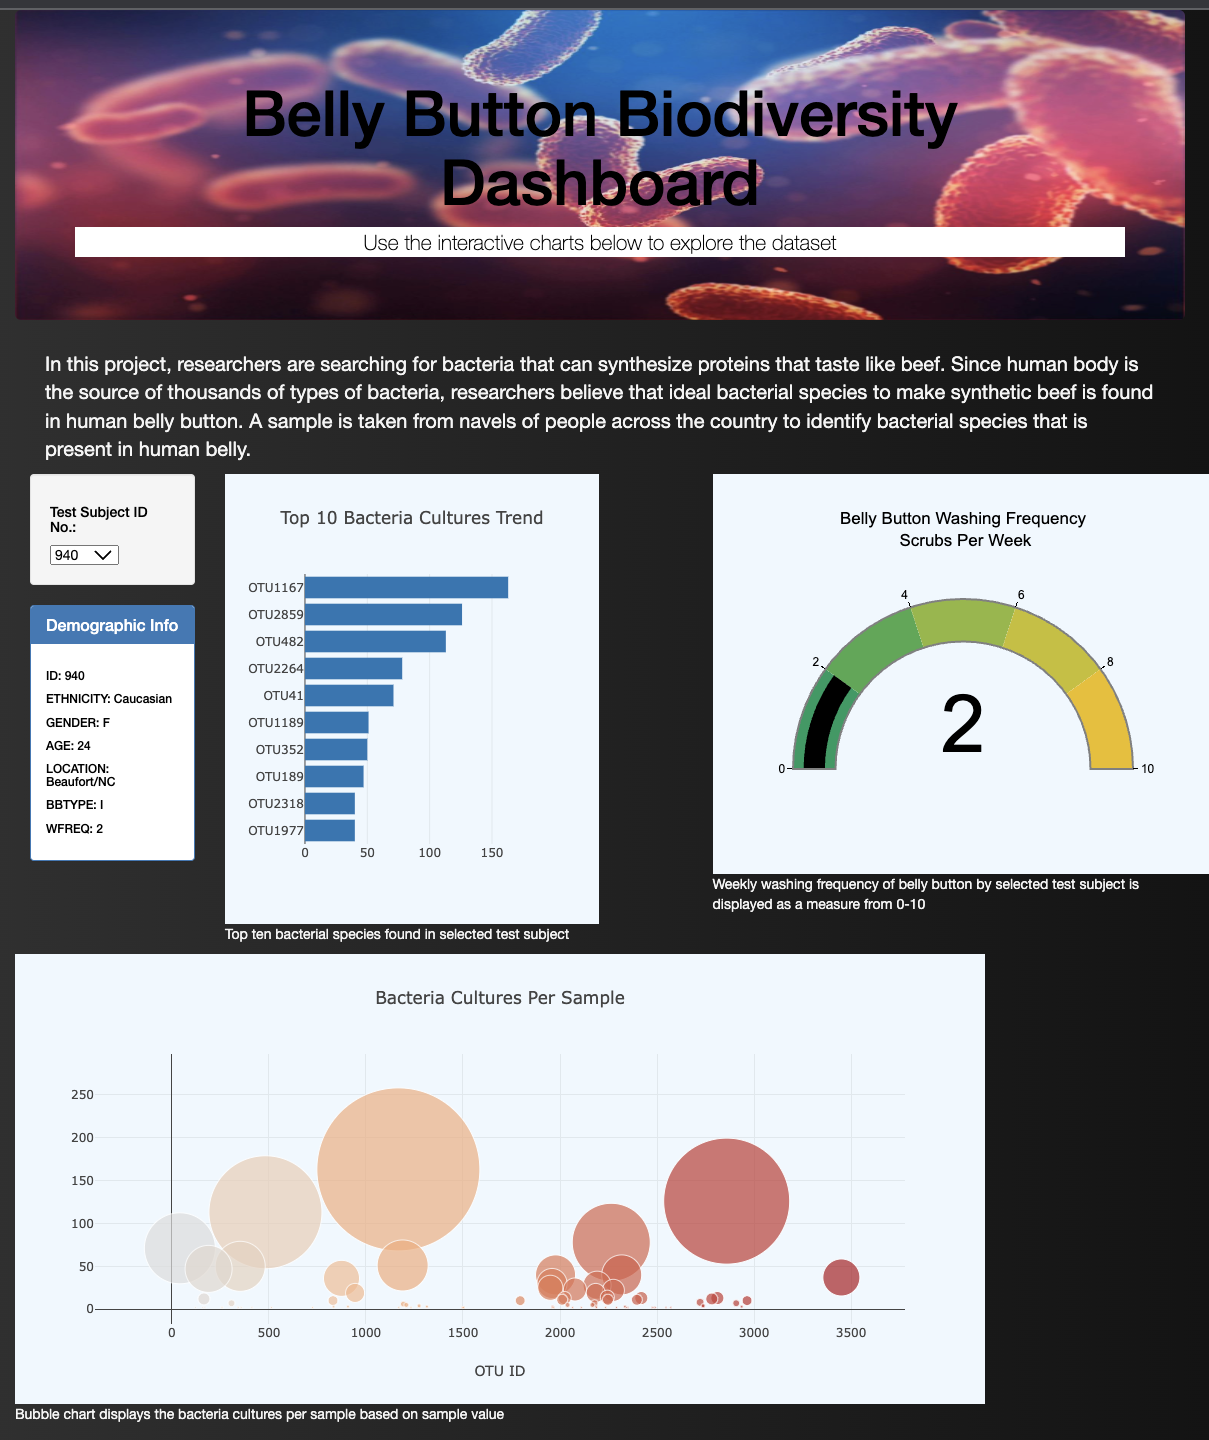
When a test subject ID no. option is selected, demographic panel displays the respective demographic data. When the dashboard is first opened in a browser, ID 940’s data is displayed in the dashboard.
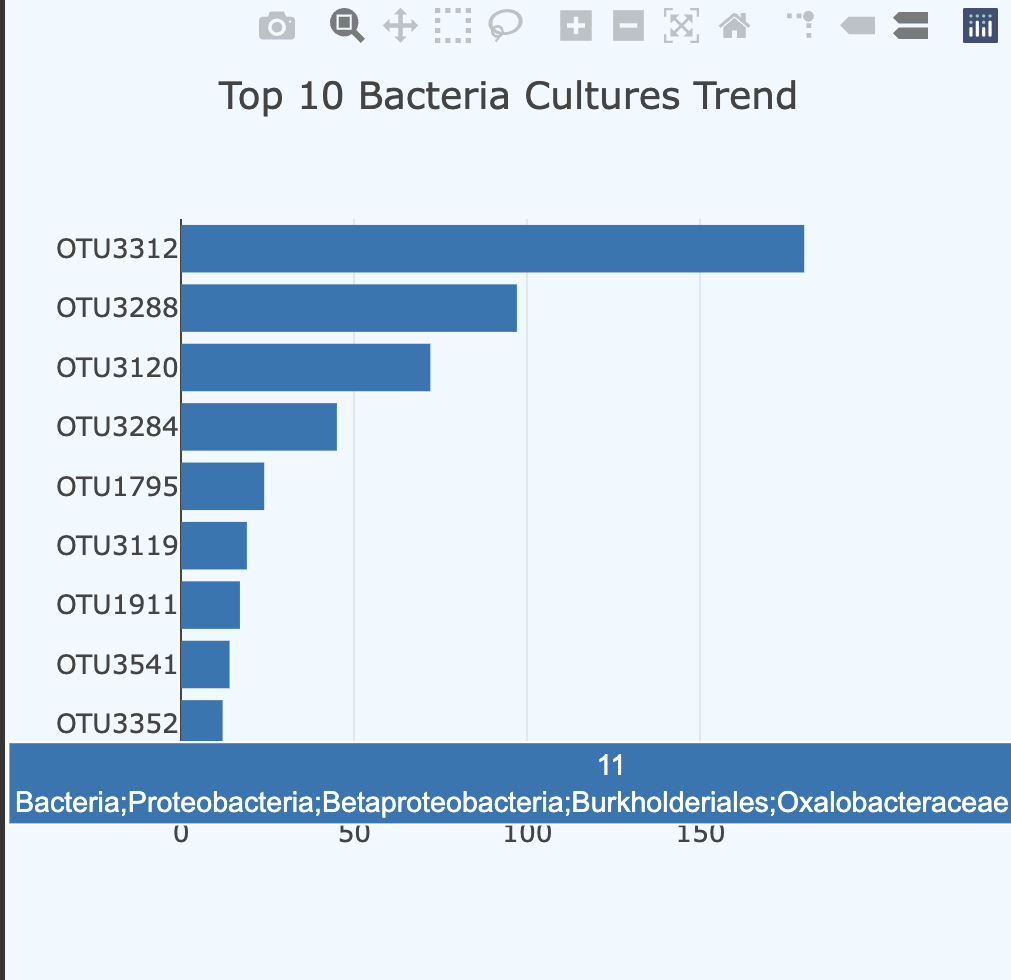
- Horizontal bar chart components are;
- The y values are the otu_ids in descending order
- The x values are the sample_values in descending order
- The hover text is the otu_labels in descending order.
- Bar chart summarizes the following result;
- The top 10 sample_values are sorted in descending order
- The top 10 sample_values as values
- The otu_ids as the labels
When an individual’s ID is selected from the dropdown menu webpage, bubble chart displays bacteria cultures per sample.

The bubble chart components are;
- The otu_ids are the x-axis values.
- The sample_values are the y-axis values.
- The sample_values are the marker size.
- The otu_ids are the marker colors.
- The otu_labels are the hover-text values.
When a individual ID is selected from dropdown menu, the gauge chart displays the weekly washing frequency's value as a measure from 0-10 on the progress bar

Link to webpage: https://sirjanashrestha.github.io/Plotlydeploy/