Repository navigation
Related individuals
SUMMIT's h² and rg estimators assume an unrelated GWAS sample. Close relatives share untagged genetic variation and often environment, so including them inflates the estimates. Pruning to an unrelated set avoids this but discards people, which matters most in small or admixed cohorts.
This workflow keeps every individual and removes the related pairs from the
estimating equations instead. Run the GWAS on everyone as usual. SUMMIT then
computes the related pairs' part of each trait's association statistics,
REL_M, from the genotypes and phenotypes. By default this is one number per
trait, which is added to the summary statistics as a constant column and
subtracted by summit --h2. The estimate stays unbiased whatever the
phenotypic covariance between relatives.
Methods gives the estimating equations.
For a runnable synthetic example of the whole workflow (sibling pairs, h² and
rg), run bash example/related_individuals.sh from the repository root.
- The BED genotypes used for the GWAS.
summit relatives momentsdoes not yet read PGEN. - A phenotype table with
FID IIDfollowed by one or more phenotype columns, as given to the GWAS. - The GWAS covariates,
FID IIDfollowed by numeric columns, without an intercept column. Use exactly the covariates of the GWAS, including genotype PCs. - A pair table with
IID1 IID2, optionallyFID1 FID2and a kinship column. - GWAS summary statistics from ordinary least squares on all individuals with
those covariates, for example PLINK 2
--glm. Mixed-model statistics (BOLT-LMM, REGENIE, fastGWA) are not valid inputs.
IID1 IID2 RELATEDNESS
SIM000001 SIM000002 0.51
SIM000002 SIM000417 0.06
Listed pairs are closed into families (connected components) by default, and
every within-family pair is excluded. --no-closure excludes only the listed
pairs. With --kinship-col and --kinship-min, only pairs above the threshold
in that column are used. For relatedness (twice the kinship coefficient), 0.0442
keeps fourth-degree and closer relatives and is a reasonable default.
SUMMIT's PC-adjusted GRM on LD-pruned SNPs and PC-Relate give practically the same families. KING-robust overstates kinship for individuals of intermediate ancestry and should not define pairs in recently admixed cohorts. Compute PCs on unrelated individuals and project relatives onto them (PC-AiR) so that families do not form their own components.
summit relatives moments \
  --geno study.bed --pheno phenotypes.tsv --covar covariates.tsv \
  --pairs pairs.tsv --kinship-col RELATEDNESS --kinship-min 0.0442 \
  --out results/relmoments
The command writes:
-
results/relmoments.rel_m.tsv: one row per phenotype,PHENO N N_COVARIATES PAIRS REL_M, whereREL_Mis the related-pair moment per SNP in HE scale (theV-weighted mean over SNPs of the per-SNP moments). With--annot annot.txt, a partitioning annotation such as SUMMIT's MAF/LD bins, the table also has oneREL_M_<class>column per class, for partitioned fits. -
results/relmoments.jsonandresults/relmoments.log.
One genotype pass gives the values of every phenotype. Each phenotype keeps
its own complete-case sample, related pairs, covariate projection and N_eff,
as in a GWAS that drops missing values, and its values equal those computed
from the per-SNP moments of that sample. Missing genotypes are mean-imputed,
which agrees with complete-case GWAS to first order in the missing fraction.
The pass reads all genotypes but forms the projected genotypes only for people
in families, so its cost is mainly reading the genotypes, plus the number of
related pairs times the number of SNPs. REL_M does not depend on allele
coding.
One value per trait keeps the point estimate of the single-component model,
and of each class of the annotation used, exactly as with per-SNP values when
the LD scores come from the same sample (with LD scores from another sample,
the two differ only through the difference between the samples' V weights).
Only the jackknife changes, because each block's share of the total is then
proportional to its number of SNPs (weighted by V). In UK Biobank simulations
this moved standard errors by less than 0.1% (Simulations).
--per-snp also writes the exact per-SNP values,
results/relmoments.tsv.gz (CHR SNP BP A1 A2 and one REL_M_<phenotype>
column per phenotype). This needs one genotype pass per distinct complete-case
sample, and append and cross-m12 accept the file in place of the
per-phenotype tables.
Add --cross to write results/relmoments.rel_m12.tsv, the cross-trait value
REL_M12 for every pair of phenotypes
(see Genetic correlation). With --per-snp it covers
only pairs with the same complete-case sample.
When the LD scores are computed in the study itself, the LD-score step adds the
relatives' share (see LD scores).
Add the column to the summary statistics and fit as usual:
summit relatives append --sumstats trait.sumstats.gz \
  --rel results/relmoments.rel_m.tsv --pheno TRAIT --out trait.rel.sumstats.gz

summit --h2 trait.rel.sumstats.gz --ldscores reference.gw.ldscore.gz \
  --out results/trait
append writes the trait's value in a REL_M column, the same for every SNP.
For a partitioned fit, run moments and append with the same --annot, and
each SNP gets its class's value. When a summary-statistics file has a REL_M
column, SUMMIT subtracts it from each SNP's HE-scale moment. Annotations,
partitioned models and every jackknife design work unchanged. The log reports
c_rel and the number of distinct REL_M values; SNPs with a missing REL_M
are dropped. --h2-batch-fast does not accept REL_M.
A study that releases summary statistics can add the constant REL_M column
itself, as it adds COV_RANK. Users then fit them with the related pairs
excluded and need nothing else, unless they compute LD scores in the same
sample.
Each individual is also paired with themselves in the h² estimating equation,
with the weight K_ii, the diagonal of the GRM. Inbred individuals have a
larger K_ii. When their residual variance is also larger, for example because
the effects of untagged causal variants grow with inbreeding, the fit credits
that excess to the SNPs. This happens in related and unrelated samples alike.
Add --inbreeding to moments to leave these diagonal terms out of the
equation as well, in the same way as the related pairs:
summit relatives moments --geno study --pheno phenotypes.txt --covar covariates.txt \
  --pairs pairs.tsv --kinship-col RELATEDNESS --kinship-min 0.0442 --inbreeding \
  --out results/relmoments
Nothing else changes. append copies three more values (REL_S, REL_LAMBDA
and REL_DIAG, plus one REL_DIAG_<class> column per class with --annot),
and summit --h2 uses them whenever they are present. The log then says
"diagonal terms left out of the estimating equations". REL_S depends on the
phenotype; REL_LAMBDA and REL_DIAG depend only on the genotypes, the
covariates and the related pairs. The option also removes the small bias from
the related pairs' leverage on the covariates.
With LD scores computed exactly in the GWAS sample, the estimate equals the
individual-level method-of-moments estimate whose first equation uses only
pairs of different, unrelated individuals (tested to a relative difference of
1e-7). The cost is precision, because the diagonal terms also carry a little
information. In exact calculations for UK Biobank cohorts of 4,000 to 9,000
people (South Asian and African ancestry, 10 to 20 PCs), the standard deviation
of the estimate was 2% to 3% larger, and in a European cohort of 15,000 less
than 0.1% larger. The bias it removed in these cohorts was a few percent of the
standard error, about the same as this cost. The cost falls with sample size,
so the option is most useful in large samples with much inbreeding. The extra genotype pass projects the genotypes of everyone in each
complete-case sample, which adds roughly one GWAS-sized projection per sample.
For genetic correlation, run moments with --cross --inbreeding; cross-m12
then also writes REL_S12, the cross-trait value, and summit --rg leaves the
diagonal terms out of both h² fits and the cross-trait equations. This needs
the values in both summary-statistics files and in the --rel-m12 file, and
the overlapping covariance in HE scale (--pheno-rg/--pheno-rg-cov or
--overlap-covariance-rg) rather than an estimated intercept, with the jackknife
or delta standard errors; SUMMIT stops with a message if any of these is missing. --per-snp works with --inbreeding
too: the run's PREFIX.rel_m.tsv and PREFIX.rel_m12.tsv hold the values,
and append and cross-m12 read them next to the per-SNP table. LDSC
weighting (--weight-mode ldsc) runs on LD scores without the V column,
whereas these values are defined with it, so it refuses them.
A mean shift with inbreeding (inbreeding depression) is handled by adding an
inbreeding coefficient to the covariates of the GWAS, moments and the LD
scores.
The --inbreeding values are one number per phenotype (and class), which gives
exact point estimates but leaves the deleted block's diagonal terms in every
jackknife replicate. In UK Biobank cohorts the jackknife SE was within 1% of the
exact replicate-wise SE with 8 MAF-LD bins and 200 blocks, and within 4% with
chromosomes, and it erred on the conservative side.
The block jackknife sees the covariance of the moments within each block but
not the covariance between blocks. In admixed and other structured samples that
covariance comes from long-range LD and from the self-pair terms, whose K_ii
tracks ancestry on every chromosome, so the jackknife SE is too small.
--long-range-se adds it back. It needs the share of the LD-score mass that
comes from SNP pairs in different blocks, which summit relatives longrange
computes from the GWAS genotypes:
summit relatives longrange --geno study --covar covariates.txt --pairs pairs.tsv \
  --kinship-col RELATEDNESS --kinship-min 0.0442 --annot mafld8.annot --out results/longrange
summit --h2 study.with_rel_m.tsv --ldscores study.gw.ldscore.gz --annot mafld8.annot \
  --long-range-se results/longrange --out results/h2
The variance is then
Var = V_jk / (1 - rho_s - rho_l (1 + 2 h2)) + 4 h2^2 (1 - sum f^2) / n
rho_s is the part of the between-block share carried by the self-pair terms
and rho_l the rest, which comes from long-range LD. Long-range LD also links
the blocks' genetic-signal terms, hence the factor 1 + 2 h2. The second term
is the variance of products of different blocks' genetic values, which the
jackknife misses even in homogeneous samples; f are the blocks' shares of the
SNPs and n is the sample size. Fits with the moments --inbreeding values
have no self-pair part. Negative shares are set to 0, so the corrected SE is
never below the jackknife SE.
longrange writes bin-by-bin sums, with and without self-pairs, for the
chromosome design and for 200 blocks (--nblocks), so one file serves
--njack 200 and --njack chr. Run it on the GWAS samples with the GWAS
covariates and the fit's annotation. The results table then has h2_se
(corrected), h2_se_jk, jk_factor and long_range_rho. The pass holds the
projected genotypes in memory (4 bytes per sample and SNP). With 8 MAF-LD bins
and 100 probes it took 1.5 to 6.5 minutes on 16 cores for 3,400 to 12,000
people and 0.4 to 1 million SNPs.
In UK Biobank cohorts the corrected SE was 0.98 to 1.02 times the exact rescaled SE with 8 MAF-LD bins, and 1.00 to 1.19 times with one component, against 0.89 to 1.00 for the jackknife alone. At h² of 0.25 and 200 blocks the correction raised the SE by about 1% in white British participants, 5% to 11% in South Asian participants, 5% to 7% in African-European admixed participants and 5% in a wider African-ancestry group.
--rg takes the same option. Each trait's h² SE is corrected as above. For the
genetic covariance, 1 + 2 h2 becomes
m12 = (w1 + 2 w2 + 3 w3) / (w1 + w2 + w3)
with w1 = (1 - h1)(1 - h2) + (c - g)^2, w2 = h1 (1 - h2) + h2 (1 - h1) + 2 g (c - g)
and w3 = h1 h2 + g^2, where g is the genetic covariance and c the
overlapping covariance in HE scale, and the second term becomes
2 w3 (1 - sum f^2) / n. The ratio of the corrected to the jackknife variance of
the genetic covariance is applied to rg. Only the totals change; per-bin SEs are
the jackknife SEs, and the log lists the jackknife SEs of the totals. In the same
cohorts the rg SE was 0.99 to 1.03 times the exact rescaled SE with 8 MAF-LD bins.
--jk-traces, with the traces of summit relatives traces, computes the exact
rescaling SE_jk * sqrt(AV / E[V_jk]) from the traces of every pair of blocks.
The traces are much larger and tied to the SNP set; use them to check the
correction.
| LD scores | Use when | Extra step |
|---|---|---|
| A matched reference, or the study's unrelated subset | The LD-score sample has the ancestry composition of the full GWAS sample | None |
| In-sample, on all GWAS individuals | Admixed or structured cohorts | Subtract the relatives' share |
In recently admixed cohorts, an unrelated subset chosen by kinship pruning can have a different ancestry composition from the full cohort, and therefore different admixture LD. Its LD scores then misstate the trace for the full sample. In a UK Biobank admixed cohort this lowered h² by about 9%; in-sample LD scores removed the bias.
In-sample LD scores include the relatives' pairs. Give the LD-score step the
same pairs and options as moments:
summit --geno study.bed --covar covariates.tsv \
  --relative-pairs pairs.tsv --kinship-col RELATEDNESS --kinship-min 0.0442 \
  --nvecs 20000 --block-size 16384 --num-threads 16 --out ld/study
ld/study.gw.ldscore.gz then has one LD_REL_<column> column per LD-score
column, holding the related pairs' share of that LD score. Fit with this file
as usual. --h2 and --rg subtract LD_REL for summary
statistics with REL_M and use the LD scores unchanged otherwise; the log says
which. The LD-score step uses every sample with complete covariates, regardless
of phenotype missingness, and computes LD_REL with the same samples, covariates,
annotation and V weights as the LD scores. Partitioned LD scores need no
extra option, whatever the annotation. --relative-pairs reads BED or PGEN and
applies to genome-wide LD scores only.
An LD-score file without LD_REL columns is taken to come from unrelated individuals.
Pair exclusion must cover both h² denominators and the cross-trait moment:
summit relatives moments --geno study.bed --pheno phenotypes.tsv \
  --covar covariates.tsv --pairs pairs.tsv --cross --out results/relmoments
summit relatives append --sumstats a.sumstats.gz --rel results/relmoments.rel_m.tsv \
  --pheno A --out a.rel.sumstats.gz
summit relatives append --sumstats b.sumstats.gz --rel results/relmoments.rel_m.tsv \
  --pheno B --out b.rel.sumstats.gz
summit relatives cross-m12 --rel results/relmoments.rel_m12.tsv \
  --pheno1 A --pheno2 B --out a_b.relm12.tsv

summit --rg a.rel.sumstats.gz,b.rel.sumstats.gz --rel-m12 a_b.relm12.tsv \
  --ldscores reference.gw.ldscore.gz \
  --pheno-rg a.pheno.tsv,b.pheno.tsv --pheno-rg-cov covariates.tsv,covariates.tsv \
  --out results/a.b
a_b.relm12.tsv holds the pair's single REL_M12 value. For a partitioned
fit, give cross-m12 the annotation used in moments (--annot): the file
then holds each SNP's class value. --rel-m12 also accepts the value itself,
or a per-SNP file from --per-snp --cross. SUMMIT
requires REL_M in both files and --rel-m12. With only some of them,
the pairs would be removed from some estimating equations and kept in others. With
in-sample LD scores that carry LD_REL, the same file serves h² and rg.
Two phenotypes measured in different complete-case samples are each projected
and normalized in their own sample, as in their GWAS. REL_M12 then sums over
related pairs with one member in each sample, and its weights are
sqrt(V_a V_b). The same genotype pass computes it for every pair of phenotypes.
Its cost grows with the square of the number of phenotypes times the number of
related pairs: in the EUR cohort below (40 phenotypes in 33 complete-case samples,
4,216 pairs) the pass took 35 minutes on 16 cores. For these pairs --inbreeding
writes no REL_S12.
The sample-overlap covariance describes each person's own two phenotypes and
needs no change.
In rg manifest mode, give each pair's --rel-m12 file or value in an optional
rel_m12 column. --long-range-se applies to every pair, and the results table
then also has the jackknife SEs (rg_total_se_jk and the others), jk_factor_rg
and long_range_rho. --rg-manifest-fast accepts neither REL_M nor these
options.
We simulated phenotypes from UK Biobank genotypes in three cohorts that include relatives, with families defined by GRM relatedness above 0.0442.
| Cohort | Individuals | Maximal unrelated subset | Within-family pairs | SNPs | PCs |
|---|---|---|---|---|---|
| EUR | 14,561 | 12,151 | 4,216 | 454,207 | 10 |
| SAS | 8,566 | 7,484 | 2,506 | 448,403 | 20 |
| AFR | 4,327 | 3,903 | 721 | 1,002,034 | 10 |
Every SNP had an effect, except in scenario E, where 1% of SNPs did. The
heritability was 0.25, or 0.10 in scenario D. In scenarios B to E, relatives
also shared an untagged genetic component with variance 0.25 and covariance
proportional to their relatedness. In scenarios C to E they also shared
a household effect with variance 0.10. Scenario A had neither. Each scenario
had 100 replicates. The GWAS used PLINK 2 with the PCs as covariates, and
the summary statistics carried COV_RANK. Each analysis used in-sample LD
scores with the V column, computed in its own GWAS sample, and 200-block
jackknife standard errors. We compared the maximal unrelated subset with
everyone, keeping or excluding the related pairs. The truth is the simulated
heritability.
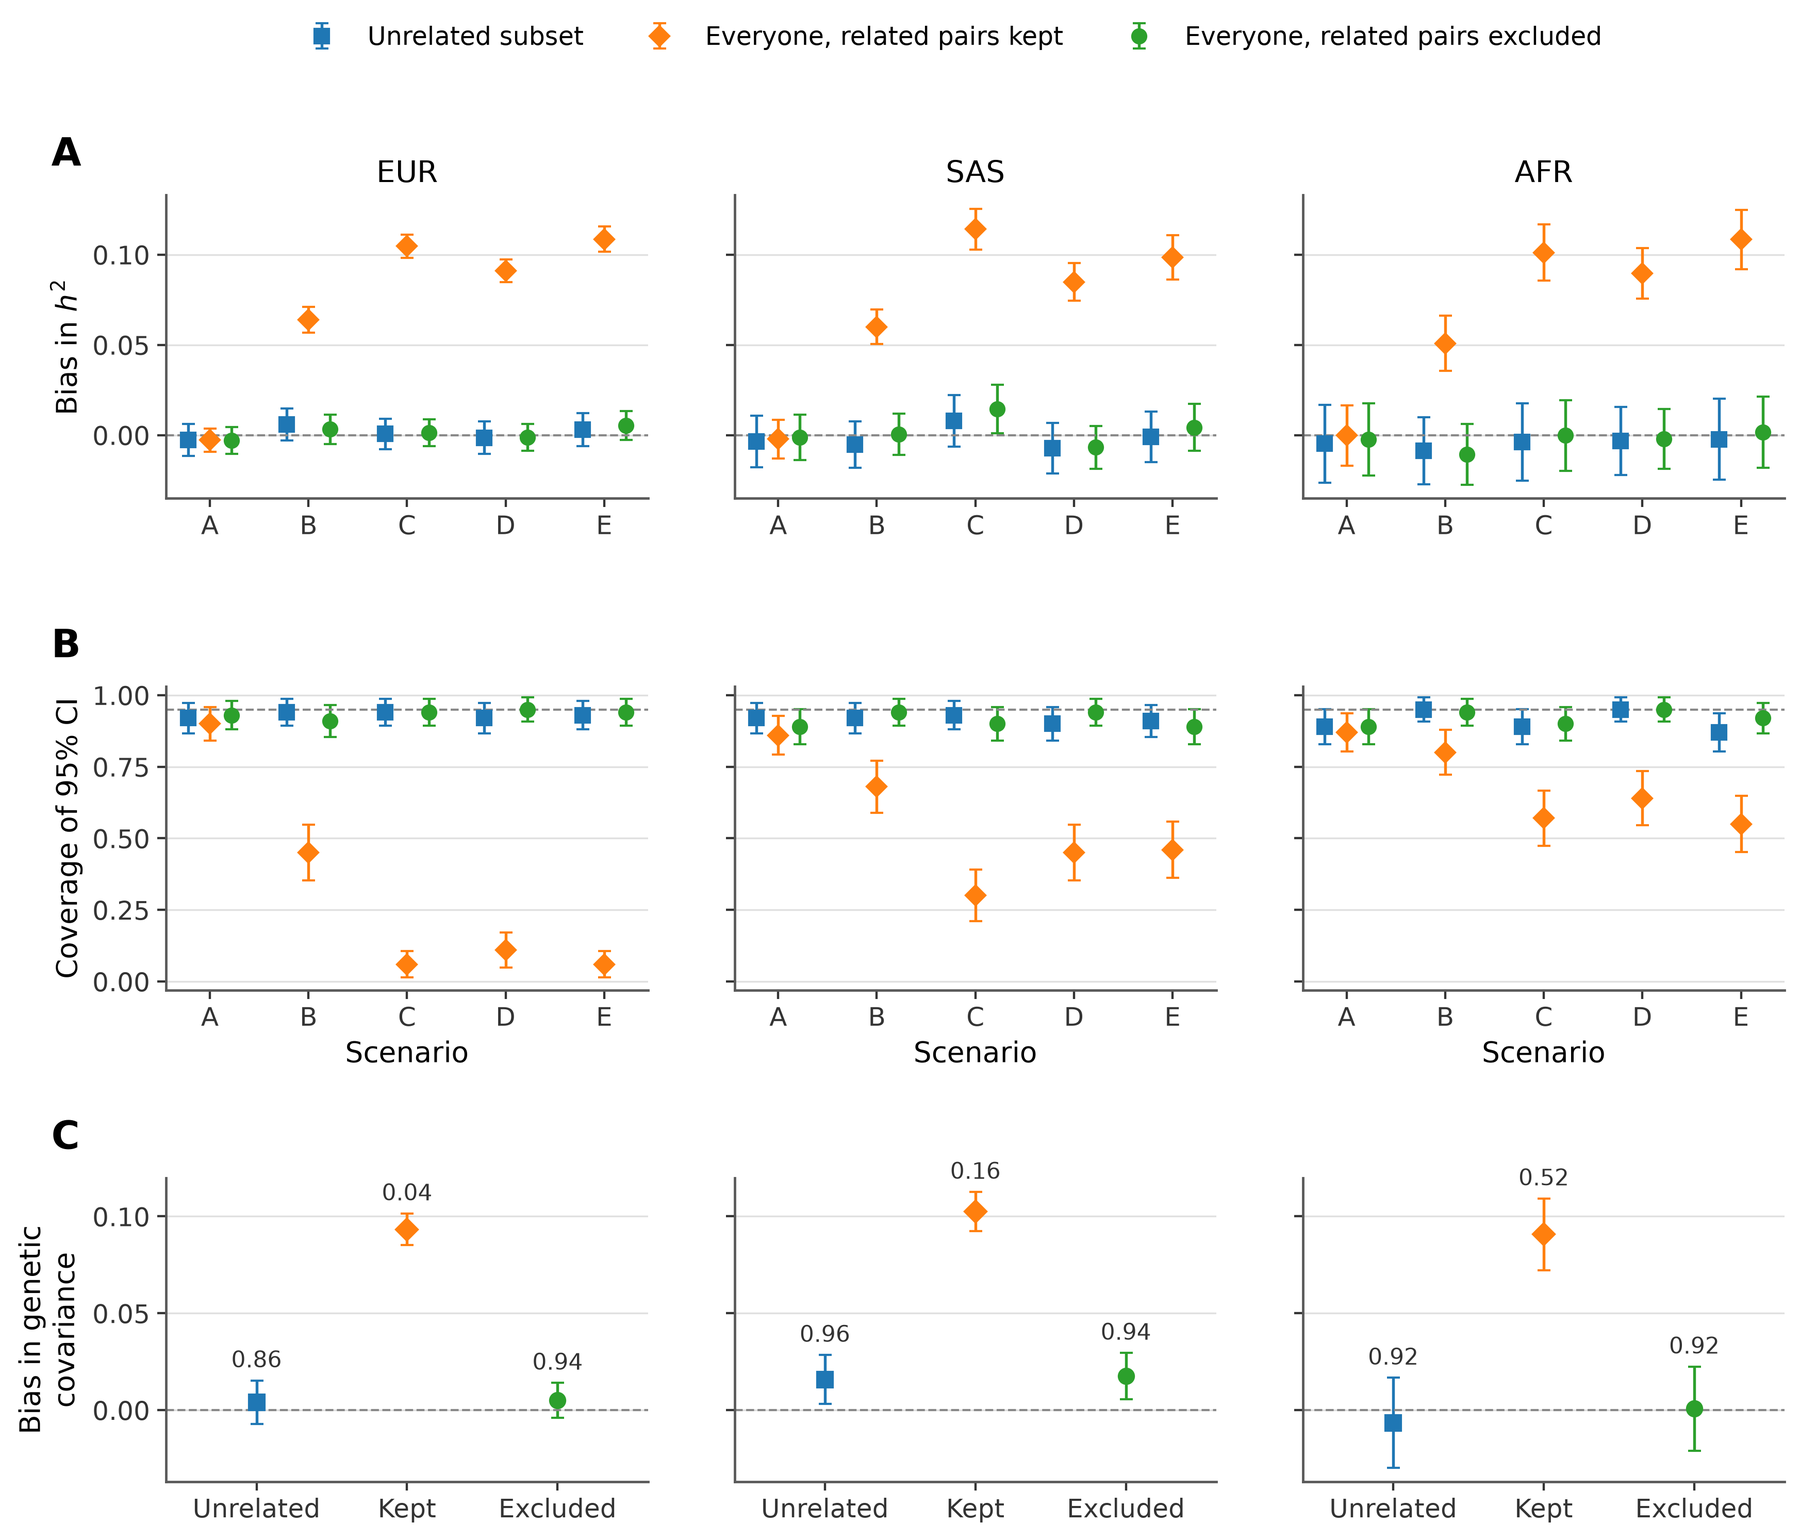
Excluding related pairs gave unbiased estimates in every cohort and scenario (panel A), and so did the unrelated subset. Keeping the related pairs biased h² upward by 0.05 to 0.11 whenever relatives shared more than the SNP kernel. Confidence intervals from excluding pairs covered the truth in 89% to 95% of replicates (panel B). Coverage was lowest in the admixed AFR cohort, where jackknife standard errors are somewhat small.
For genetic correlation we simulated 50 pairs of traits per cohort with
h² 0.25 and rg 0.5, in which relatives also shared correlated untagged and
household effects. The overlap covariance came from --pheno-rg and
--pheno-rg-cov, and the pair-excluded fits used REL_M in both files and
--rel-m12. Excluding related pairs estimated the genetic covariance as well
as the unrelated subset did, and keeping them inflated it by 0.09 to 0.10
(panel C; labels give the coverage of 95% intervals).
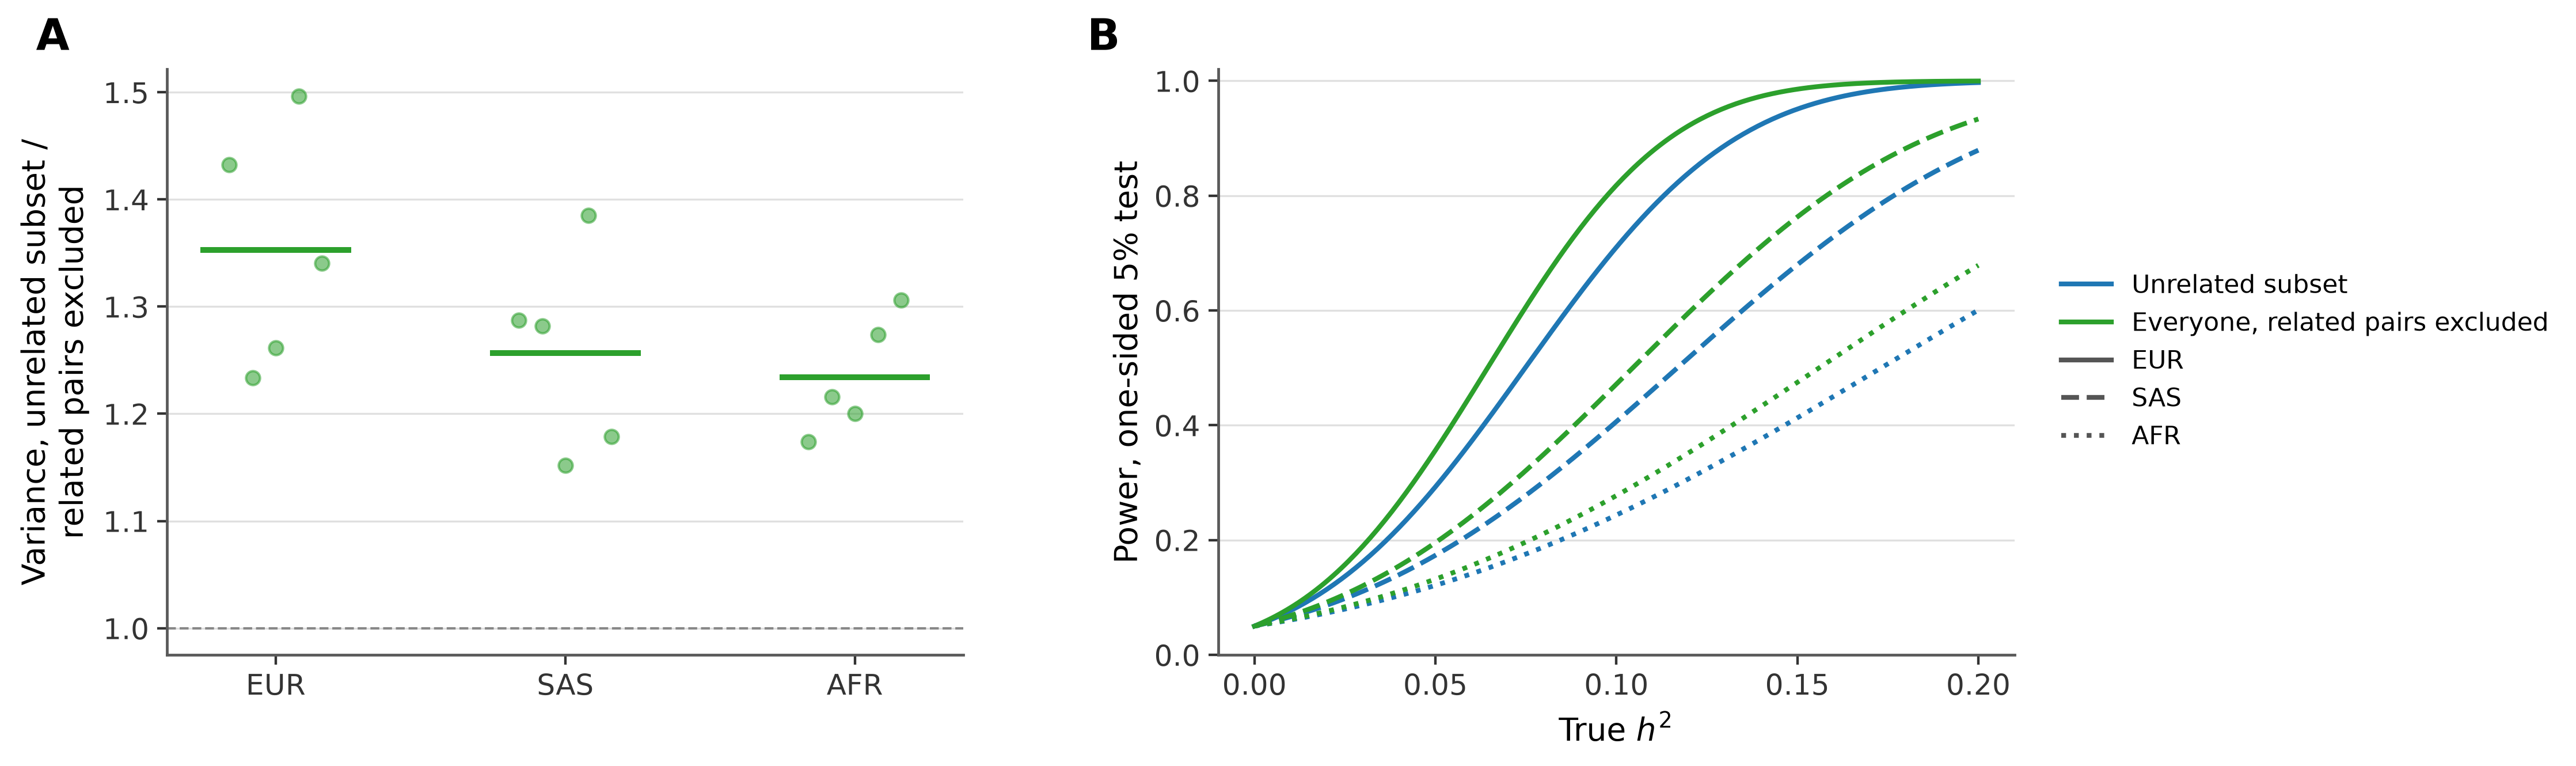
Keeping everyone made the estimates more precise. The sampling variance of the unrelated-subset estimate was 1.15 to 1.50 times that of the pair-excluded estimate (panel A), a mean of 1.35 in EUR, 1.26 in SAS and 1.23 in AFR, where 17%, 13% and 10% of individuals were outside the unrelated subset. Panel B shows the power to detect heritability at the 5% level implied by each analysis's sampling variance.
The simulations used per-SNP REL_M. Refitting every pair-excluded analysis
with one value per trait (the default) left the h² and rg estimates unchanged.
It moved the jackknife standard errors by +0.01% to +0.09% on average (0.993 to
1.009 times the per-SNP standard error in individual fits) and left coverage
unchanged in every cohort and scenario. The genetic-covariance standard errors
moved by +0.08% to +0.10%. A second approximation, which spread each total in
proportion to a genotype-only per-SNP sum over the related pairs, did no better.
In AFR, the same pair-excluded analysis with ordinary LD scores
(--snp-var-weights-off) underestimated h² by 0.010 to 0.023 because the PCs
explain part of the genotype variance
(LD scores).
The simulation and plotting scripts are in
benchmarks/related_individuals/.
The estimate is the SNP heritability of the SNPs in the GRM, the quantity SUMMIT estimates in unrelated samples. Covariance between relatives from shared environment or untagged variants is removed with their pairs, whatever its form. Pairs below the threshold remain; their contribution scales with their squared relatedness and is small for distant relatives.
Jackknife standard errors are computed as for unrelated samples. With one
REL_M value per trait, a deleted block removes the related pairs' part in
proportion to its SNPs rather than its own part; the simulations below compare
both.
A single REL_M value per trait is a weighted sum of phenotype products over
all related pairs and reveals little about any one pair. Per-SNP values
computed from few pairs carry information about those individuals' genotypes
and phenotypes. Keep --per-snp output in the secure environment where it was
computed. Binary traits (PCGC) are not covered.