Real data results
Published UK Biobank analyses illustrate heritability estimation and gene–environment interaction. These figures contain aggregate estimates only.
SUM-RHE, the heritability method underlying SUMMIT, was applied to 291,273 unrelated white British participants and 454,207 common array SNPs. The figure shows 15 traits selected by the largest SUM-RHE estimate-to-standard-error ratios. SUM-RHE estimates closely follow those from individual-level RHE.
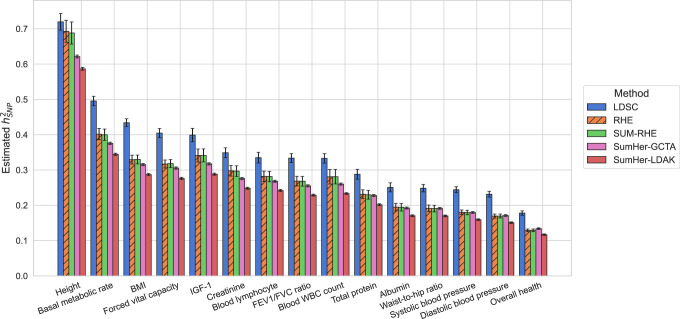
Reproduced without modification from Figure 5 of Jeong et al., Genome Research (2024), under CC BY 4.0. These are results from the published SUM-RHE implementation.
For commands, see Heritability and genetic correlation.
GENIE estimates additive genetic variance, G×E variance, and environment-dependent residual variance. Its published UK Biobank analysis used 291,273 unrelated white British participants and 454,207 common array SNPs. Each exposure was fitted separately, standardized, and included among the fixed effects.
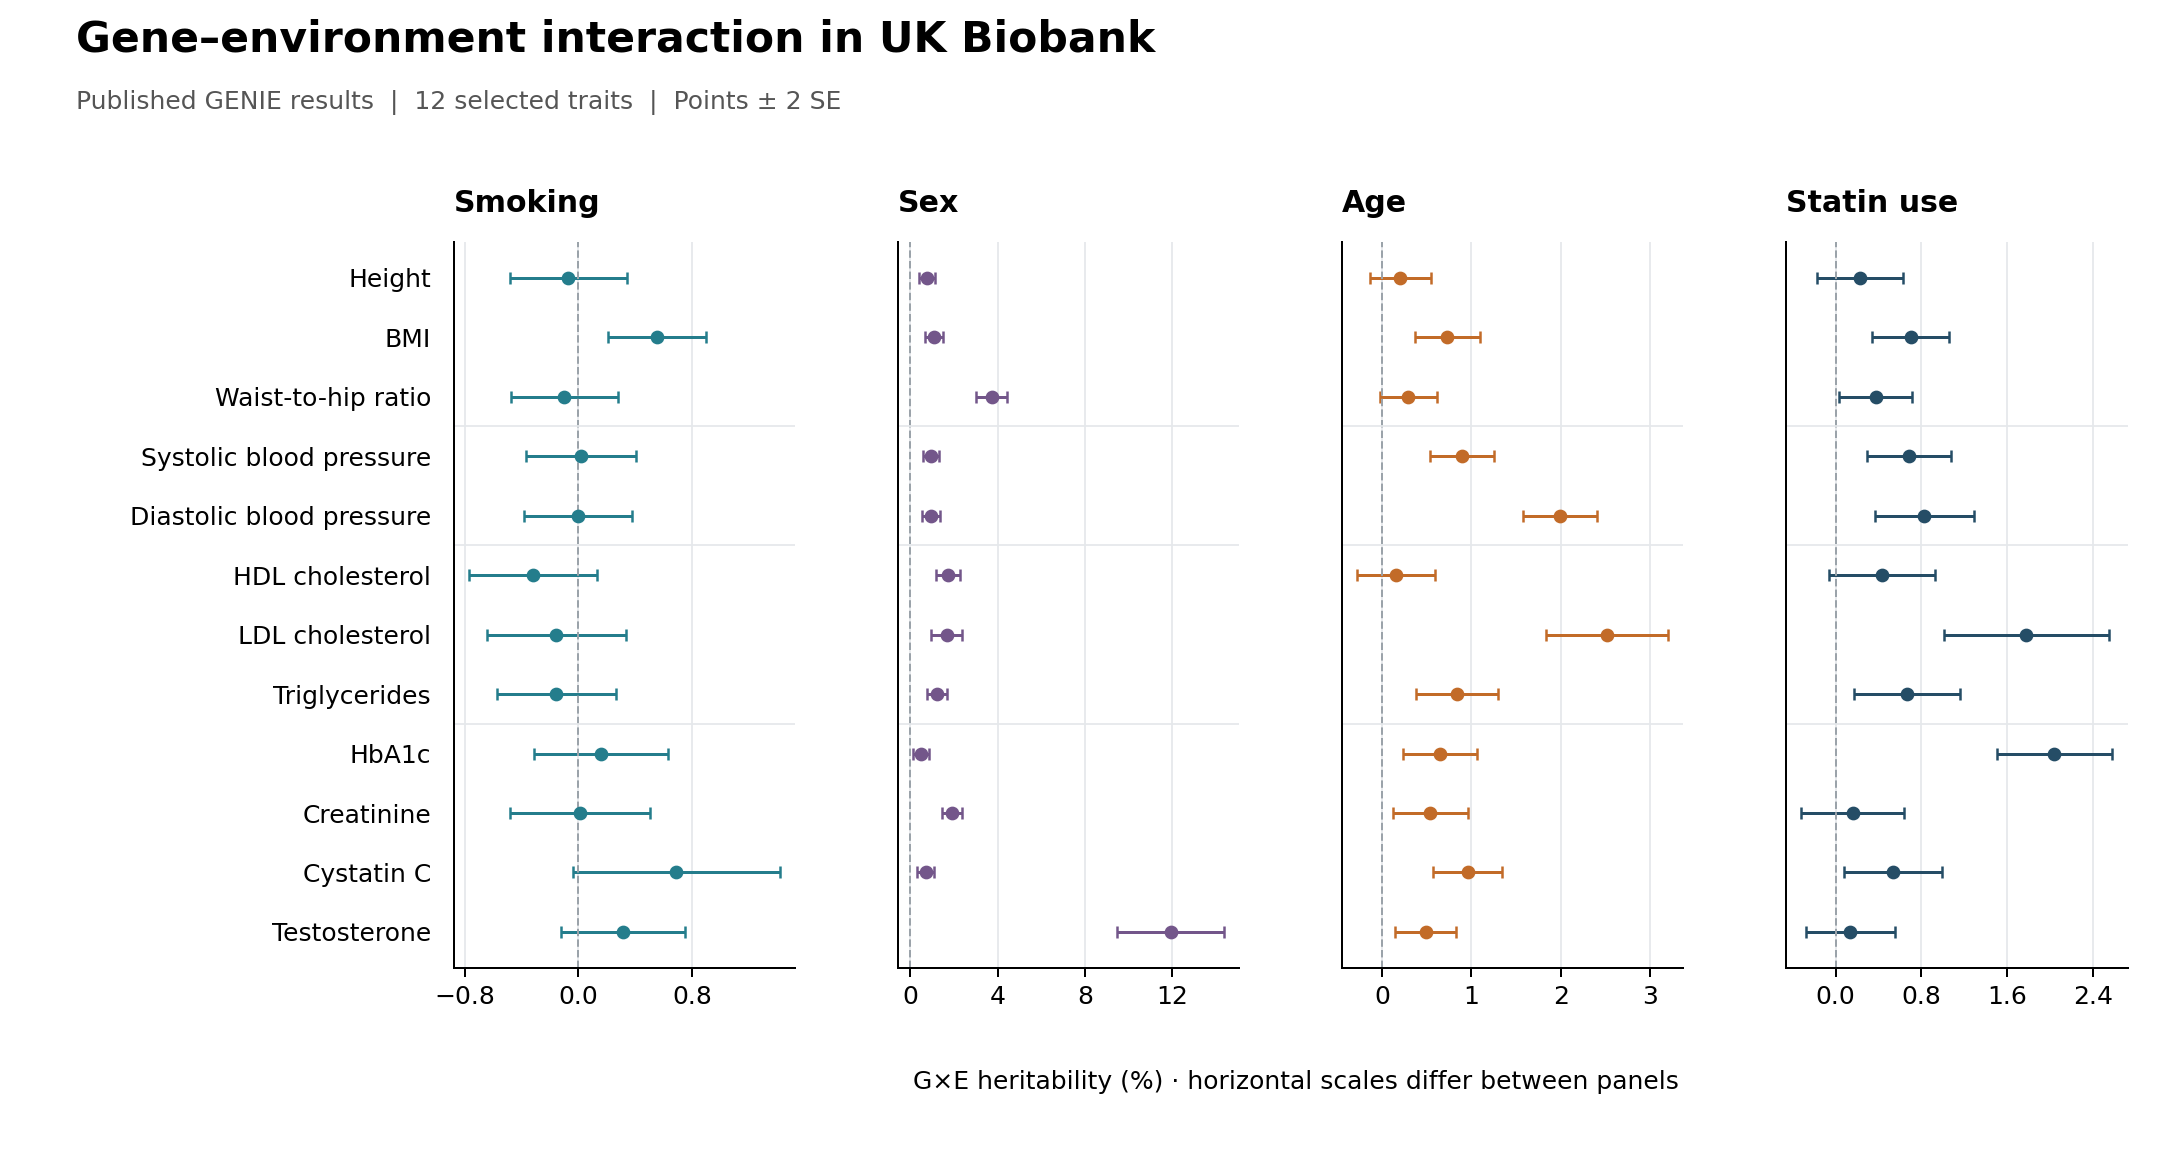
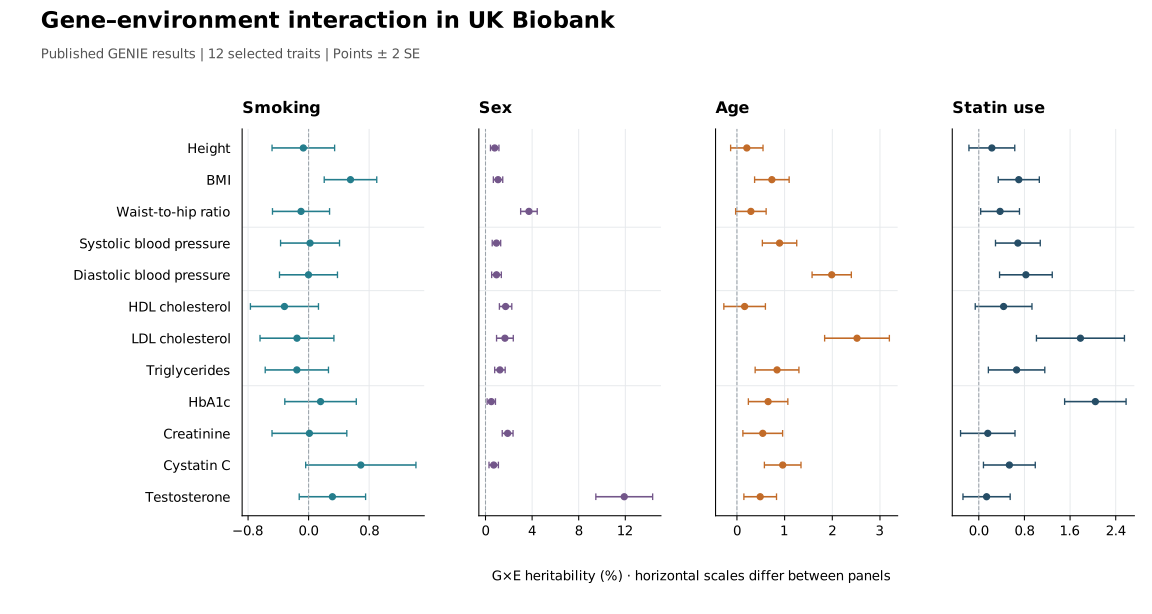
The plot redraws published GENIE estimates for 12 traits spanning body size, blood pressure, lipids, and biomarkers. The same traits appear in every panel; they were selected for illustration, without a significance threshold. Bars show ±2 standard errors. Horizontal scales differ between panels, and negative estimates are retained. These associations do not establish causal effects of the exposures.
The results come from the individual-level GENIE implementation described in Pazokitoroudi et al., AJHG (2024). SUMMIT's summary-based implementation of the one-environment model is described in G×E models; this figure illustrates the published model, not a comparison of the two implementations.
The GENIE result tables
provide the h2gxe and h2gxe.se columns used here. We used all.age.norm.txt
and the all.{smok,sex,statin}.norm.def.txt tables.
From the repository root, with Matplotlib installed:
python example/plot_published_results.pyThis writes PNG and SVG files to example/out/published-results/ using only the
supplied aggregate table. It does not require participant data.