Benford's Law in Python
https://www.youtube.com/watch?v=XXjlR2OK1kM
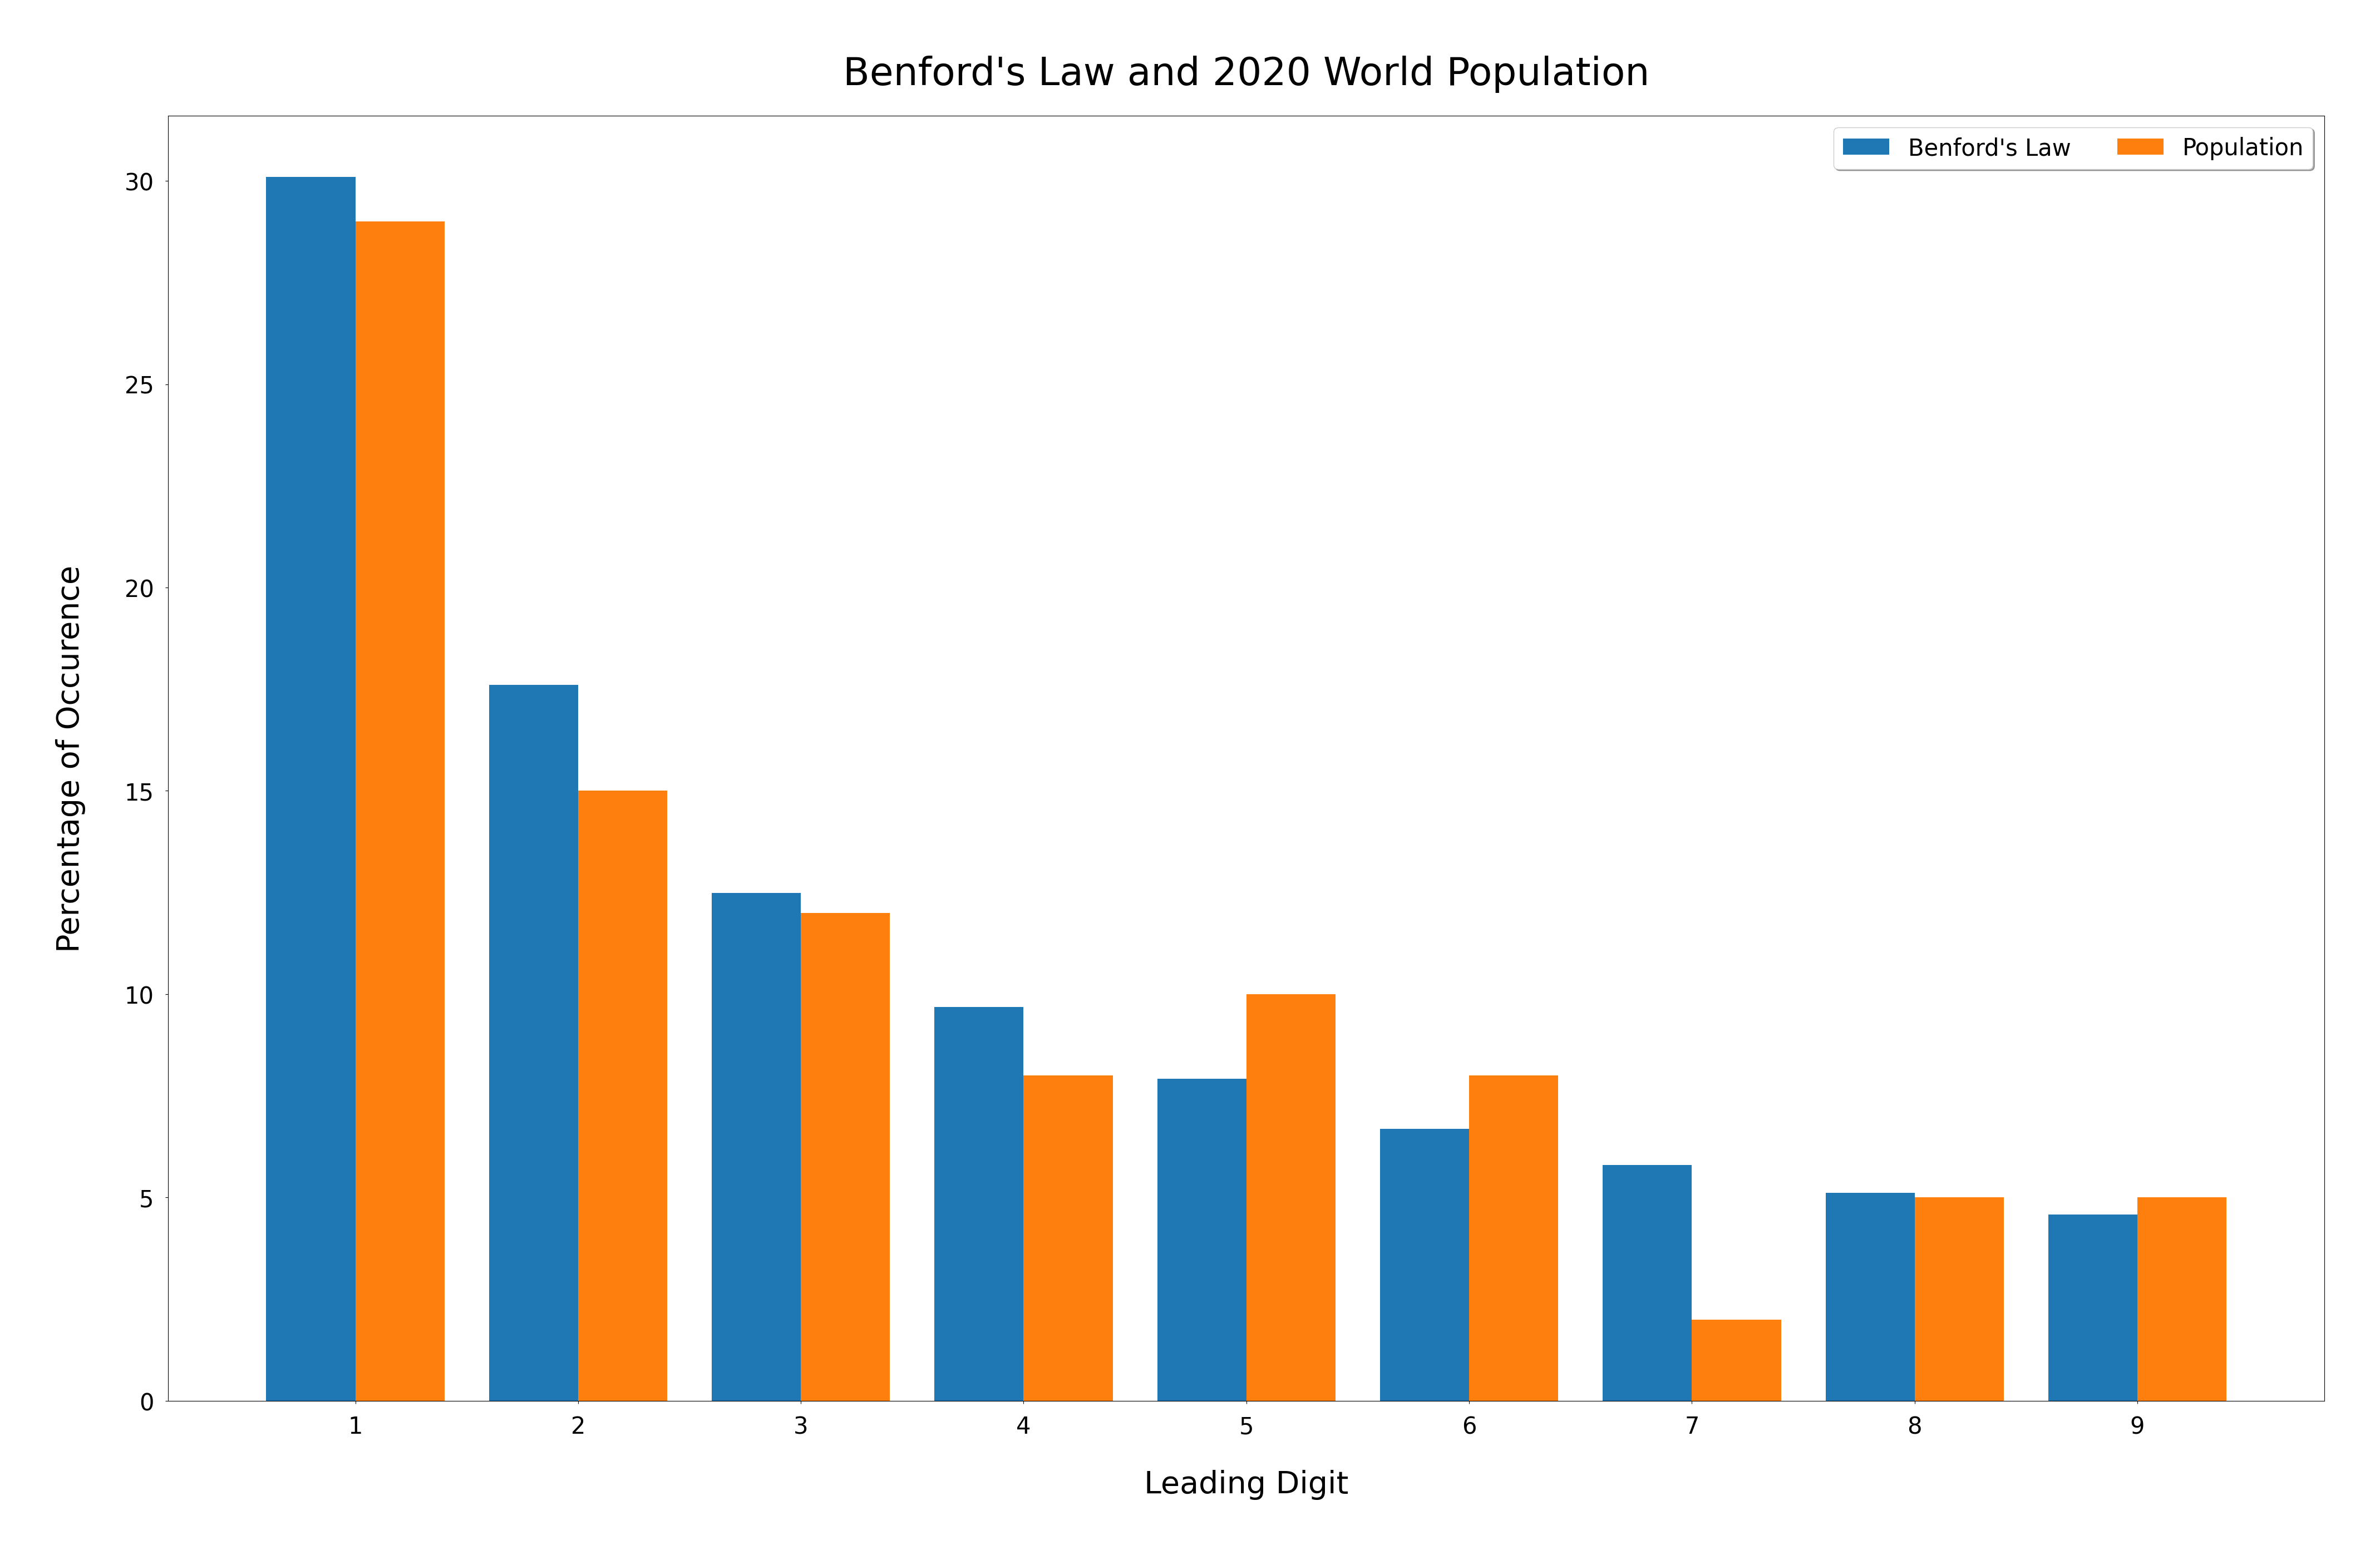
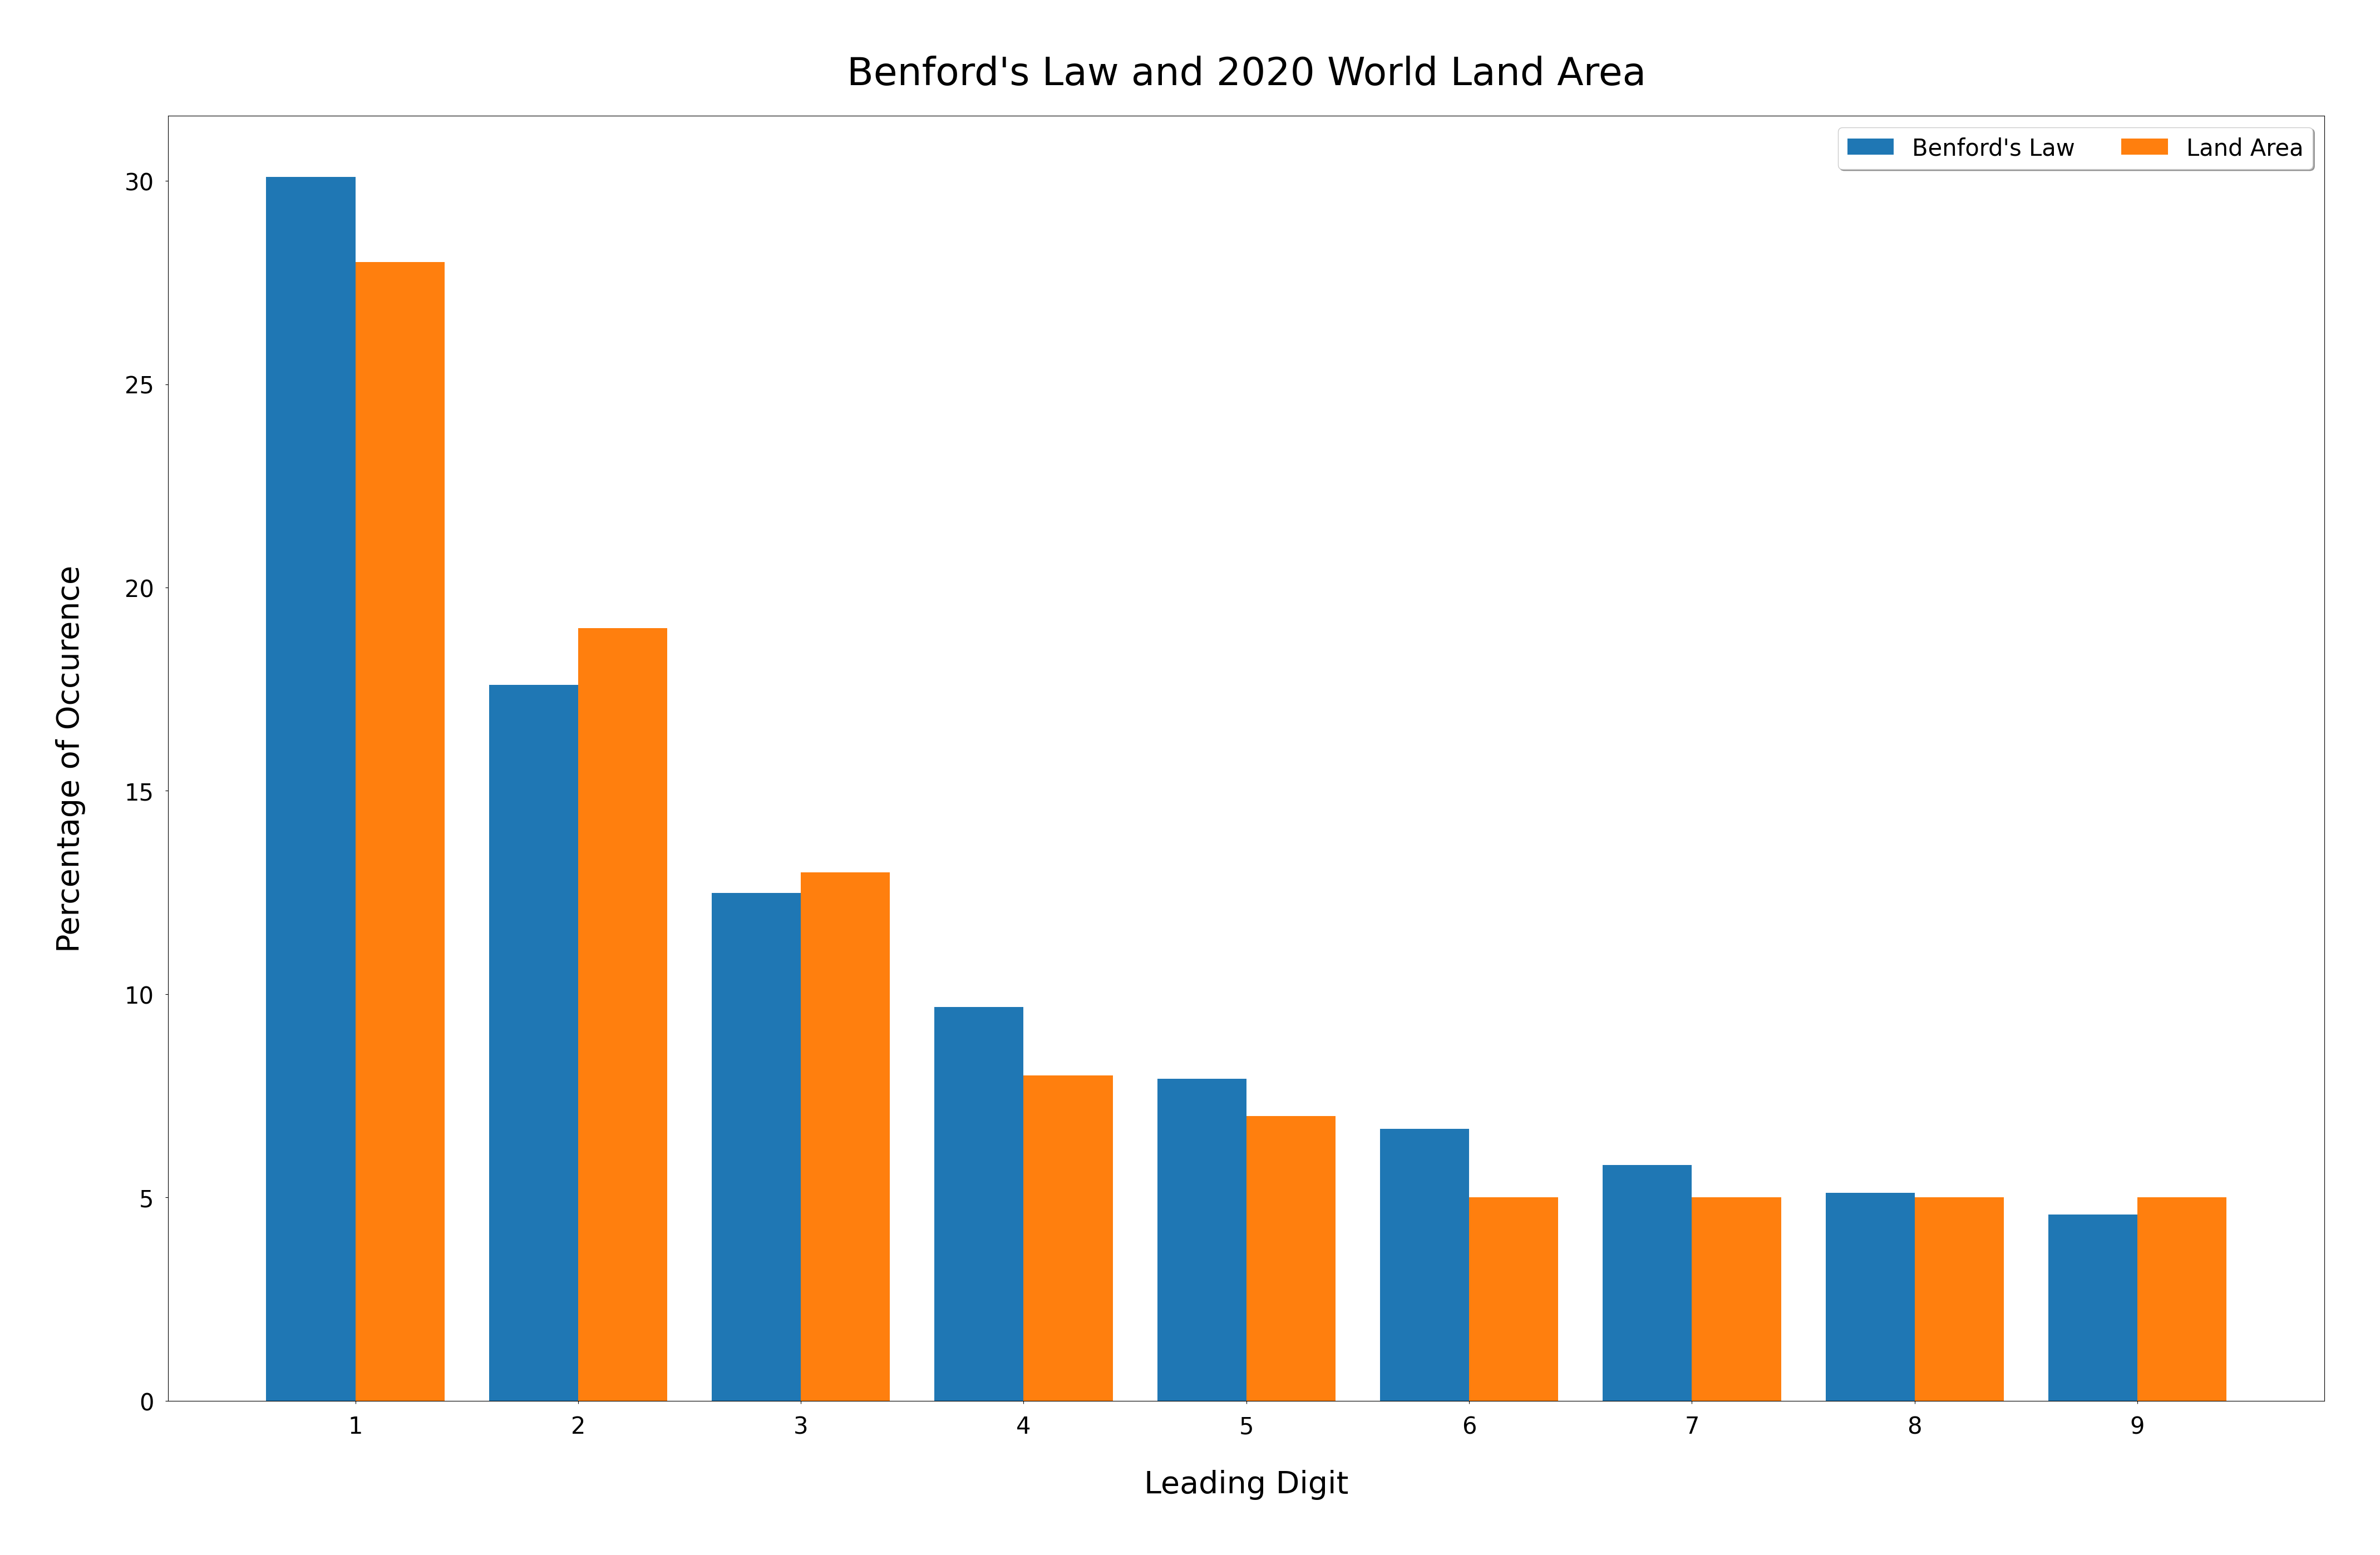
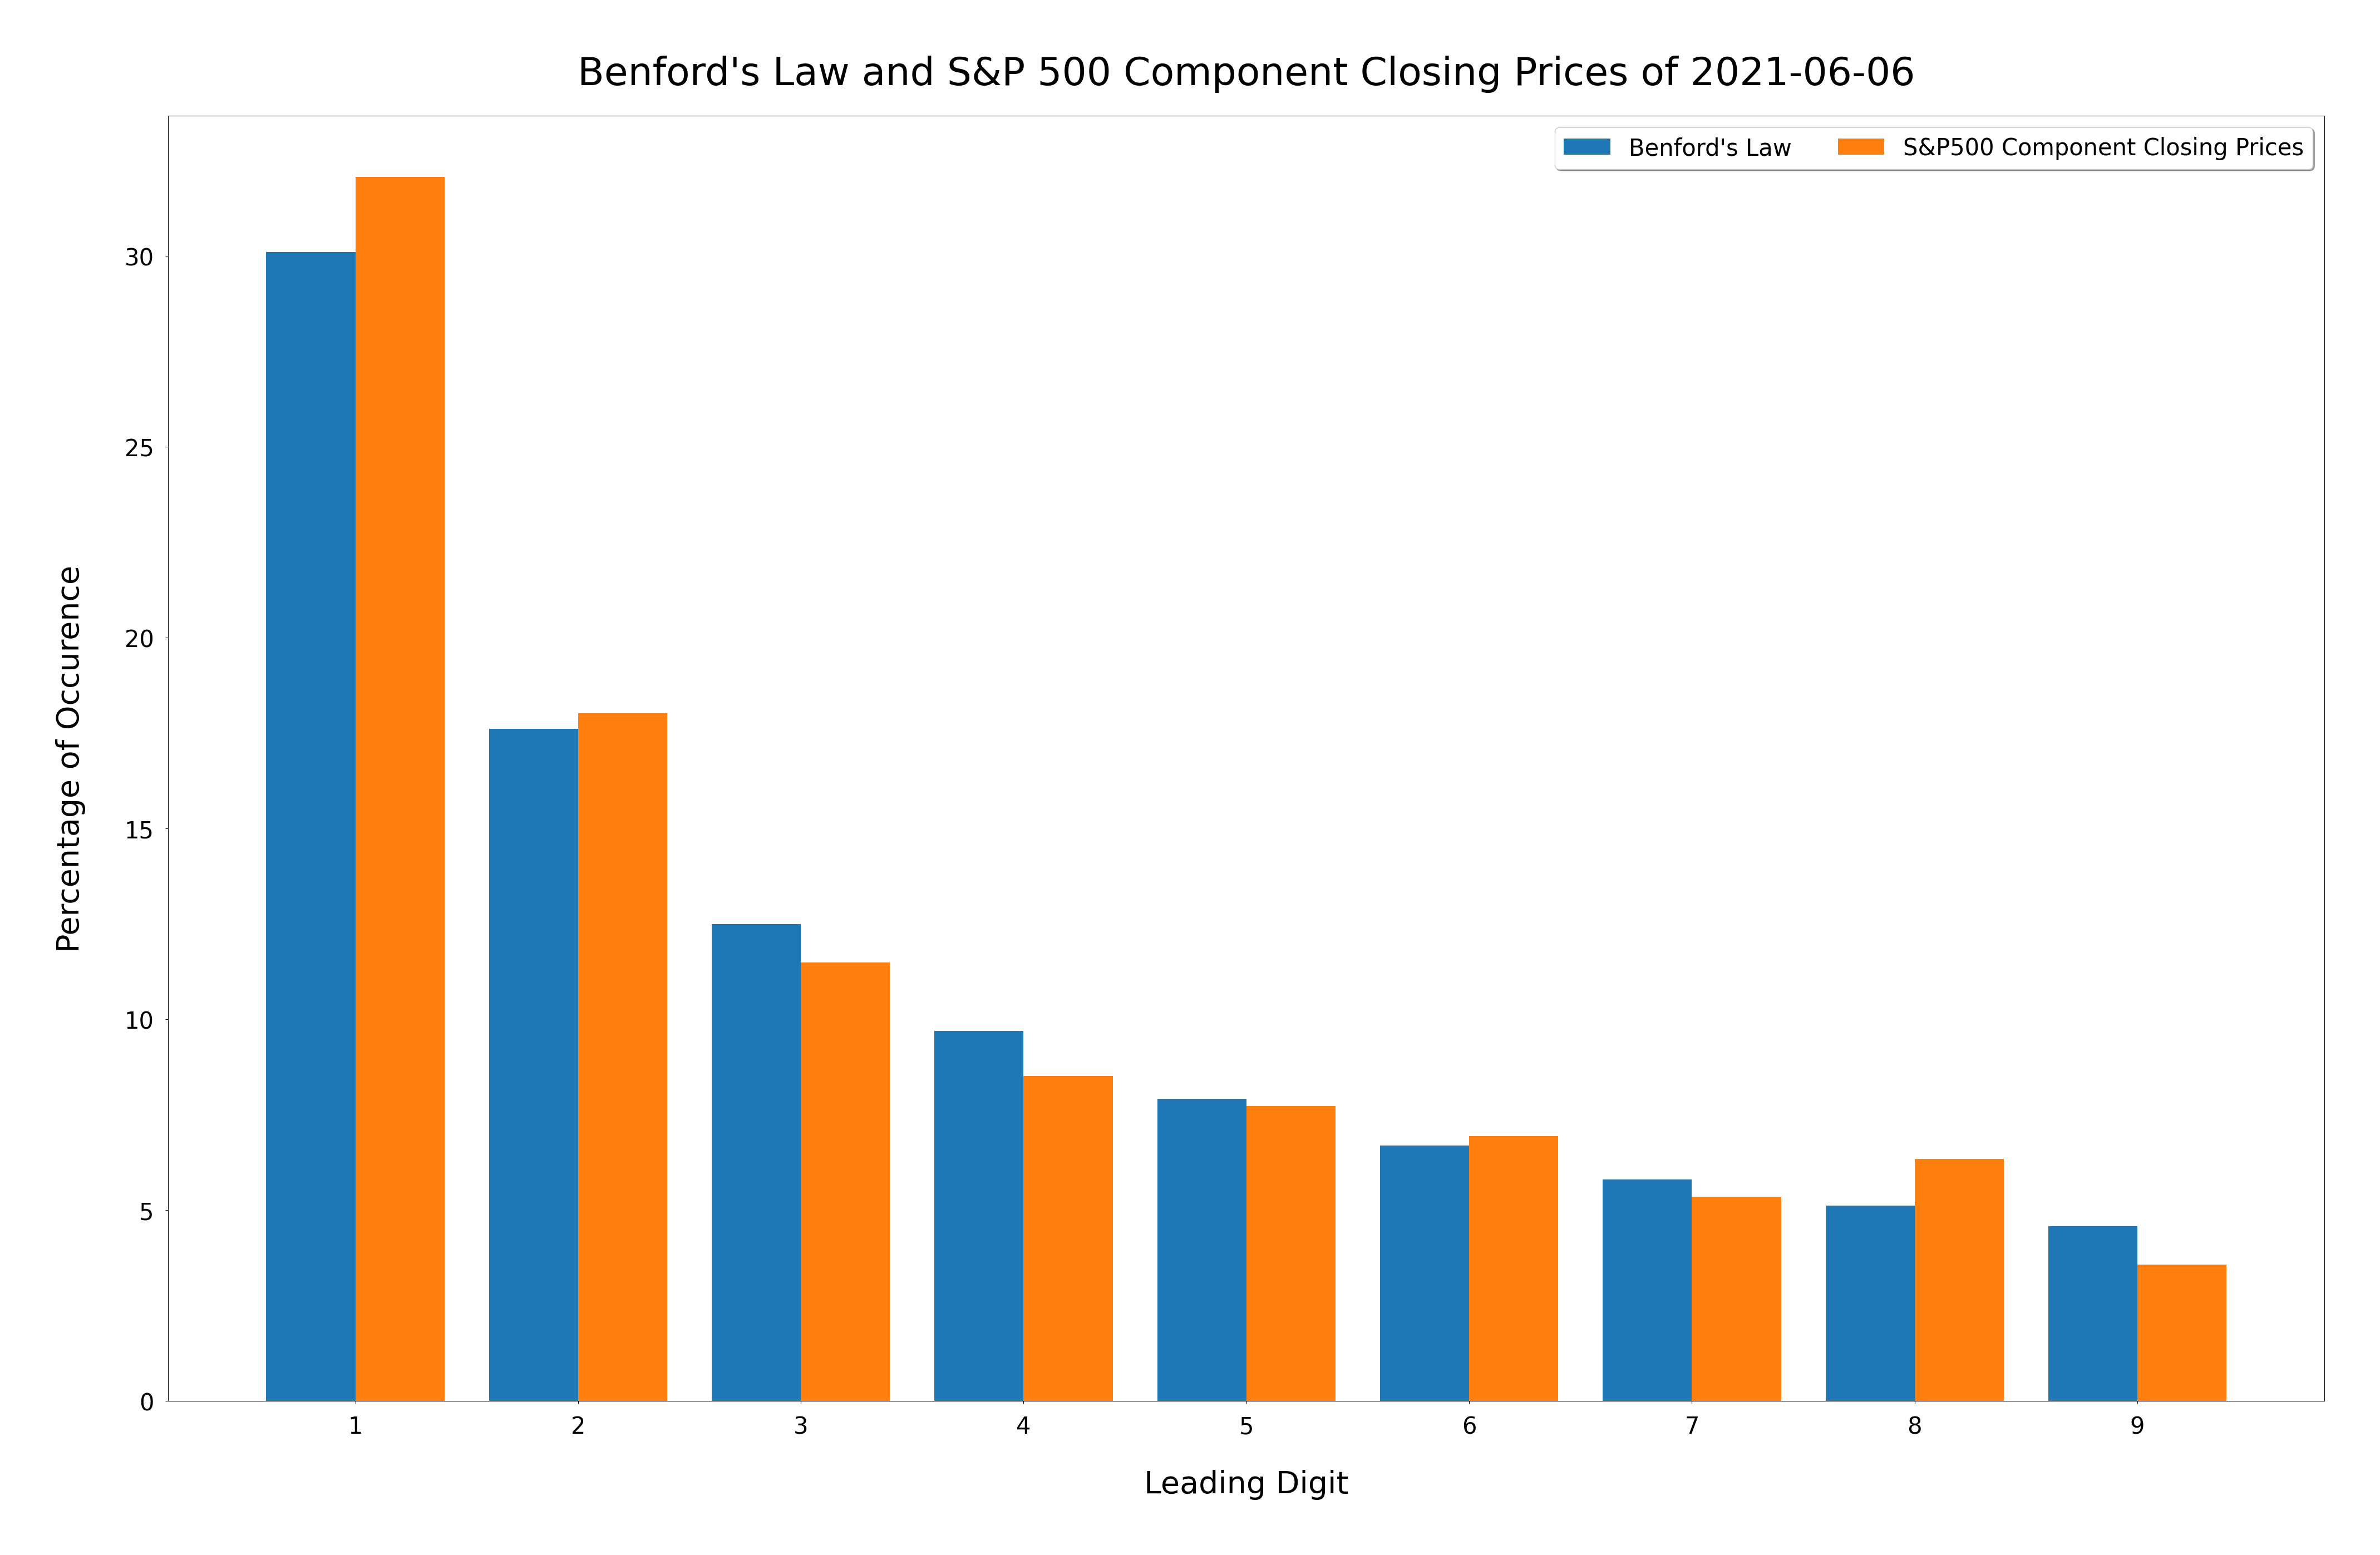
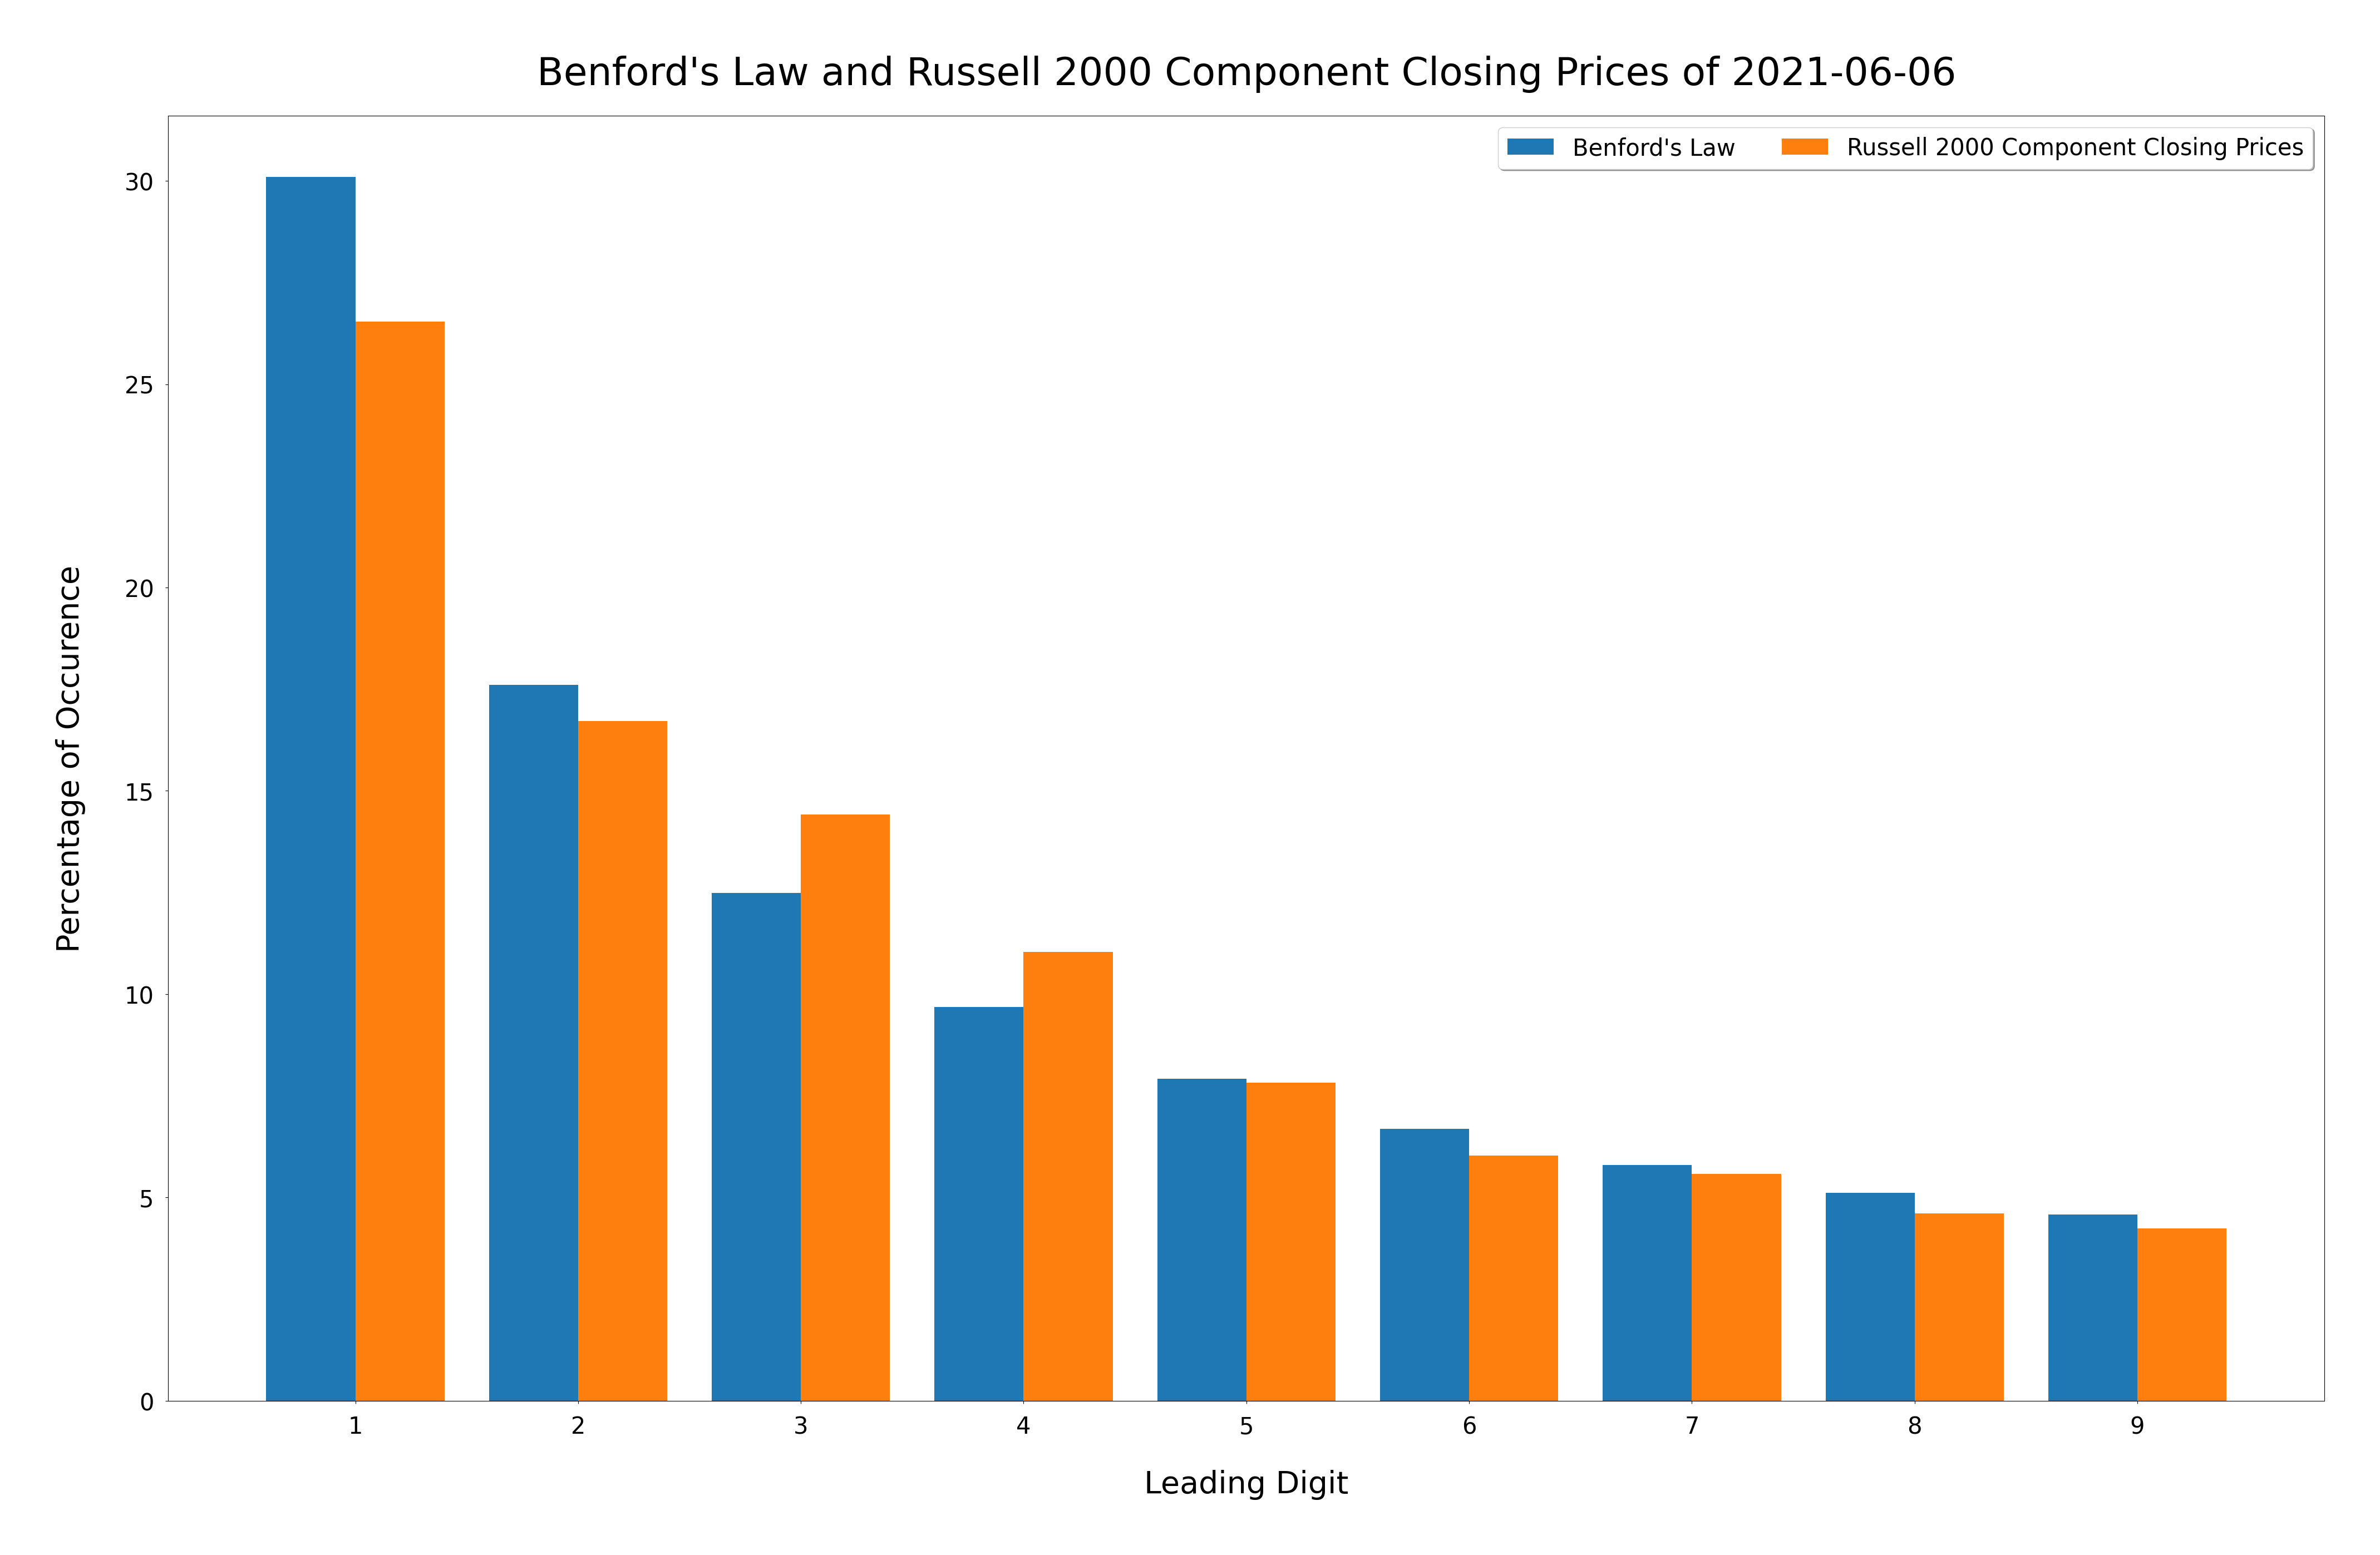
In the file root, there is population.py, s&p500.py, and russell2000.py
These are the files used to generate the plots in the plots folder.
You can access some of the data used to generate these plots in the data folder
To start: Install Pipenv and run pipenv install
After that run one of the afformentioned files in the root for whatever projection you want.
For example, if you want a plot of Benford's law in world population data run python3 population.py and check the generated graph in plots/population.png
- yfinance
- matplotlib
- pandas
- numpy