Repository navigation
Browser demo
https://scpi-sim.steitec.net is a small test bench you can drive from your
browser: a Rohde & Schwarz HMP4040 power supply whose outputs feed two
loads and a small board, a Keysight DAQ970A that measures the loads, and a
Rigol DS1054Z oscilloscope. All three are scpi-sim instruments with their profiles
— the same code that pip install scpi-sim gives you, running in the page.
| Area | What it shows |
|---|---|
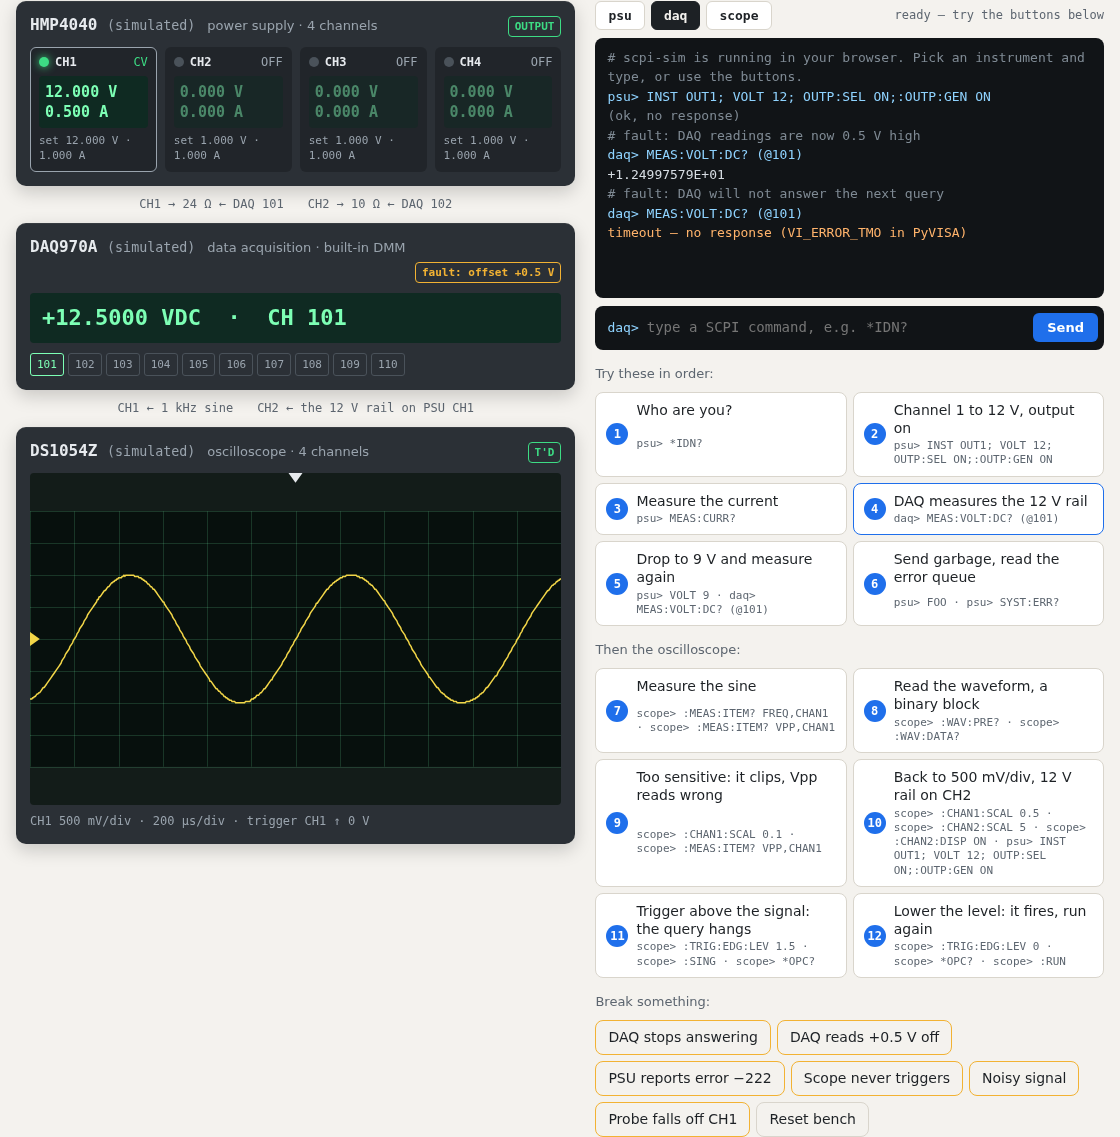
| HMP4040 front (top left) | the four channels: actual voltage and current, the setpoints, CV/CC/OFF, the channel LED and the master OUTPUT button. ERR lights up while the error queue is not empty. |
| Wiring line |
CH1 → 24 Ω ← DAQ 101 and CH2 → 10 Ω ← DAQ 102: channel 1 drives a 24 Ω load that DAQ channel 101 measures, channel 2 a 10 Ω load on channel 102. |
| DAQ970A front (bottom left) | the display of the built-in multimeter (the last reading in VDC or Ω, OVLD when out of range) and the ten relays of the DAQM901A card; the closed relay is highlighted. A yellow badge shows an active fault. |
| DS1054Z front (below it) | the oscilloscope's screen, drawn from the simulator's own samples and redrawn while the scope runs: CH1 sees a 1 kHz sine, CH2 the 12 V rail. The bands above and below the eight divisions are the headroom a real screen hides but the data has. The badge shows T'D, AUTO, WAIT or STOP, the line below the scales and the trigger. The arrow on the left marks the trigger level, the one on top the trigger moment. |
| Terminal (right) | pick psu, daq or scope and type any SCPI command. Commands are blue, answers white, comments (#) grey, timeouts orange. ↑/↓ recall earlier commands and keep a half-typed line. The terminal echoes each line as the instrument got it (at most 256 characters, no control characters). |
| Try these in order, Then the oscilloscope | twelve buttons that type commands for you (see below). |
| Break something | six faults and a reset (see below). |
Every value on the fronts is read from the simulator after each command; the page itself computes nothing.
| # | Button | Sent | What happens |
|---|---|---|---|
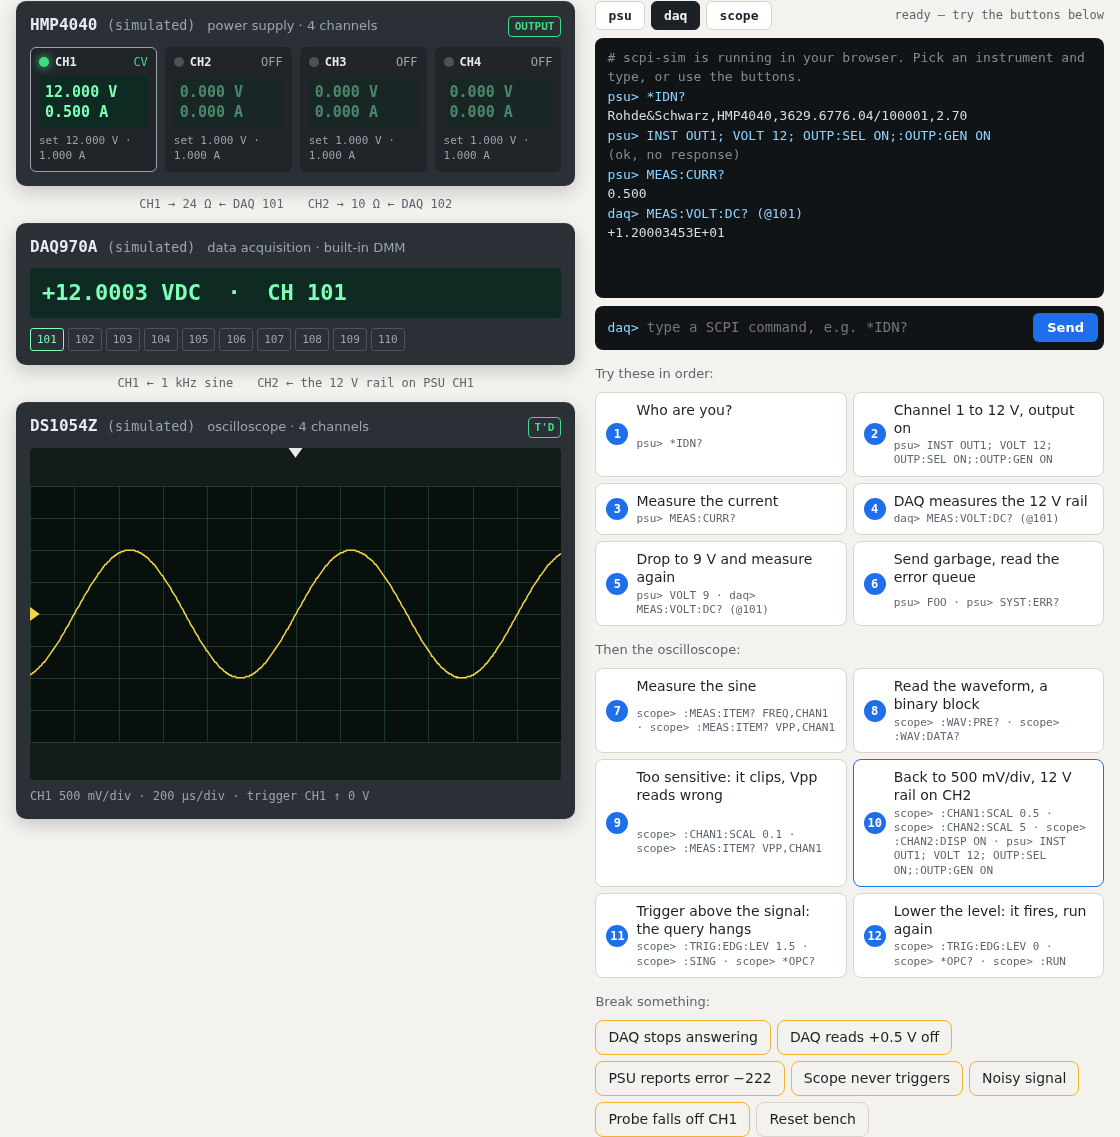
| 1 | Who are you? | psu> *IDN? |
Rohde&Schwarz,HMP4040,3629.6776.04/100001,2.70 — the identity of the real model |
| 2 | Channel 1 to 12 V, output on | psu> INST OUT1; VOLT 12; OUTP:SEL ON;:OUTP:GEN ON |
no answer (it is not a query); CH1 lights up, CV, 12 V. The HMP needs both the channel (OUTP:SEL) and the master switch (OUTP:GEN). |
| 3 | Measure the current | psu> MEAS:CURR? |
0.500 — 12 V into 24 Ω, in the HMP's number format |
| 4 | DAQ measures the 12 V rail | daq> MEAS:VOLT:DC? (@101) |
about +1.19996E+01 — the DAQ closes relay 101 and measures; small noise like a real meter |
| 5 | Drop to 9 V and measure again |
psu> VOLT 9, daq> MEAS:VOLT:DC? (@101)
|
the DAQ now reads about 9 V: the instruments are wired together, so measurements follow what the script switched |
| 6 | Send garbage, read the error queue |
psu> FOO, psu> SYST:ERR?
|
-113,"Undefined header"; ERR lights up until the queue is read |
And the oscilloscope (Oscilloscope has the whole story):
| # | Button | Sent | What happens |
|---|---|---|---|
| 7 | Measure the sine |
scope> :MEAS:ITEM? FREQ,CHAN1, :MEAS:ITEM? VPP,CHAN1
|
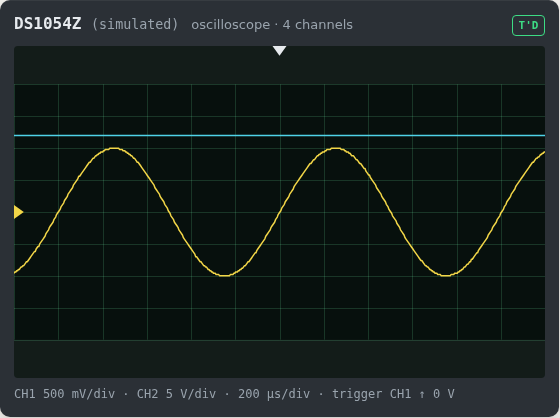
about 1 kHz and 2 V, computed from the samples |
| 8 | Read the waveform, a binary block |
scope> :WAV:PRE?, :WAV:DATA?
|
the scaling, then #9000001200<1200 bytes of binary data>: the terminal shows the block by its size |
| 9 | Too sensitive: it clips, Vpp reads wrong |
scope> :CHAN1:SCAL 0.1, :MEAS:ITEM? VPP,CHAN1
|
the tops are cut off and Vpp reads about 1 V instead of 2 V, with no error anywhere |
| 10 | Back to 500 mV/div, 12 V rail on CH2 |
scope> :CHAN1:SCAL 0.5, :CHAN2:SCAL 5, :CHAN2:DISP ON, psu> INST OUT1; VOLT 12; ...
|
the supply's rail appears as a second trace: the instruments are wired together |
| 11 | Trigger above the signal: the query hangs |
scope> :TRIG:EDG:LEV 1.5, :SING, *OPC?
|
the badge shows WAIT, and after 2 s the terminal shows a timeout |
| 12 | Lower the level: it fires, run again |
scope> :TRIG:EDG:LEV 0, *OPC?, :RUN
|
1, and the scope runs again |
| 13 | Catch a board's power-on: inrush on CH3, 3.3 V rail on CH4 |
psu> INST OUT3; ...; OUTP:SEL OFF, scope> ..., :TRIG:EDG:SOUR CHAN3;:TRIG:EDG:LEV 0.02;:SING, psu> OUTP:SEL ON;:OUTP:GEN ON
|
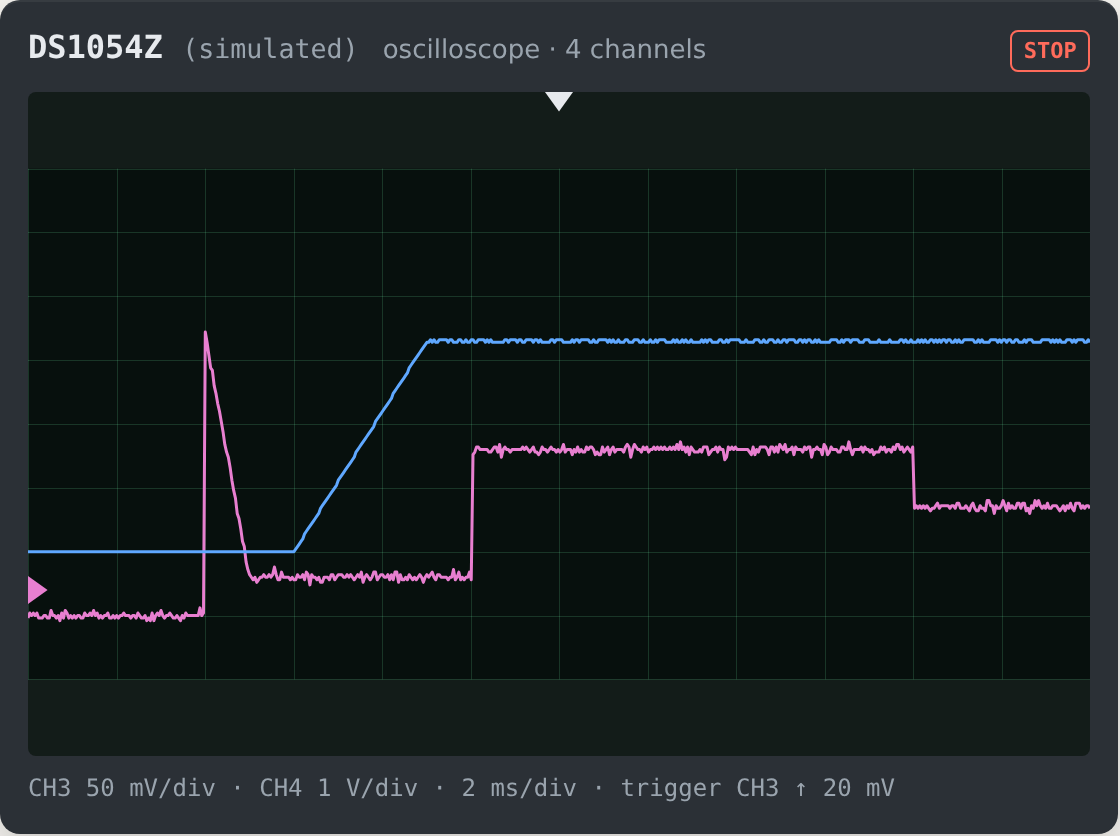
the scope stops with one capture: the inrush peak, a load step when the CPU starts, and the rail coming up 2 ms after power-on |
| 14 | Read the inrush peak (100 mV/A) and the rail |
scope> :MEAS:ITEM? VMAX,CHAN3, :MEAS:ITEM? VMAX,CHAN4
|
about 0.22 V, so 2.2 A, and about 3.3 V |
Typing works too. A few things to try:
-
psu> APPL 5,1afterINST OUT2, thenOUTP:SEL ON— channel 2 into 10 Ω draws 0.5 A. -
psu> CURR 0.2on channel 1 at 12 V: the load wants 0.5 A, so the channel goes into current limit (CC) and the voltage drops to 4.8 V. -
daq> MEAS:VOLT:DC? (@101,102)— both rails in one scan. -
psu> VOLT 40, thenpsu> SYST:ERR?— 40 V is out of range for this model:-222,"Data out of range", and the setpoint stays as it was. -
scope> :TRIG:EDG:SLOP NEGand watch the sine start on its falling edge. -
scope> :TIM:SCAL 0.000001, thenscope> :MEAS:ITEM? FREQ,CHAN1: no complete period on the screen, so9.900000e+37, the manual's "no result". -
scope> :STOP, thenscope> :CHAN1:SCAL 2: the capture on a stopped scope stays as it was. -
psu> meas:curr?works,psu> MEASU:CURR?does not — keywords match in short or long form only, as on real instruments.
These are scpi-sim's fault injection, the feature you use in tests to check that your code copes with misbehaving instruments.
| Button | Fault | What your test code would see |
|---|---|---|
| DAQ stops answering |
no_response, once |
the next query gets no answer; after 2 s the terminal shows timeout – no response (VI_ERROR_TMO in PyVISA). The command itself still ran. |
| DAQ reads +0.5 V off |
offset 0.5 V |
every reading is 0.5 V high — a drifting meter or a bad calibration. A limit check in your test should catch it. |
| PSU reports error −222 | error -222 |
an entry appears in the error queue (ERR lights up) without a command causing it — does your code check SYST:ERR?? |
| Scope never triggers | no_trigger |
Auto sweep runs unsynchronised, the trace wanders and the badge shows AUTO. A :SING would wait for ever. |
| Noisy signal |
noise 0.1 V |
a thick trace, and Vpp reads high |
| Probe falls off CH1 |
signal, 0 V on channel 1 |
a flat line and no frequency any more: does your test notice? |
| Reset bench | — | clears the faults and puts the instruments back to their power-on state |
In your own tests the same faults come from Python
(bench.daq.inject("offset", value=0.5)), from pytest, or from the command
line (scpi-sim fault daq offset value=0.5). Recipes: Fault injection recipes.
The site is static — HTML, CSS, a little JavaScript, and Pyodide (CPython compiled to WebAssembly). When the page loads, it
- starts Pyodide in the browser,
- installs a scpi-sim wheel built from the same release as the PyPI package,
- loads the bench from
examples/profiles/bench.yaml, - sends every command you type to the instrument's
process()method — the same method the TCP, VXI-11 and HiSLIP servers call — and draws the fronts from the returned state.
There are no sockets in the browser, so the demo does not start servers; the
messages go straight to the instrument models. The oscilloscope's screen reads the
latest capture's samples directly, without changing its waveform settings; only
what the demo draws differs from what :WAV:DATA? returns (600 points per trace). That is why delay and
disconnect (faults of a connection) are not among the buttons.
Privacy: there is no backend. Nothing you type leaves your browser; the page sets no cookies and has no tracking. The server only delivers the static files (privacy notice).
First visit: the page downloads the Python runtime (several megabytes), which your browser then caches, so later visits start faster. It needs a browser with WebAssembly, which every current desktop and mobile browser has. If the simulator cannot start, the page shows a picture of the demo and the rest of the page still works. The demo is tested in Chromium and Firefox with Playwright on every change.
pip install scpi-sim pyvisa pyvisa-py
curl -O https://raw.githubusercontent.com/steitec/scpi-sim/main/examples/profiles/bench.yaml
scpi-sim serve --bench bench.yaml
import pyvisa
rm = pyvisa.ResourceManager("@py")
opts = dict(read_termination="\n", write_termination="\n")
psu = rm.open_resource("TCPIP0::127.0.0.1::5025::SOCKET", **opts)
daq = rm.open_resource("TCPIP0::127.0.0.1::5026::SOCKET", **opts)
scope = rm.open_resource("TCPIP0::127.0.0.1::5027::SOCKET", **opts)
print(psu.query("*IDN?"))
psu.write("INST OUT1; VOLT 12; OUTP:SEL ON;:OUTP:GEN ON")
print(psu.query("MEAS:CURR?")) # 0.500
print(daq.query("MEAS:VOLT:DC? (@101)")) # about +1.2E+01
scope.write(":TIM:SCAL 0.0002")
print(scope.query(":MEAS:ITEM? FREQ,CHAN1")) # about 1.0E+03With scpi-sim serve --hislip --bench bench.yaml the same instruments also
answer on TCPIP0::127.0.0.1::hislip_psu::INSTR — see VXI-11 and HiSLIP.
The demo's source is in
web/ and builds into a
small nginx container:
git clone https://github.com/steitec/scpi-sim.git && cd scpi-sim
docker build -f web/Dockerfile -t scpi-sim-web .
docker run --rm -p 8080:80 scpi-sim-web     # http://localhost:8080
web/README.md describes the build (Pyodide is downloaded once and checked by
SHA-256) and the tests.