Create figures or signal waveforms and plot the data in the time or frequency domains with zoom and rotation features.
This is a web application that is written in Go that makes use of the standard library package http/template to generate the HTML.
The http server is started with "go run plot.go" from the Command Prompt. In a web browser Address bar, enter "http://127.0.0.1:8080/generatedata" or
"http://127.0.0.1:8080/plotdata" to generate or plot data, respectively. For generating data, various figures or signal waveforms can be created. They
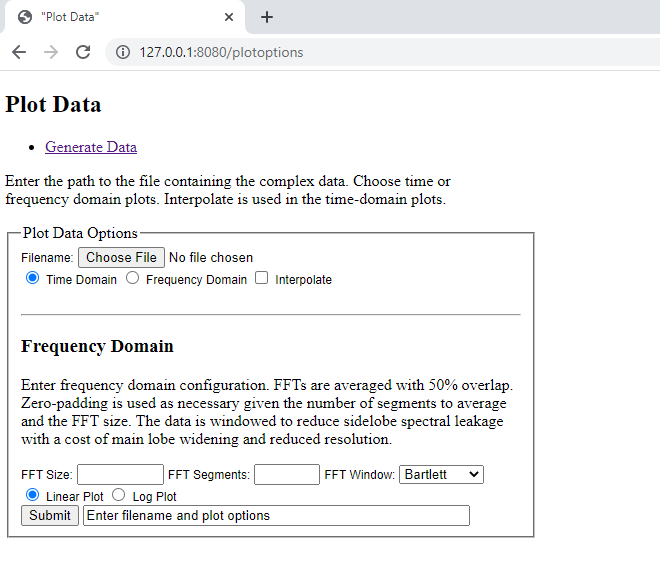
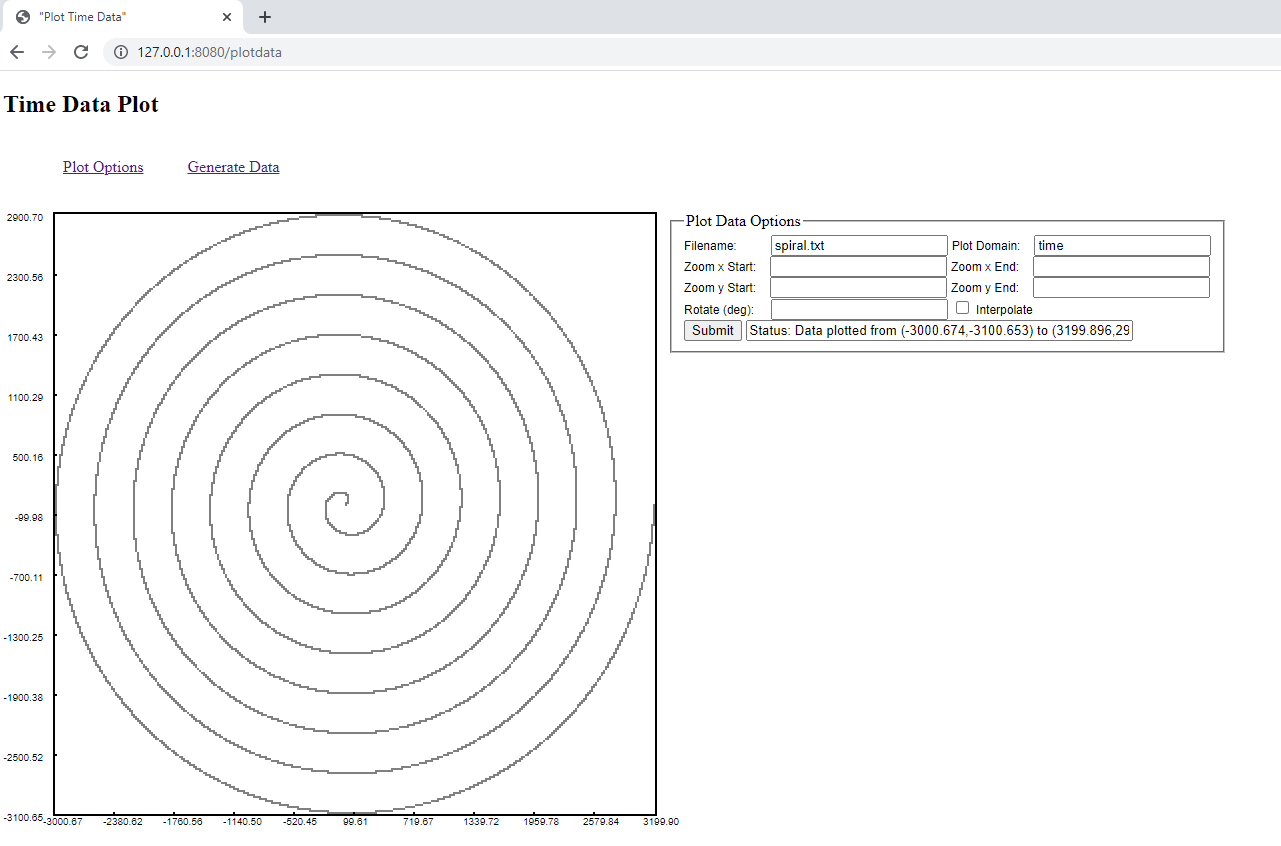
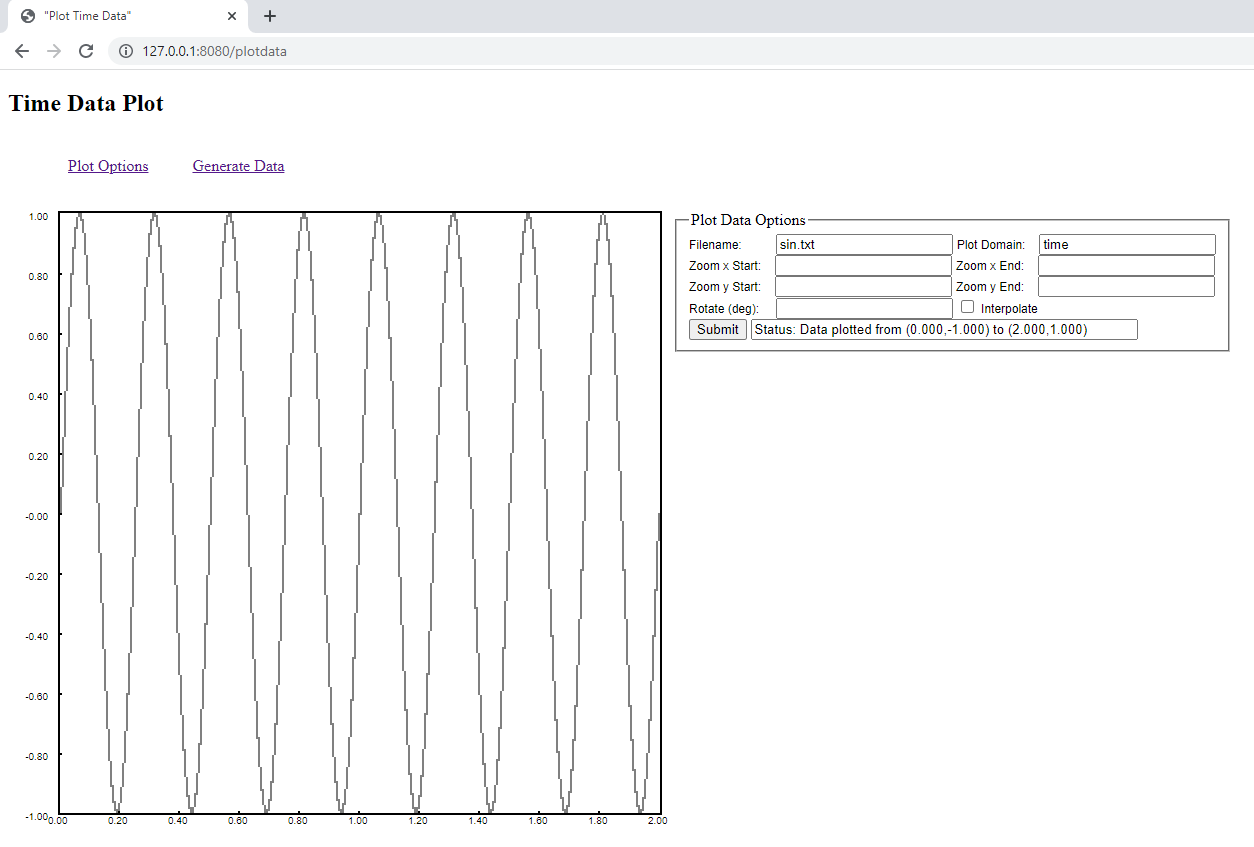
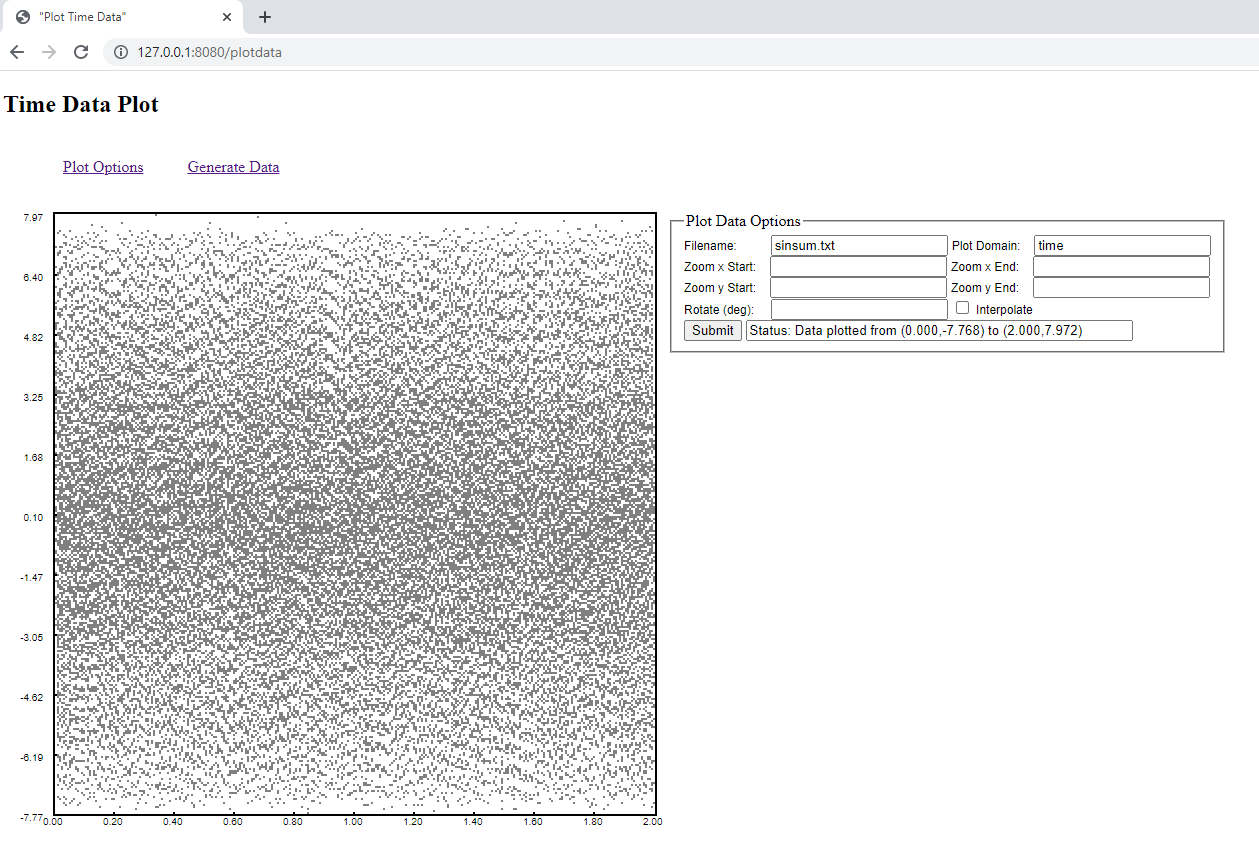
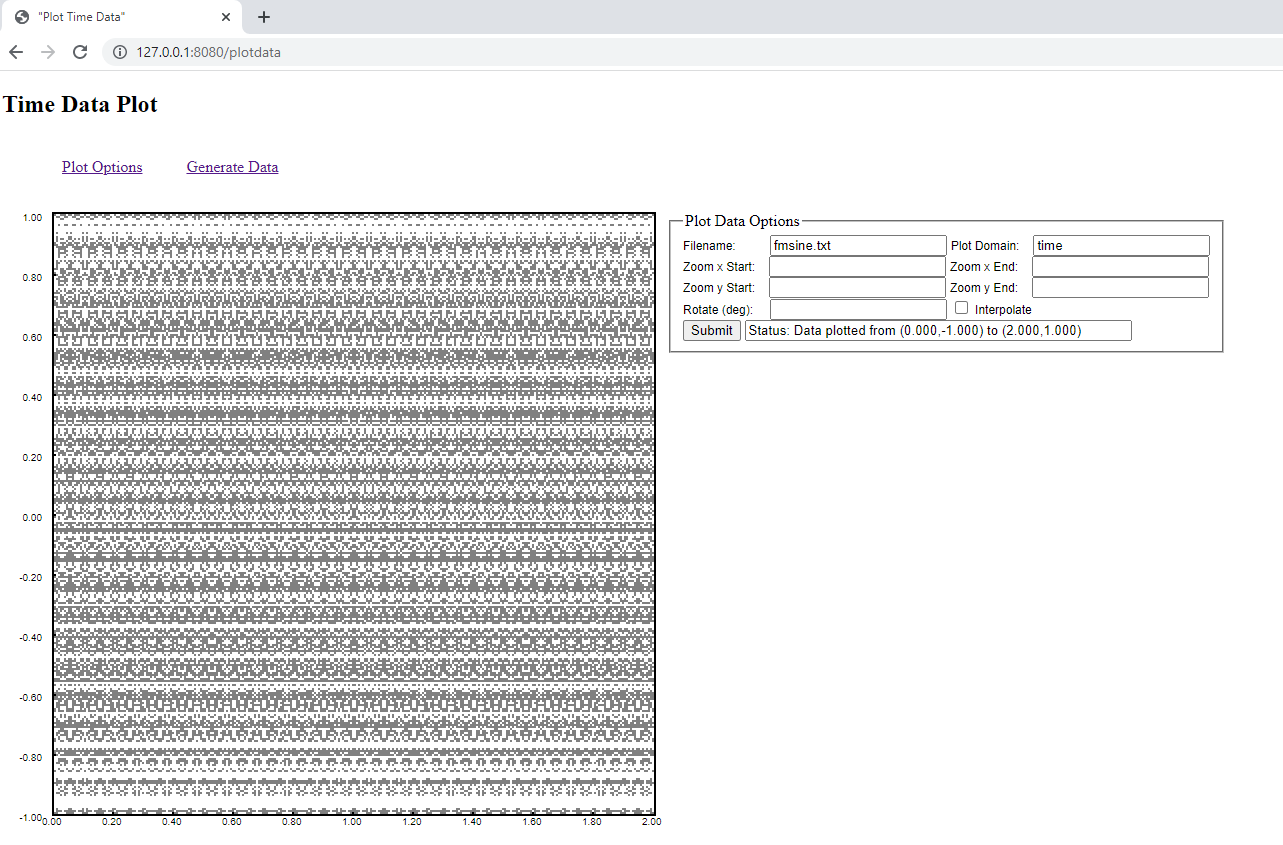
will be saved to a disk file in the data folder. The data can be plotted in the time or frequency domains. For time domain plots, the data can be rotated
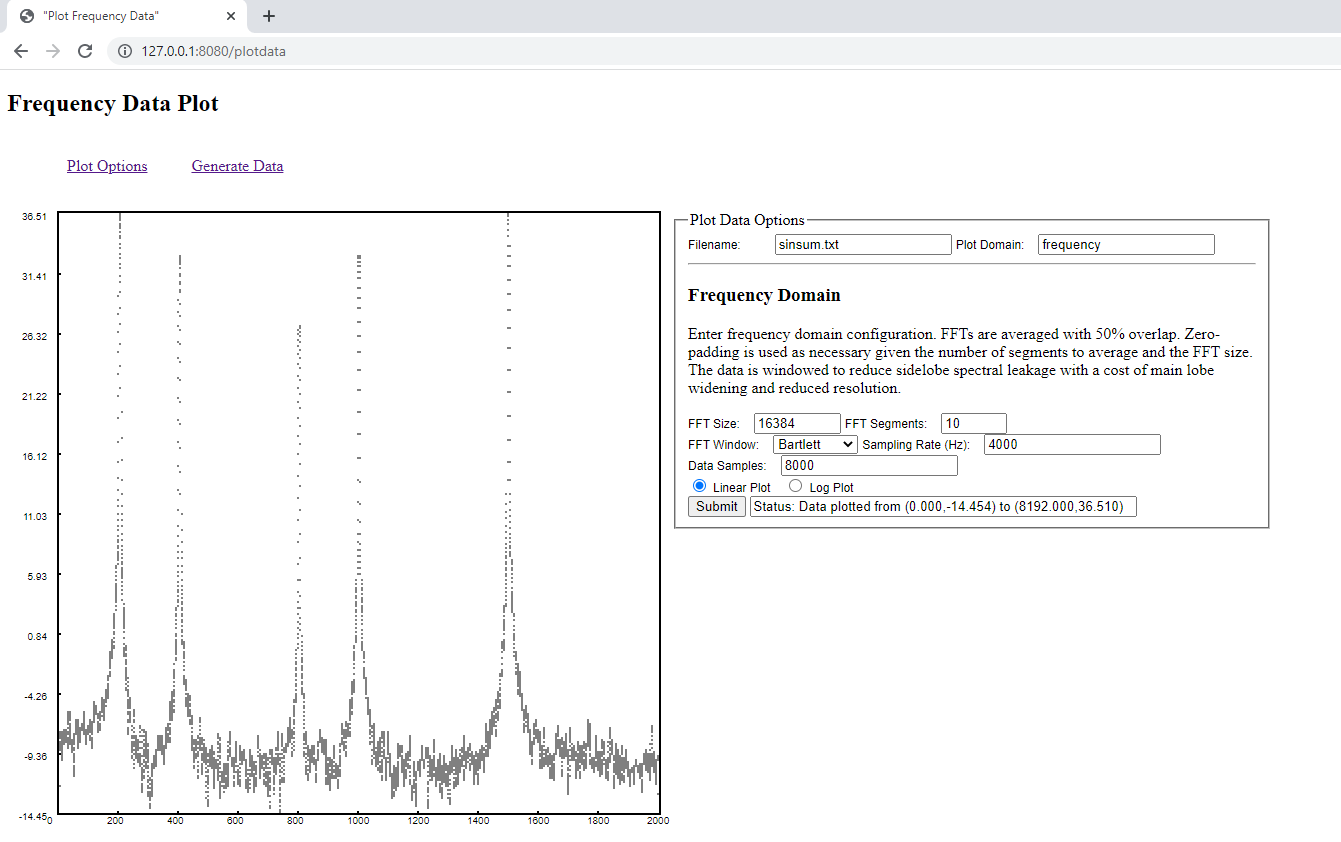
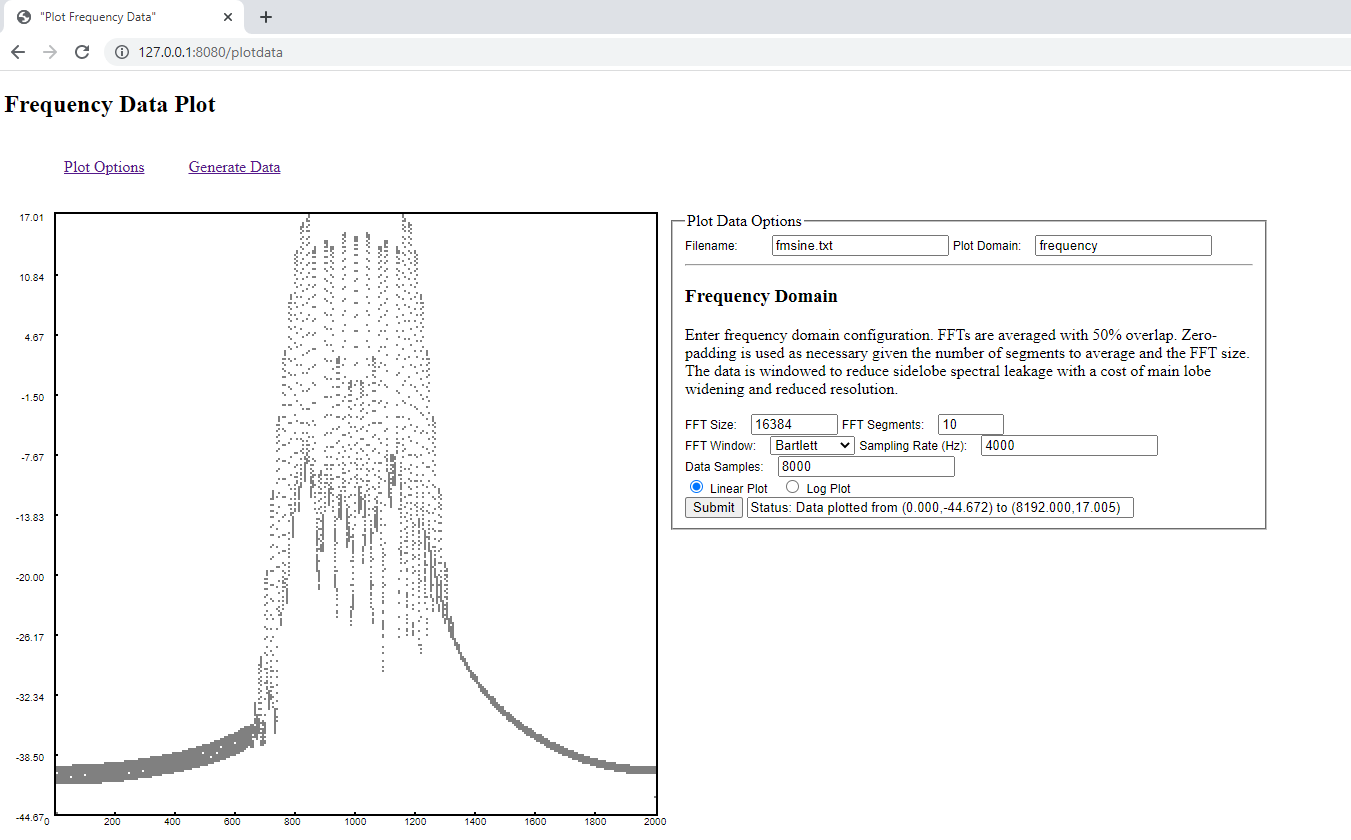
or zoomed into to inspect in detail areas of interest. In the frequency domain, periodograms are averaged with 50% overlapping segments. The data is
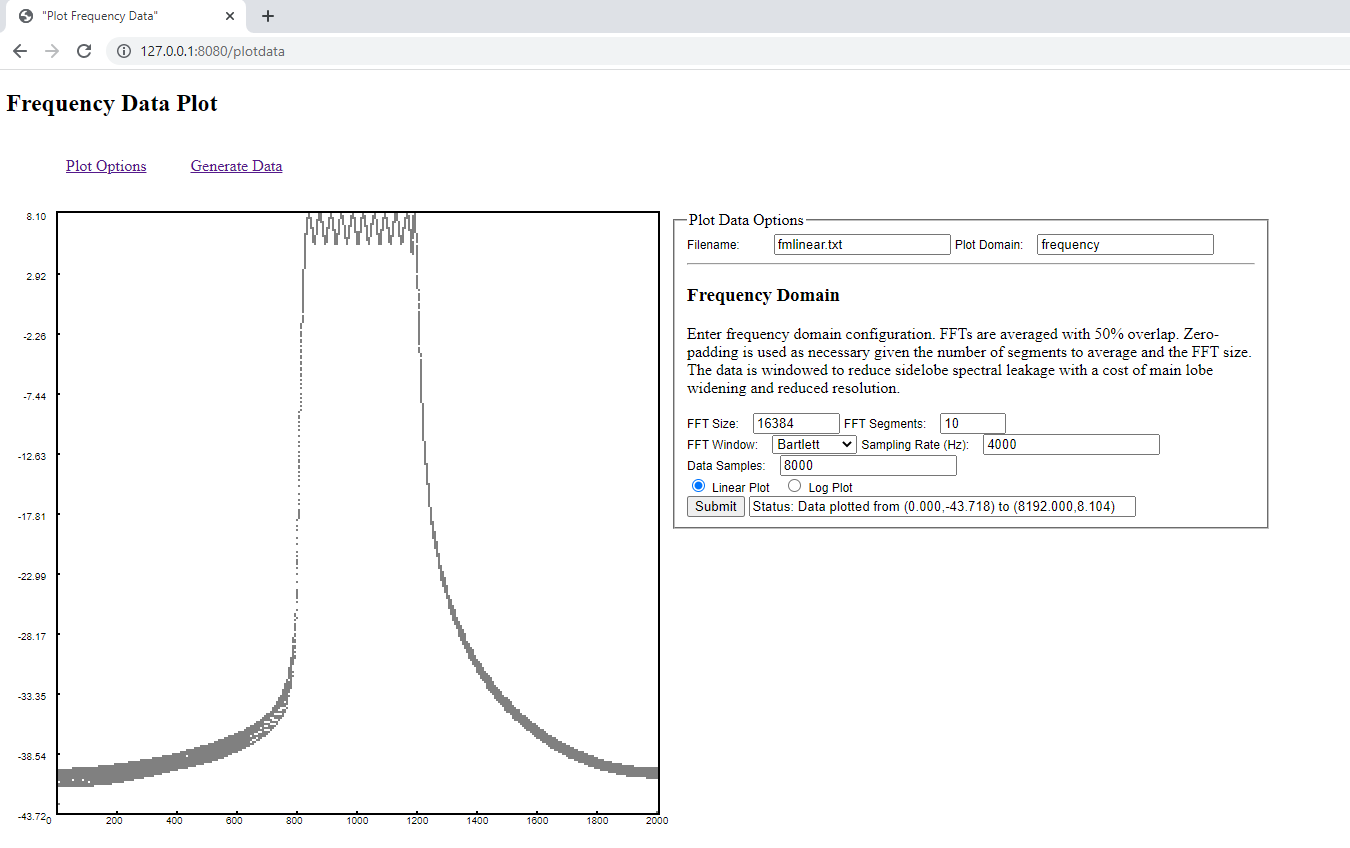
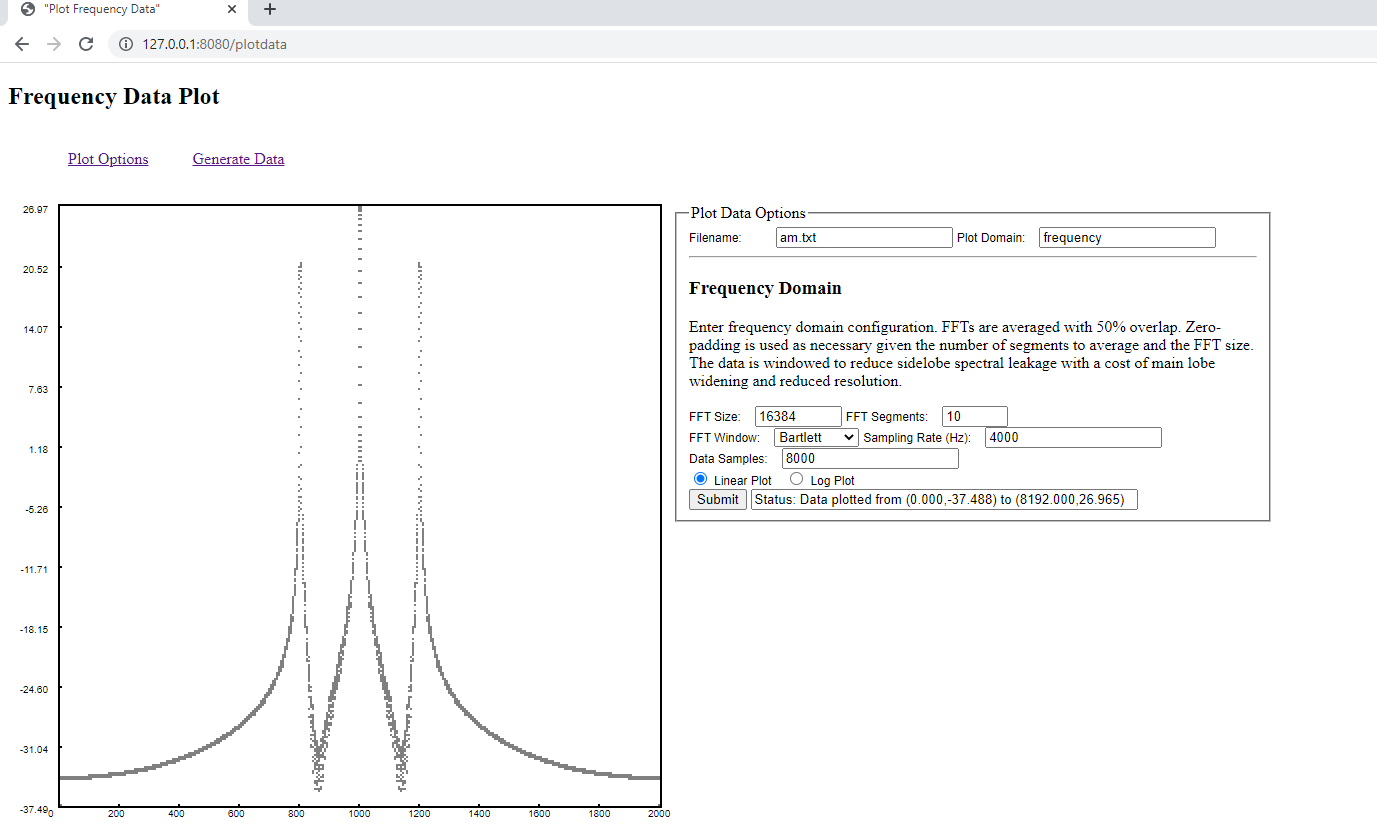
windowed to reduce spectral leakage at a cost of reduced resolution because of the wider window main lobe. The user can select the FFT size, number of
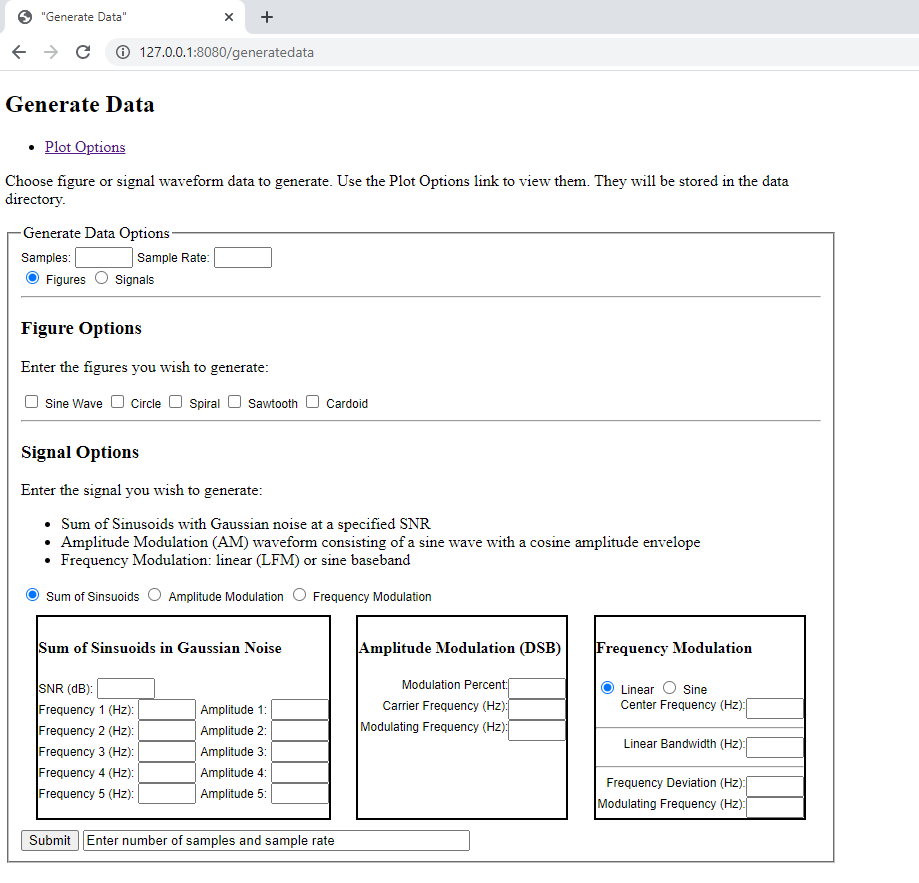
overlapped segments, log or linear plot, and window type. The figures that can be created are a sine, circle, cardoid, sawtooth, and spiral. The signals that
can be created are:
- one to five sinsuoids in Gaussian noise at a specified signal-to-noise ratio (SNR)
- amplitude modulated (AM) waveform with desired center frequency and bandwidth
- frequency modulated (FM) waveform using linear frequency modulation (LFM) or baseband sine at desired center frequency, bandwidth, frequency deviation, or modulating frequency
The user can specify the number of samples and the sampling frequency used to create a figure or signal.