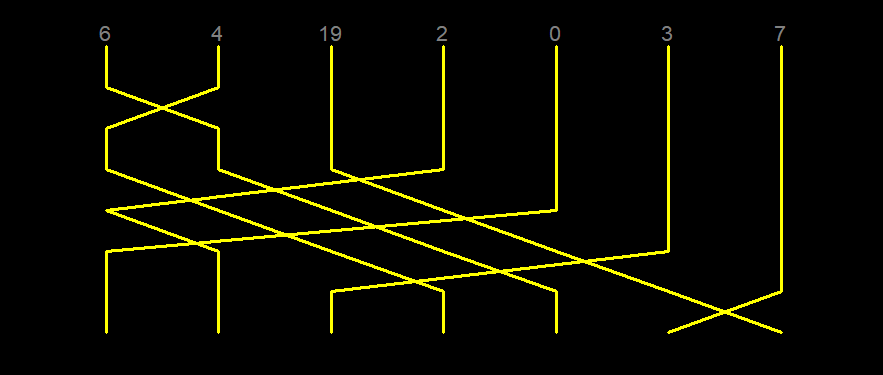
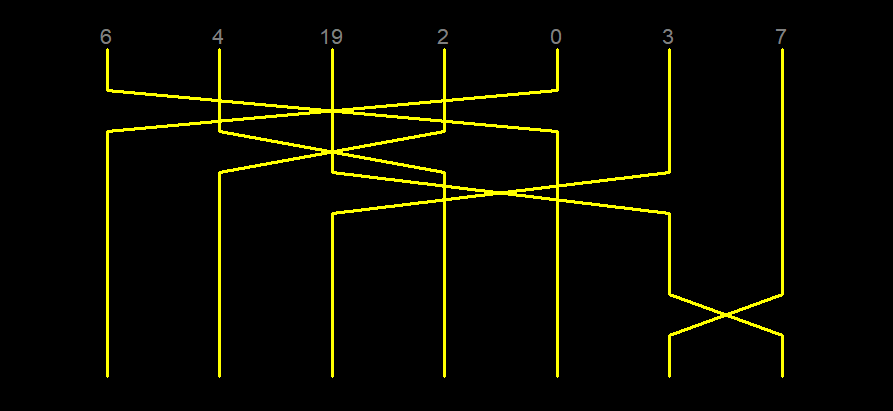
This project allowed me to build upon the basics of my Python knowledge and incorporate the Turtle module. The program takes a list of items and graphically displays each items change of index and progression through the sorting algorithm in the form of a vertical line that can take discrete positions.
- Maintain and expand my knowledge of Python
- Expand my knowledge of the Python turtle module through practical use
- How to display a series of drawing changes made together at once using turtle.tracer
- Arrived independently at a method of converting list index positions and pass numbers to coordnates on a screen using multiplier constants

Run sorting_algorithm_visualiser.py to start the program. You will be prompted to enter a series of integers sepearated by any non-digit character. Then you will be prompted to enter your chosen algorithm.
A setup function displays each item in the list, with an initial vertical line to create a starting point for each line. Bubble sort, insertion sort and selection sort are currently implemented to sort the list. Each time a pass is made, a showPass function is called to display the changes for each item in that particular pass. If a particular item hasn't changed position, that items line is continued vertically. If an item has changed position, that items line moves diagonally to its new ordered position.
This project was heavily inspired by the cover art of Algorithms to Live By by Brian Christian and Tom Griffiths.