It is a powerful, flexible, easy to use open source data analysis and manipulation tool.

In the data is mostly in tabular, database, json
- Explore
- Clean
- Process
It supports many formats. Eg. (excel, csv, sql, json)
- For read prefix = “read_*”
- For write prefix = “to_*”
For plotting the data (scatter, lin, pie, etc) one can use the power of matplotlib, seaborn, plotly.
- Reshape
- Create new column
- Calculate summary
- Combine multiple table
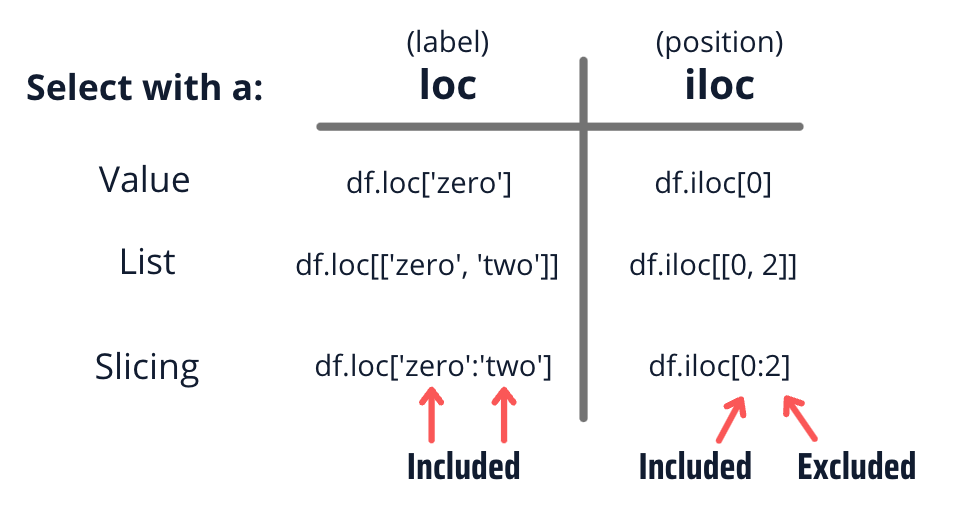
- Select subset
- Loc one needs to specify the name of the column and rows. Many operations can be performed on loc.
- iLoc one needs to specify the index of the column and row.
- Series (1-D)
- Dataframe (2-D)
- Panel (3-D)

On dropping rows, the value of the index will not adjust automatically. Therefore, use reset_index but will create a new column having old index values therefore drop=True in order not to make a column. Make use of subset in order to drop “na” for a particular column.
(inplace = True): will make sure that the method does NOT return a new DataFrame, but it will remove all duplicates from the original DataFrameto_: prefix in order to convert type of data column to other type.corr(): to find the correlation in the data.- Both isna() and isnull() functions are used to find the missing values in the pandas dataframe. isnull() and isna() literally does the same things. isnull() is just an alias of the isna() method as shown in pandas source code. Missing values are used to denote the values which are null or do not have any actual values.
df.replace: in order to replace the particular value with another.df.pivot_table(): The levels in the pivot table will be stored in MultiIndex objects (hierarchical indexes) on the index and columns of the result DataFrame.level parameter in .sum(): Optional, default None. Specifies which level ( in a hierarchical multi index) to check alongpd.cut(): Use cut when you need to segment and sort data values into bins. This function is also useful for going from a continuous variable to a categorical variable. For example, cut could convert ages to groups of age ranges. Supports binning into an equal number of bins, or a pre-specified array of bins.