
 Catppuccin for Matplotlib



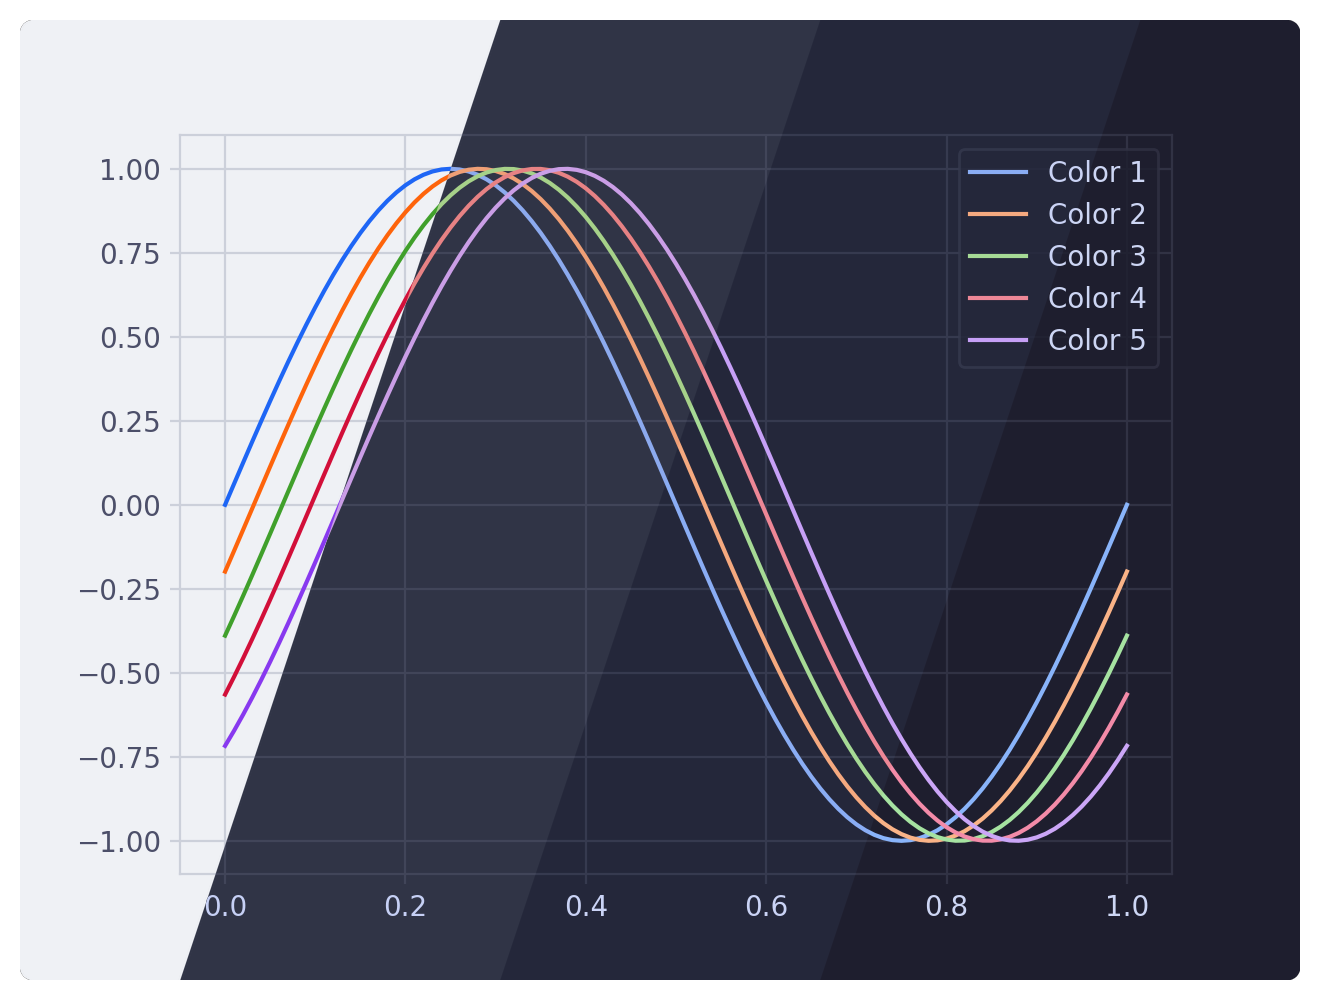
Line plot
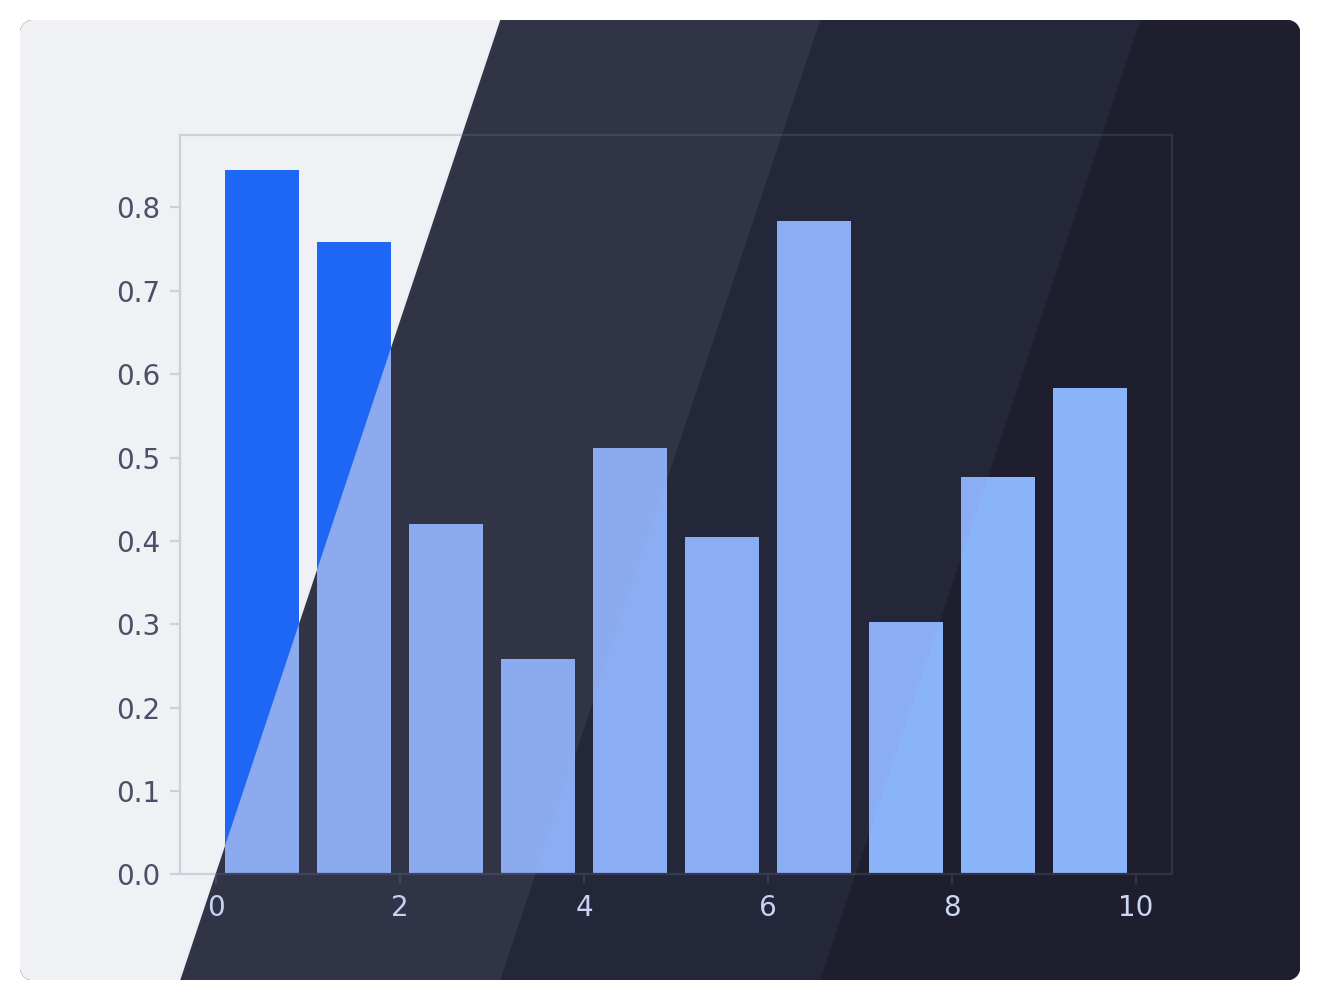
Bar plot
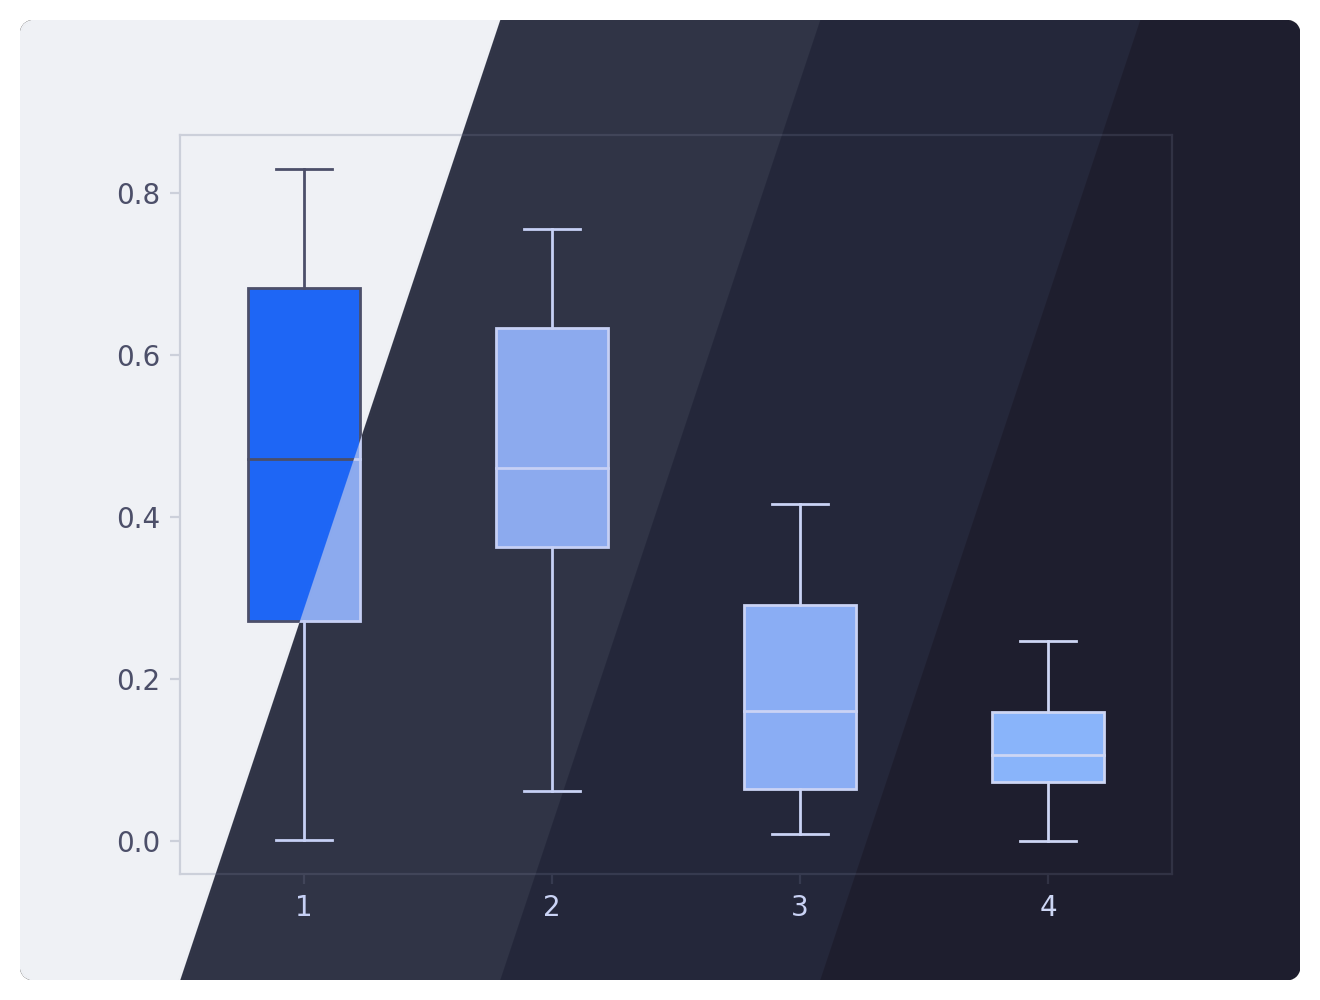
Box plot
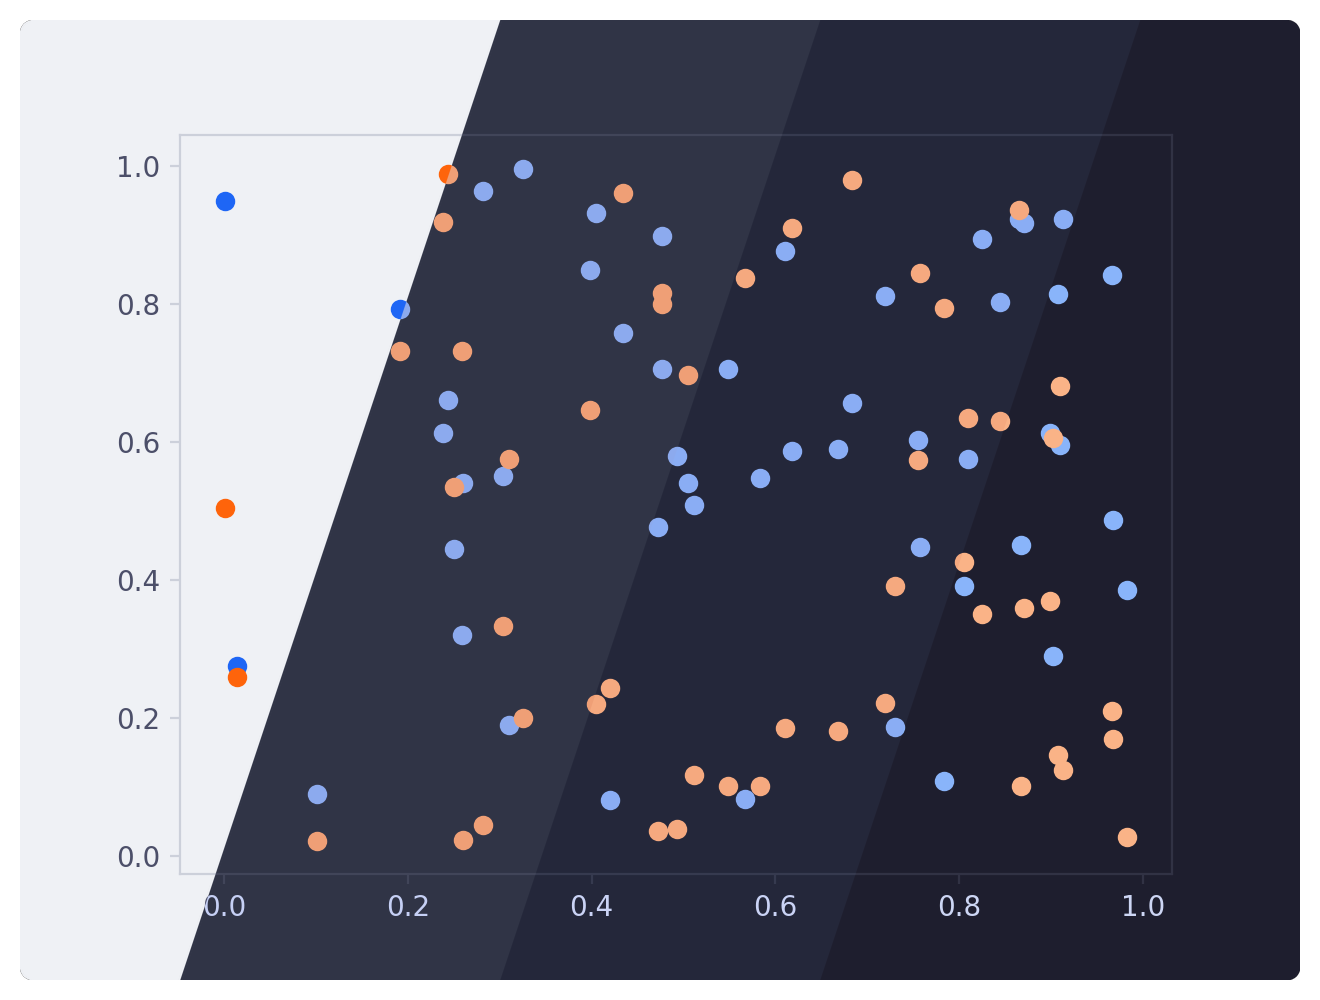
Scatter plot
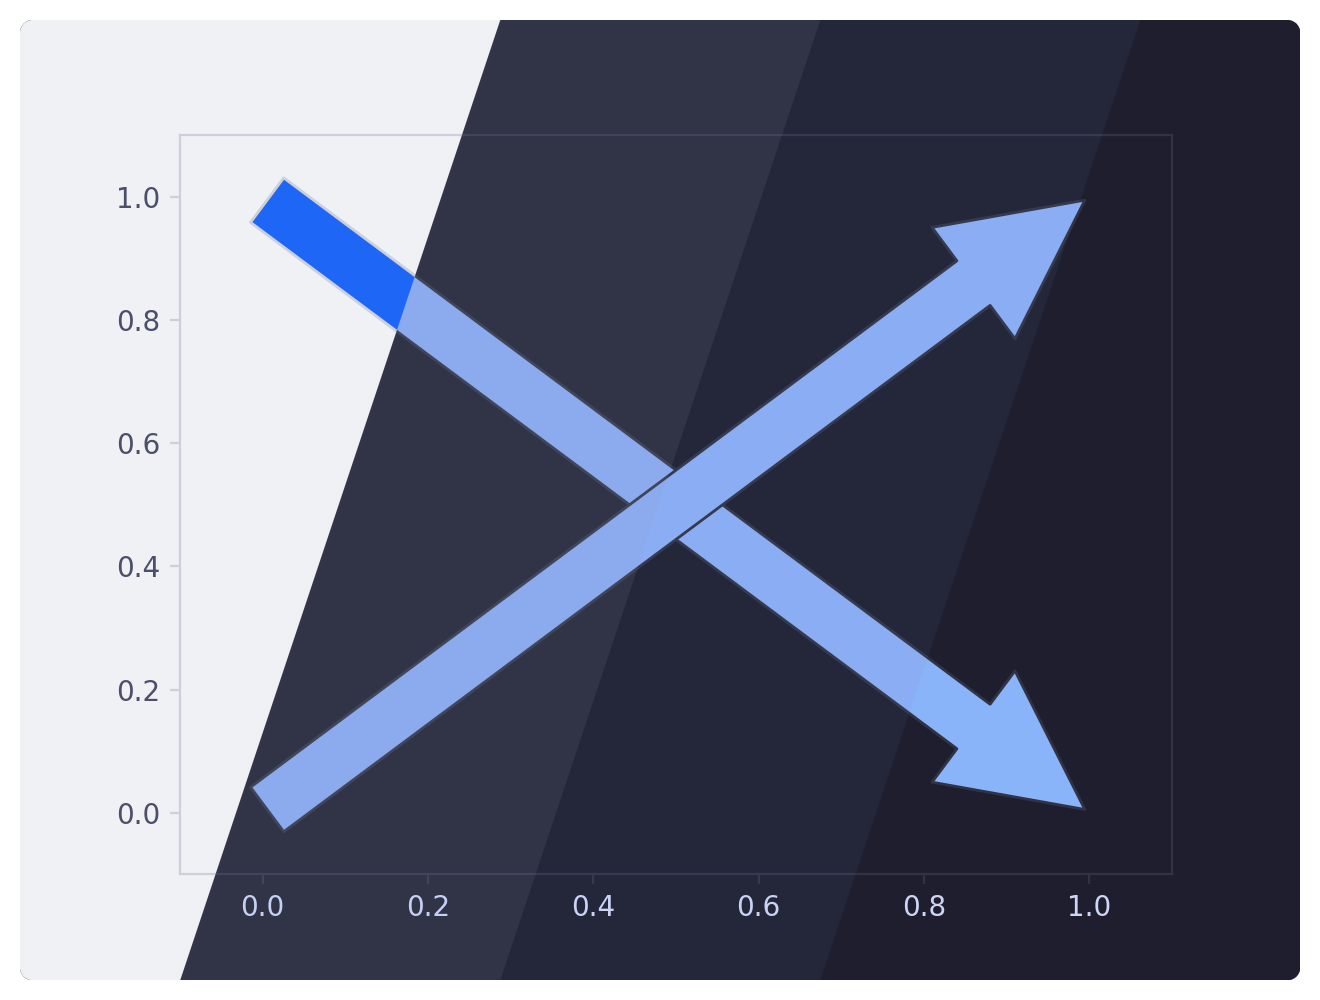
Patches
Colormap

pip install catppuccin-matplotlib- Import the module to register the stylesheets and colormaps
import mplcatppuccin
import matplotlib as mpl
import matplotlib.pyplot as plt

mpl.style.use("mocha")
plt.plot([0,1,2,3], [1,2,3,4])
plt.show()- Mix it with different stylesheets!
mpl.style.use(["ggplot", "mocha"])
plt.plot([0,1,2,3], [1,2,3,4])
plt.show()- Load individual colors
from mplcatppuccin.palette import load_color

color = load_color("mocha", "peach")
plt.plot([0,1,2,3], [1,2,3,4], color=color)
plt.show()- Define custom colormaps
from mplcatppuccin.colormaps import get_colormap_from_list
import numpy as np

cmap = get_colormap_from_list("mocha", ["red", "peach", "yellow", "green"])
data = np.random.randint(10, size=(30, 30))
plt.imshow(cmap, cmap=cmap)
plt.show()

Copyright © 2021-present Catppuccin Org