Comprehensive guide and data-driven analysis of CS2 performance across CPU scheduling, Windows configurations, and graphical settings.
- 🔬 Methodology & Test Environment
- ⚙️ Section 1: CPU Scheduling (Affinity & CPU Sets)
- 🖥️ Section 2: Windows Settings & Optimizations
- 🚀 Section 3: CS2 Launch Options
- 📺 Section 4: Display Modes (Full Screen vs Borderless)
- 📏 Section 5: Resolutions Comparison
- 🛡️ Section 6: FACEIT Anti-Cheat Impact & Optimization
- 🏎️ Section 7: Latency Technologies (Anti-Lag 2.0 & NVIDIA Reflex)
- 📊 Section 8: Graphics Settings Performance Impact
- 🖼️ Section 9: Visual Comparison & Visibility Guide
- 🏆 Section 10: Summary & Recommended Settings
- Testing Period: 17.04.2026 – 22.04.2026
- Game Version: Includes Animgraph Update (21.04.2026)
Important
Update Note (21.04.2026): > The recent CS2 Animgraph Update does not affect the core optimization methods provided in this repository.
Internal Testing Observations:
- Optimization logic remains fully valid.
- The update itself introduces minor improvements to 1% and 0.1% low FPS.
- Average FPS remains within the margin of error compared to pre-patch results.
The benchmarks were conducted in a strictly controlled environment to ensure repeatability.
- Isolation: Only Steam (Offline Mode), CapFrameX (Capture Tool), and Process Core Optimizer were active in the background.
- Procedure: Each test case consists of 3 identical benchmark runs to calculate a reliable average.
- Launch Options:
-allow_third_party_software(strictly required for CapFrameX hooking). No other parameters were used. - Thread Scheduling: All core affinity and CPU Sets modifications were handled exclusively via Process Core Optimizer.
- Software Disclaimer: This is a hobbyist project. Professional alternatives like Process Lasso can achieve similar results.
All testing runs were automated using CS2-consistent-benchmarking-tool AutoHotkey script, executed on the CS2 FPS Benchmark workshop map.
📊 Data Extraction (CapFrameX): All exact performance metrics—including Average FPS, 1% Lows, 0.1% Lows, and precise frametime variances—were captured and extracted exclusively using CapFrameX reports.
💡 Why this specific tool and method? As most CS2 players are aware, workshop benchmarks do not show the exact FPS you can expect in real competitive 5v5 matches (generally, workshop benchmark results are higher than those seen in Premier or FACEIT).
However, the primary goal of this testing methodology is consistency. By using this specific closed-environment workshop map combined with the AutoHotkey script and CapFrameX, we achieve highly reproducible performance results with almost zero run-to-run variance. This strict consistency is absolutely crucial for accurately evaluating which graphics settings, Windows tweaks, or hardware changes actually improve performance, allowing for precise and effective game optimization.
- CPU: AMD Ryzen 7 7800X3D
- Cooling: DARKFLASH Twister DX-360 V2.6 ARGB
- GPU: ASRock Radeon RX 9070 XT Steel Legend 16 GB
- RAM: ADATA XPG Lancer Blade RGB 32GB (2x16GB) DDR5 6000MT/s CL30
- Storage: WD Blue SN580 2TB SSD
- PSU: MSI MAG A850GL 850W 80 Plus Gold
- OS: Windows 11 Pro (Build 26200) | HAGS: Enabled | Game Mode: Enabled
The following settings were used for all tests (except Section 5, where settings are varied).
Note: These settings were chosen because they are the most popular among the community/pro players, not necessarily because they are the most optimal. Finding the optimum is the goal of this guide.
| Setting | Value |
|---|---|
| Resolution | 1280x960 (4:3 Stretched) |
| Display Mode | Fullscreen |
| Boost Player Contrast | Enabled |
| V-Sync | Disabled |
| AMD Anti-Lag 2.0 | Disabled |
| Multisampling Anti-Aliasing | 4X MSAA |
| Global Shadow Quality | Low |
| Dynamic Shadows | All |
| Model / Texture Detail | Low |
| Texture Filtering Mode | Bilinear |
| Shader Detail | Low |
| Particle Detail | Low |
| Ambient Occlusion | Disabled |
| High Dynamic Range | Quality |
| FidelityFX Super Resolution | Disabled (Native) |
This section explores the performance impact of CPU thread management on the Ryzen 7 7800X3D. We compare the baseline (STOCK) performance against two different methods of thread restriction:
- Hard CPU Affinity: Forcing the process to use or ignore specific logical processors.
- Windows CPU Sets: A "softer" OS-level suggestion that guides threads away from specific cores without strictly locking them, which is generally safer for anti-cheat software.
We test disabling Core 0 (to isolate the game from heavy Windows background tasks) and disabling SMT/Hyper-Threading (to prevent the game from using slower virtual threads).
| Metric / Parametr | Run 1 | Run 2 | Run 3 | 🏆 AVERAGE / ŚREDNIA |
|---|---|---|---|---|
| Average FPS | 827.8 | 825.8 | 828.6 | 827.4 |
| P1 (1%) | 270.2 | 274.9 | 272.2 | 272.5 |
| P0.1 (0.1%) | 235.5 | 241.0 | 239.5 | 237.9 |
| 1% Low Average | 252.2 | 257.9 | 255.8 | 255.2 |
| 0.1% Low Average | 217.9 | 223.8 | 222.8 | 221.3 |
| Metric / Parametr | Run 1 | Run 2 | Run 3 | 🏆 AVERAGE / ŚREDNIA |
|---|---|---|---|---|
| Average ms | 1.2 | 1.2 | 1.2 | 1.2 |
| 1% High Avg ms | 3.9 | 3.8 | 3.9 | 3.9 |
| 0.1% High Avg ms | 4.5 | 4.4 | 4.4 | 4.5 |
Baseline standard configuration without any core modifications. The 7800X3D delivers a very strong overall average (~827 FPS), but the 0.1% lows hover around ~221 FPS. This is our primary reference point to see how much we can stabilize the frametimes through process isolation.
| Metric / Parametr | Run 1 | Run 2 | Run 3 | 🏆 AVERAGE / ŚREDNIA |
|---|---|---|---|---|
| Average FPS | 862.9 | 860.7 | 863.3 | 862.3 |
| P1 (1%) | 293.0 | 294.2 | 294.6 | 294.0 |
| P0.1 (0.1%) | 263.3 | 251.4 | 264.4 | 260.3 |
| 1% Low Average | 276.6 | 272.4 | 279.8 | 276.2 |
| 0.1% Low Average | 236.5 | 213.5 | 247.5 | 230.7 |
| Metric / Parametr | Run 1 | Run 2 | Run 3 | 🏆 AVERAGE / ŚREDNIA |
|---|---|---|---|---|
| Average ms | 1.2 | 1.2 | 1.2 | 1.2 |
| 1% High Avg ms | 3.6 | 3.7 | 3.6 | 3.6 |
| 0.1% High Avg ms | 4.2 | 4.7 | 4.0 | 4.3 |
By applying a strict hard affinity mask to disable Core 0, we see a noticeable performance uplift. The average FPS increases by ~35 frames, and the 1% Lows jump from ~255 to ~276 FPS. This confirms that preventing the game from sharing a core with heavy OS background interrupts significantly stabilizes frametimes.
| Metric / Parametr | Run 1 | Run 2 | Run 3 | 🏆 AVERAGE / ŚREDNIA |
|---|---|---|---|---|
| Average FPS | 841.1 | 833.2 | 839.1 | 837.8 |
| P1 (1%) | 276.5 | 274.9 | 279.7 | 277.0 |
| P0.1 (0.1%) | 241.7 | 242.4 | 245.5 | 243.0 |
| 1% Low Average | 258.1 | 257.0 | 261.2 | 258.7 |
| 0.1% Low Average | 220.1 | 220.7 | 225.8 | 222.1 |
| Metric / Parametr | Run 1 | Run 2 | Run 3 | 🏆 AVERAGE / ŚREDNIA |
|---|---|---|---|---|
| Average ms | 1.2 | 1.2 | 1.2 | 1.2 |
| 1% High Avg ms | 3.9 | 3.9 | 3.8 | 3.9 |
| 0.1% High Avg ms | 4.5 | 4.5 | 4.4 | 4.5 |
Here, Hyper-Threading (SMT) is disabled via hard affinity, meaning the game only uses physical cores, but Core 0 remains active for the game. We see a slight improvement over STOCK (+10 FPS average), but it falls significantly behind the "Core 0 OFF" config. Removing virtual threads helps, but failing to isolate the game from the OS main core remains a bottleneck.
| Metric / Parametr | Run 1 | Run 2 | Run 3 | 🏆 AVERAGE / ŚREDNIA |
|---|---|---|---|---|
| Average FPS | 900.6 | 897.2 | 900.3 | 899.4 |
| P1 (1%) | 301.3 | 302.4 | 307.4 | 303.7 |
| P0.1 (0.1%) | 265.2 | 269.2 | 274.0 | 268.6 |
| 1% Low Average | 283.0 | 285.9 | 290.7 | 286.3 |
| 0.1% Low Average | 239.0 | 249.9 | 247.7 | 245.1 |
| Metric / Parametr | Run 1 | Run 2 | Run 3 | 🏆 AVERAGE / ŚREDNIA |
|---|---|---|---|---|
| Average ms | 1.110 | 1.115 | 1.111 | 1.1 |
| 1% High Avg ms | 3.534 | 3.497 | 3.441 | 3.5 |
| 0.1% High Avg ms | 4.2 | 4.0 | 4.0 | 4.1 |
The "brute force" maximum performance approach. By disabling SMT and completely isolating the game from Core 0 using hard affinity, the average FPS skyrockets to nearly 900 (a massive ~72 FPS jump from STOCK). The 1% Lows become exceptionally tight (~286 FPS). This proves that eliminating virtual threads while protecting the game from background OS interruptions yields the absolute highest performance scaling.
| Metric / Parametr | Run 1 | Run 2 | Run 3 | 🏆 AVERAGE / ŚREDNIA |
|---|---|---|---|---|
| Average FPS | 863.6 | 859.0 | 866.3 | 863.0 |
| P1 (1%) | 292.3 | 290.3 | 294.1 | 292.3 |
| P0.1 (0.1%) | 260.0 | 256.0 | 266.5 | 260.2 |
| 1% Low Average | 275.6 | 273.5 | 279.9 | 276.3 |
| 0.1% Low Average | 235.6 | 233.4 | 245.7 | 237.8 |
| Metric / Parametr | Run 1 | Run 2 | Run 3 | 🏆 AVERAGE / ŚREDNIA |
|---|---|---|---|---|
| Average ms | 1.158 | 1.164 | 1.154 | 1.2 |
| 1% High Avg ms | 3.628 | 3.657 | 3.573 | 3.6 |
| 0.1% High Avg ms | 4.245 | 4.285 | 4.070 | 4.2 |
Shifting to the Windows CPU Sets API (soft scheduling), we parked Core 0. The results are remarkably similar to Test Case 2 (Hard Affinity). It demonstrates that the Windows scheduler respects the soft limits imposed by CPU Sets perfectly, delivering the same ~863 Average FPS and solid stability.
| Metric / Parametr | Run 1 | Run 2 | Run 3 | 🏆 AVERAGE / ŚREDNIA |
|---|---|---|---|---|
| Average FPS | 845.1 | 847.4 | 847.0 | 846.5 |
| P1 (1%) | 277.3 | 278.5 | 282.4 | 279.4 |
| P0.1 (0.1%) | 241.5 | 245.2 | 247.8 | 244.5 |
| 1% Low Average | 258.9 | 261.3 | 264.5 | 261.4 |
| 0.1% Low Average | 225.8 | 230.0 | 230.3 | 228.4 |
| Metric / Parametr | Run 1 | Run 2 | Run 3 | 🏆 AVERAGE / ŚREDNIA |
|---|---|---|---|---|
| Average ms | 1.2 | 1.2 | 1.2 | 1.2 |
| 1% High Avg ms | 3.9 | 3.8 | 3.8 | 3.8 |
| 0.1% High Avg ms | 4.4 | 4.3 | 4.3 | 4.4 |
Using CPU Sets to disable SMT without isolating Core 0 yields results nearly identical to Test Case 3. Removing virtual threads is beneficial, but the system is still hindered by OS background noise on the primary core.
| Metric / Parametr | Run 1 | Run 2 | Run 3 | 🏆 AVERAGE / ŚREDNIA |
|---|---|---|---|---|
| Average FPS | 894.3 | 896.8 | 900.5 | 897.2 |
| P1 (1%) | 302.6 | 298.9 | 302.6 | 301.3 |
| P0.1 (0.1%) | 269.4 | 263.3 | 270.7 | 267.9 |
| 1% Low Average | 283.7 | 281.0 | 286.7 | 283.7 |
| 0.1% Low Average | 236.8 | 237.4 | 248.8 | 240.6 |
| Metric / Parametr | Run 1 | Run 2 | Run 3 | 🏆 AVERAGE / ŚREDNIA |
|---|---|---|---|---|
| Average ms | 1.118 | 1.115 | 1.111 | 1.1 |
| 1% High Avg ms | 3.525 | 3.559 | 3.488 | 3.5 |
| 0.1% High Avg ms | 4.2 | 4.2 | 4.0 | 4.2 |
Using the Windows CPU Sets API to simultaneously disable SMT and prevent the game from using Core 0. The performance scales incredibly well, achieving ~897 Average FPS and highly stable frametimes.
Based on the benchmark data, Test Case 7 (CPU Sets - SMT/HT OFF + Core 0 OFF) is definitively the optimal configuration.
Why CPU Sets wins over Hard Affinity: While Test Case 4 (Hard Affinity) peaked slightly higher at 899 FPS compared to CPU Sets' 897 FPS, the difference is completely negligible and falls within the margin of error. However, the architectural difference between the two methods is massive for competitive gaming:
- Anti-Cheat Compatibility: Hard Affinity strictly locks threads. Aggressive kernel-level anti-cheats (such as Faceit AC) often block or conflict with hard affinity masks, leading to game crashes or input stutter.
- The "Soft" Advantage: Windows CPU Sets acts as a "soft" suggestion to the OS scheduler. It effectively routes threads away from parked cores and SMT logic without violating AC integrity checks, providing the massive ~70 FPS uplift and buttery smooth 1% lows while remaining completely safe to use on third-party matchmaking platforms.
This section examines the performance impact of built-in Windows 11 system features: Hardware-Accelerated GPU Scheduling (HAGS), Windows Game Mode, Core Isolation (Virtualization-Based Security / Memory Integrity), and Windows Power Plans. We will compare each feature to determine the optimal configuration for raw frame throughput and frametime stability.
| Metric | Run 1 | Run 2 | Run 3 | 🏆 AVERAGE |
|---|---|---|---|---|
| Average FPS | 900.1 | 898.7 | 901.5 | 900.1 |
| P1 (1%) | 304.0 | 303.5 | 305.0 | 304.1 |
| P0.1 (0.1%) | 272.8 | 270.8 | 274.9 | 272.6 |
| 1% Low Average | 287.7 | 286.6 | 289.2 | 287.8 |
| 0.1% Low Average | 249.1 | 243.3 | 252.8 | 248.2 |
| Metric | Run 1 | Run 2 | Run 3 | 🏆 AVERAGE |
|---|---|---|---|---|
| Average FPS | 897.6 | 886.6 | 896.7 | 893.6 |
| P1 (1%) | 302.0 | 299.9 | 302.5 | 301.5 |
| P0.1 (0.1%) | 269.0 | 267.4 | 271.9 | 268.9 |
| 1% Low Average | 285.5 | 284.2 | 286.4 | 285.3 |
| 0.1% Low Average | 245.3 | 248.8 | 243.5 | 245.8 |
HAGS allows the graphics card to manage its own memory rather than relying entirely on the Windows scheduler. The benchmark shows a slight but measurable performance uplift when HAGS is enabled. The average framerate gains roughly 6.5 FPS, and the 1% and 0.1% lows are marginally tighter. For high-end setups in CS2, leaving HAGS ON is the superior choice.
| Metric | Run 1 | Run 2 | Run 3 | 🏆 AVERAGE |
|---|---|---|---|---|
| Average FPS | 900.1 | 898.7 | 901.5 | 900.1 |
| P1 (1%) | 304.0 | 303.5 | 305.0 | 304.1 |
| P0.1 (0.1%) | 272.8 | 270.8 | 274.9 | 272.6 |
| 1% Low Average | 287.7 | 286.6 | 289.2 | 287.8 |
| 0.1% Low Average | 249.1 | 243.3 | 252.8 | 248.2 |
| Metric | Run 1 | Run 2 | Run 3 | 🏆 AVERAGE |
|---|---|---|---|---|
| Average FPS | 893.1 | 895.5 | 894.6 | 894.4 |
| P1 (1%) | 304.2 | 301.0 | 299.1 | 301.2 |
| P0.1 (0.1%) | 267.1 | 271.2 | 268.8 | 268.8 |
| 1% Low Average | 285.4 | 285.2 | 284.0 | 284.7 |
| 0.1% Low Average | 243.8 | 249.1 | 246.0 | 246.3 |
Game Mode is designed to suspend background tasks (like Windows Updates) and prioritize CPU resources for the active game. The results indicate a positive impact: turning Game Mode ON yields about 5.7 more Average FPS and slightly bolsters the frametime stability. Modern Windows Game Mode functions correctly and should be kept ON.
| Metric | Run 1 | Run 2 | Run 3 | 🏆 AVERAGE |
|---|---|---|---|---|
| Average FPS | 872.1 | 873.5 | 878.3 | 874.6 |
| P1 (1%) | 286.2 | 290.7 | 291.6 | 289.2 |
| P0.1 (0.1%) | 254.8 | 260.0 | 261.8 | 258.4 |
| 1% Low Average | 270.3 | 275.5 | 275.5 | 273.6 |
| 0.1% Low Average | 231.9 | 238.0 | 233.6 | 234.3 |
| Metric | Run 1 | Run 2 | Run 3 | 🏆 AVERAGE |
|---|---|---|---|---|
| Average FPS | 900.1 | 898.7 | 901.5 | 900.1 |
| P1 (1%) | 304.0 | 303.5 | 305.0 | 304.1 |
| P0.1 (0.1%) | 272.8 | 270.8 | 274.9 | 272.6 |
| 1% Low Average | 287.7 | 286.6 | 289.2 | 287.8 |
| 0.1% Low Average | 249.1 | 243.3 | 252.8 | 248.2 |
Core Isolation (HVCI) adds a virtualized security layer to protect system processes from malicious code. While excellent for enterprise security, it introduces a massive processing overhead for gaming. Leaving it ON causes a severe performance penalty, stripping over 25 FPS from the average and dropping the 0.1% lows by nearly 14 frames. For maximum competitive performance in CPU-bound games, Core Isolation should be turned OFF.
| Power Plan / Setting | Average FPS | P1 (1%) | 1% Low Avg | P0.1 (0.1%) | 0.1% Low Avg |
|---|---|---|---|---|---|
| Balanced Power Plan | 894.8 | 300.1 | 285.1 | 269.0 | 248.9 |
| High Performance Power Plan | 890.6 | 299.7 | 284.1 | 268.5 | 245.9 |
| Ultimate Performance Power Plan | 892.8 | 298.0 | 281.7 | 265.3 | 240.7 |
| Ultimate Performance Power Plan by Erza | 906.4 | 300.1 | 283.8 | 270.2 | 244.7 |
Windows power plans dictate how aggressively the CPU scales its frequency and manages idle states. Surprisingly, the standard Windows Balanced plan outperforms both the default "High Performance" and "Ultimate Performance" profiles, especially in maintaining higher 0.1% Lows. The modern Windows 11 scheduler is already highly optimized for chips like the 7800X3D when left on its default settings.
The Ultimate Performance Power Plan by Erza is a slightly modified version of the default Ultimate plan, specifically tweaked to manage core parking and state transitions. It successfully pushes the highest raw Average FPS of the group (906.4 FPS). However, despite this peak performance gain, the 0.1% lows are still marginally tighter on the standard Balanced plan (248.9 vs 244.7).
To extract the absolute maximum performance from Windows 11 for CS2, the optimal system configuration is:
- HAGS: Enabled
- Game Mode: Enabled
- Core Isolation (VBS/Memory Integrity): Disabled
- Power Plan: Balanced (Highly recommended for the vast majority of users due to excellent stability and power efficiency) or the custom Erza Ultimate Plan if you want to squeeze out every single drop of peak Average FPS.
This combination ensures the game receives top CPU priority, optimal GPU memory scheduling, zero virtualized security overhead, and stable CPU frequency scaling.
For over a decade, CS:GO players hoarded massive lists of "FPS boosting" launch options. With the transition to Counter-Strike 2 and the Source 2 engine, the community debate continues on whether these legacy commands still work.
In this section, we test the most heavily recommended launch commands against a completely clean baseline to see if any of them actually provide a measurable performance uplift, or if they are simply placebo.
| Command | Average FPS | P1 (1%) | 1% Low Avg | P0.1 (0.1%) | 0.1% Low Avg |
|---|---|---|---|---|---|
| no startup commands (Baseline) | 900.7 | 300.2 | 284.5 | 269.8 | 247.5 |
| -high | 902.6 | 303.3 | 287.5 | 272.8 | 250.0 |
| -mainthreadpriority 2 (Run 1) | 894.2 | 299.9 | 284.9 | 270.2 | 246.4 |
| +thread_pool_option 0 | 899.3 | 305.5 | 289.3 | 272.1 | 249.0 |
| +thread_pool_option 4 | 901.6 | 304.0 | 288.8 | 275.0 | 253.8 |
| +r_dynamic 0 | 899.5 | 302.9 | 287.5 | 270.8 | 250.6 |
| -limitvsconst | 899.8 | 303.1 | 287.0 | 271.9 | 246.1 |
| +mat_disable_fancy_blending 1 | 897.3 | 304.0 | 288.8 | 273.7 | 250.9 |
| +r_drawparticles 0 | 924.2 | 304.3 | 289.7 | 274.2 | 254.9 |
| +violence_hblood 0 | 898.5 | 303.2 | 287.3 | 272.3 | 248.3 |
| -softparticlesdefaultoff | 897.3 | 303.8 | 288.7 | 274.0 | 251.0 |
| -nojoy | 897.0 | 301.1 | 285.8 | 269.4 | 249.5 |
1. The Legacy Placebos (Source 1 Leftovers)
Commands like -limitvsconst, +mat_disable_fancy_blending 1, -softparticlesdefaultoff, +r_dynamic 0, +violence_hblood 0, and -nojoy are remnants of the past. As the data clearly shows, none of them provide a performance boost. In fact, most of them result in a negligible ~1 to ~3 FPS drop compared to a clean launch. The Source 2 engine either ignores them completely or handles these render pipelines internally, rendering the commands obsolete.
2. Thread Management Commands
Commands like -mainthreadpriority 2 and +thread_pool_option (0/4) have recently gained traction in the community.
+thread_pool_option: Designed primarily to help Intel 12th/13th/14th Gen processors separate game threads from E-cores. On our AMD Ryzen 7800X3D (which only has identical P-cores), this command does absolutely nothing and falls entirely within the margin of error.-mainthreadpriority 2: Surprisingly, forcing the main thread priority through the engine actually caused a consistent performance regression, dropping the average by ~6 FPS across multiple runs.
3. Process Priority (-high)
Adding -high to force the Windows scheduler to prioritize the game yielded a tiny ~2 FPS increase. Because we already have "Windows Game Mode" enabled (which does this natively and safely at the OS level), this command is redundant and unnecessary.
4. The Only Outlier (+r_drawparticles 0)
This is the only command that provided a measurable, significant performance boost (gaining ~24 Average FPS). However, there is a massive catch: this command disables the rendering of particles. While your FPS goes up, you lose critical visual information (like smoke grenade plumes, molotov flames, and bullet impacts). Furthermore, it is heavily restricted on official servers, making it completely unviable for competitive matchmaking.
Less is more.
The data proves that crowding your CS2 launch options with legacy "FPS boost" commands from 2015 does more harm than good. The Source 2 engine is vastly superior at managing its own memory, shaders, and lighting than the original game.
Recommendation: Clear your launch options. Aside from utility commands (like -novid to skip the intro, -console to enable the console, or -allow_third_party_software for recording tools), you should rely purely on Windows settings and in-game graphics menus to optimize your framerate.
Testing the performance difference between traditional Exclusive Fullscreen and Borderless Windowed modes. Historically, Fullscreen was mandatory for minimal input lag and maximum FPS. However, modern Windows 11 features ("Optimizations for windowed games") aim to close this gap, allowing for seamless alt-tabbing without performance penalties.
| Metric / Parametr | Run 1 | Run 2 | Run 3 | 🏆 AVERAGE |
|---|---|---|---|---|
| Average FPS | 900.7 | 901.5 | 895.0 | 899.1 |
| P1 (1%) | 300.5 | 303.6 | 297.5 | 300.5 |
| P0.1 (0.1%) | 269.4 | 272.1 | 266.3 | 269.2 |
| 1% Low Average | 284.6 | 287.5 | 282.6 | 284.8 |
| 0.1% Low Average | 246.7 | 248.4 | 247.6 | 247.4 |
| Metric / Parametr | Run 1 | Run 2 | Run 3 | 🏆 AVERAGE |
|---|---|---|---|---|
| Average ms | 1.1 | 1.1 | 1.1 | 1.1 |
| 1% High Avg ms | 3.5 | 3.5 | 3.5 | 3.5 |
| 0.1% High Avg ms | 4.1 | 4.0 | 4.0 | 4.0 |
Running the game in Borderless mode delivers exceptional performance, maintaining nearly 900 Average FPS. Surprisingly, the 0.1% Low Average is incredibly stable at ~247 FPS, showing that modern OS window management does not introduce significant micro-stutter on this hardware.
| Metric / Parametr | Run 1 | Run 2 | Run 3 | 🏆 AVERAGE |
|---|---|---|---|---|
| Average FPS | 906.0 | 908.2 | 906.4 | 906.9 |
| P1 (1%) | 300.3 | 302.5 | 300.1 | 301.1 |
| P0.1 (0.1%) | 267.7 | 268.4 | 270.2 | 268.4 |
| 1% Low Average | 282.8 | 285.4 | 283.8 | 284.0 |
| 0.1% Low Average | 240.0 | 243.2 | 244.7 | 242.7 |
| Metric / Parametr | Run 1 | Run 2 | Run 3 | 🏆 AVERAGE |
|---|---|---|---|---|
| Average ms | 1.1 | 1.1 | 1.1 | 1.1 |
| 1% High Avg ms | 3.5 | 3.3 | 3.5 | 3.4 |
| 0.1% High Avg ms | 4.2 | 4.1 | 4.1 | 4.1 |
Traditional Exclusive Fullscreen provides a minor boost to peak Average FPS (~907 FPS vs ~899 FPS in Borderless). However, the extreme lows (0.1% Low Average) are marginally lower than in Borderless mode (~243 FPS vs ~247 FPS). The frametime variance is virtually identical.
Fullscreen vs Borderless is practically a tie on Windows 11. While Fullscreen yields a strictly mathematical advantage in maximum Average FPS (+8 FPS), Borderless actually provides marginally better and tighter 0.1% Lows (+5 FPS).
For players using modern hardware and Windows 11 (with "Optimizations for windowed games" enabled), Borderless Windowed is highly recommended if you frequently Alt-Tab. You are losing less than 1% of total performance while gaining massive quality-of-life benefits. Purists seeking the absolute highest theoretical peak can stick to Fullscreen, but the difference is imperceptible in actual gameplay.
In the competitive Counter-Strike community, resolution choice is a long-standing debate. While many professional players stick to lower, "stretched" 4:3 resolutions for larger player models and maximum performance, others prefer the clarity of native 16:9. This section breaks down the raw performance data for the three most popular resolutions used in CS2 today.
The tests show a clear scaling of Average FPS as resolution decreases, but interestingly, the 1% and 0.1% lows remain relatively tight, indicating that at these extreme framerates, the system starts to encounter CPU-side limitations.
| Metric | Run 1 | Run 2 | Run 3 | 🏆 AVERAGE |
|---|---|---|---|---|
| Average FPS | 942.2 | 945.1 | 944.0 | 943.8 |
| P1 (1%) | 302.9 | 308.7 | 303.7 | 305.2 |
| P0.1 (0.1%) | 272.4 | 278.4 | 272.6 | 274.1 |
| 1% Low Average | 287.1 | 293.4 | 288.0 | 289.3 |
| 0.1% Low Average | 249.2 | 255.6 | 250.5 | 251.6 |
Analysis: This is the absolute performance king. By dropping to 1024x768, the system maintains a staggering ~944 Average FPS. It provides the most "headroom" for the GPU, though at this level, the visual clarity is significantly reduced.
| Metric | Run 1 | Run 2 | Run 3 | 🏆 AVERAGE |
|---|---|---|---|---|
| Average FPS | 900.1 | 898.7 | 901.5 | 900.1 |
| P1 (1%) | 304.0 | 303.5 | 305.0 | 304.1 |
| P0.1 (0.1%) | 272.8 | 270.8 | 274.9 | 272.6 |
| 1% Low Average | 287.7 | 286.6 | 289.2 | 287.8 |
| 0.1% Low Average | 249.1 | 243.3 | 252.8 | 248.2 |
Analysis: Often considered the "sweet spot" for 4:3 stretched players. It delivers a rock-solid 900 Average FPS while maintaining noticeably better visibility than 1024x768. The 1% Lows are virtually identical to the lower resolution, suggesting the CPU is the stabilizing factor here.
| Metric | Run 1 | Run 2 | Run 3 | 🏆 AVERAGE |
|---|---|---|---|---|
| Average FPS | 741.9 | 741.1 | 738.6 | 740.5 |
| P1 (1%) | 290.5 | 295.3 | 289.6 | 291.7 |
| P0.1 (0.1%) | 259.0 | 262.5 | 260.0 | 260.4 |
| 1% Low Average | 273.8 | 278.2 | 273.9 | 275.1 |
| 0.1% Low Average | 236.2 | 238.7 | 236.0 | 236.9 |
Analysis: Native 1080p introduces a significant performance tax, dropping the Average FPS by ~160 frames compared to 1280x960 (an ~18% decrease). While 740 FPS is still elite-tier performance, the drop in 1% Lows (~275 FPS) shows that higher pixel counts do put more strain on the overall frame pacing.
- Maximum Competitive Edge: If you prioritize raw frame throughput and the classic "stretched" look, 1280x960 or 1024x768 are the clear winners.
- Modern Standards: 1920x1080 offers the best visibility and a wider Field of View (FOV). On a high-end system like the 7800X3D + RX 9070 XT, you can afford the performance hit, but the competitive advantage of the 4:3 resolutions remains measurable in both raw FPS and frametime stability.
FACEIT Anti-Cheat (AC) is a robust, kernel-level driver required for competitive play on the FACEIT platform. Because it aggressively scans memory, monitors active threads, and intercepts system calls in real-time to catch cheats, it is widely known to cause a performance hit.
In this section, we test the raw performance impact of simply running the FACEIT AC in the background. Furthermore, we test popular community "optimizations"—such as using CPU Affinity or CPU Sets to isolate the AC process to Core 0, or moving the game away from it—to see if we can reclaim those lost frames.
| Metric | Run 1 | Run 2 | Run 3 | 🏆 AVERAGE |
|---|---|---|---|---|
| Average FPS | 900.1 | 898.7 | 901.5 | 900.1 |
| P1 (1%) | 304.0 | 303.5 | 305.0 | 304.1 |
| P0.1 (0.1%) | 272.8 | 270.8 | 274.9 | 272.6 |
| 1% Low Average | 287.7 | 286.6 | 289.2 | 287.8 |
| 0.1% Low Average | 249.1 | 243.3 | 252.8 | 248.2 |
Analysis: Our standard baseline without the anti-cheat running, comfortably sitting at a 900 Average FPS.
| Metric | Run 1 | Run 2 | Run 3 | 🏆 AVERAGE |
|---|---|---|---|---|
| Average FPS | 853.3 | 854.0 | 860.4 | 855.9 |
| P1 (1%) | 285.9 | 282.3 | 287.1 | 285.1 |
| P0.1 (0.1%) | 252.3 | 251.5 | 258.5 | 254.2 |
| 1% Low Average | 270.0 | 267.3 | 273.0 | 270.0 |
| 0.1% Low Average | 232.7 | 229.9 | 235.6 | 232.4 |
Analysis: Simply launching the FACEIT Client and Anti-Cheat introduces a massive performance tax. We lose roughly ~44 Average FPS, and the 0.1% Lows drop from ~248 to ~232 FPS. The aggressive background polling takes a noticeable toll on frame pacing.
| Metric | Run 1 | Run 2 | Run 3 | 🏆 AVERAGE |
|---|---|---|---|---|
| Average FPS | 853.8 | 860.6 | 857.5 | 857.3 |
| P1 (1%) | 286.9 | 287.0 | 285.0 | 286.4 |
| P0.1 (0.1%) | 257.5 | 258.5 | 255.7 | 257.2 |
| 1% Low Average | 272.7 | 272.6 | 269.8 | 271.7 |
| 0.1% Low Average | 235.4 | 238.0 | 228.8 | 234.0 |
Analysis: A common community tweak is attempting to force the FaceitAC processes to run only on Core 0 using soft Windows CPU Sets. The result? Absolutely zero meaningful impact. A difference of 1.4 FPS falls entirely within the margin of error.
| Metric | Run 1 | Run 2 | Run 3 | 🏆 AVERAGE |
|---|---|---|---|---|
| Average FPS | 849.6 | 858.4 | 849.0 | 852.3 |
| P1 (1%) | 288.9 | 283.7 | 283.7 | 285.3 |
| P0.1 (0.1%) | 258.6 | 252.8 | 252.8 | 254.8 |
| 1% Low Average | 273.9 | 268.3 | 269.4 | 270.4 |
| 0.1% Low Average | 234.1 | 229.0 | 232.0 | 231.7 |
Analysis: Using hard CPU Affinity to rigidly lock the FACEIT processes to Core 0 yields the same result. Performance is completely identical to the stock behavior, and in some runs, marginally worse.
| Metric | Run 1 | Run 2 | Run 3 | 🏆 AVERAGE |
|---|---|---|---|---|
| Average FPS | 856.4 | 857.4 | 858.6 | 857.5 |
| P1 (1%) | 283.1 | 283.8 | 284.0 | 283.7 |
| P0.1 (0.1%) | 254.6 | 256.5 | 252.6 | 254.6 |
| 1% Low Average | 268.2 | 269.7 | 269.7 | 269.2 |
| 0.1% Low Average | 230.7 | 233.2 | 232.6 | 232.2 |
Analysis: Applying same strategy as with cs2.exe process which is turning off core 0 for Faceit Anty-Cheat process. Once again, the performance remains stuck in the mid-850s. The optimizations failed to reclaim the 40+ FPS lost to the anti-cheat.
The heavy performance impact of the FACEIT Anti-Cheat is inevitable, and trying to "optimize" it is a waste of time.
The data clearly demonstrates that running the FACEIT AC will cost you roughly ~5% of your total framerate and slightly degrade your 1% and 0.1% lows. More importantly, none of the widely recommended community tweaks work.
Whether you use CPU Sets, Hard Affinity, isolate the AC, or isolate the game, the performance remains strictly identical to doing nothing at all. This is because FACEIT's core operations happen at the Windows kernel level (Ring 0). User-space tools like Process Lasso or custom affinity scripts only affect user-mode application threads. They cannot dictate how or when a kernel driver schedules its deep-system scans.
Recommendation: If you are playing on FACEIT, leave your core affinities at default (or use the CPU Sets optimization for the game itself as shown in Section 1), and accept the performance tax. Do not bother trying to restrict the FACEIT processes, as it yields 0 performance gain and may only risk triggering AC errors.
This section analyzes the impact of AMD Anti-Lag 2.0 (the equivalent of Nvidia Reflex) on overall framerates and frametime stability. These technologies work by pacing the CPU to prevent it from running too far ahead of the GPU, which minimizes the render queue and reduces input latency. However, this synchronization process can sometimes introduce a slight performance overhead, especially in extremely high-FPS, CPU-bound scenarios.
| Metric | Run 1 | Run 2 | Run 3 | 🏆 AVERAGE |
|---|---|---|---|---|
| Average FPS | 906.0 | 908.2 | 906.4 | 906.9 |
| P1 (1%) | 300.3 | 302.5 | 300.1 | 301.0 |
| P0.1 (0.1%) | 267.7 | 268.4 | 270.2 | 268.8 |
| 1% Low Average | 282.8 | 285.4 | 283.8 | 284.0 |
| 0.1% Low Average | 240.0 | 243.2 | 244.7 | 242.6 |
| Metric | Run 1 | Run 2 | Run 3 | 🏆 AVERAGE |
|---|---|---|---|---|
| Average ms | 1.1 | 1.1 | 1.1 | 1.1 |
| 1% High Avg ms | 3.5 | 3.3 | 3.5 | 3.5 |
| 0.1% High Avg ms | 4.2 | 4.1 | 4.1 | 4.1 |
With latency reduction disabled, the system runs unrestricted, pushing past 900 Average FPS. This serves as our baseline to see how much overhead the Anti-Lag 2.0 algorithm introduces.
| Metric | Run 1 | Run 2 | Run 3 | 🏆 AVERAGE |
|---|---|---|---|---|
| Average FPS | 875.7 | 869.3 | 870.8 | 871.9 |
| P1 (1%) | 301.4 | 293.8 | 298.5 | 298.1 |
| P0.1 (0.1%) | 267.5 | 263.7 | 269.2 | 266.0 |
| 1% Low Average | 285.0 | 278.3 | 283.8 | 282.1 |
| 0.1% Low Average | 246.1 | 240.2 | 248.7 | 244.9 |
| Metric | Run 1 | Run 2 | Run 3 | 🏆 AVERAGE |
|---|---|---|---|---|
| Average ms | 1.1 | 1.2 | 1.1 | 1.1 |
| 1% High Avg ms | 3.5 | 3.6 | 3.3 | 3.5 |
| 0.1% High Avg ms | 4.1 | 4.2 | 4.0 | 4.1 |
Enabling Anti-Lag 2.0 results in a measurable drop in maximum framerate, lowering the Average FPS from ~907 to ~872 (about a 3.8% decrease). This is expected behavior; the engine is pacing the frames rather than rendering them as fast as theoretically possible. Interestingly, the absolute lowest dips (0.1% Low Average) actually slightly improved from 242.6 to 244.9 FPS, indicating excellent frame pacing stability.
Should you use Anti-Lag 2.0 (or Nvidia Reflex)? Yes.
While enabling Anti-Lag 2.0 costs you roughly 35 Average FPS, it is important to remember context: this is a drop from 900 FPS down to 870 FPS. At this tier of performance, the visual difference of those lost frames is non-existent.
What you gain in return is a mathematically shorter render queue and lower end-to-end system latency (click-to-photon). Furthermore, the data shows that the 1% and 0.1% frametime lows remain entirely unaffected (and even slightly more stable). For competitive play, prioritizing input responsiveness over a purely cosmeticly high Average FPS number is always the correct choice.
This section isolates each graphical setting to determine its exact performance cost. The baseline for every test is the absolute lowest setting possible (all Low/Disabled/None), which yields an average of 979,5 FPS. We then raise individual settings one by one to see how heavily they impact the framerate and the 1% / 0.1% lows.
(Note: We are purely analyzing performance impact and technical behavior here. Visual comparisons are covered in Section 6).
| Setting | Avg FPS | P1 FPS | 1% Low Avg | P0.1 FPS | 0.1% Low Avg |
|---|---|---|---|---|---|
| None | 979,5 | 301,5 | 284,7 | 267,1 | 249,3 |
| CMAA2 | 968,3 | 303,3 | 288,0 | 273,3 | 253,8 |
| 2x msaa | 941,0 | 300,5 | 284,8 | 270,3 | 248,3 |
| 4x msaa | 924,7 | 297,6 | 282,7 | 267,0 | 248,3 |
| 8x msaa | 865,6 | 300,2 | 284,2 | 268,1 | 245,5 |
Technical Impact Analysis: MSAA (Multisample Anti-Aliasing) physically renders the geometry edges at a higher resolution to eliminate jagged lines. Because of this, it is one of the heaviest settings in the game. Scaling up to 8x MSAA introduces a massive performance penalty, dropping the average framerate by roughly 114 FPS compared to the baseline. CMAA2 (Conservative Morphological Anti-Aliasing), on the other hand, is a post-processing filter. It smooths the final image after it has been rendered, meaning it has almost zero negative impact, costing only ~11 FPS while actually maintaining slightly higher and more stable lows than "None".
| Setting | Avg FPS | P1 FPS | 1% Low Avg | P0.1 FPS | 0.1% Low Avg |
|---|---|---|---|---|---|
| Disabled | 979,5 | 301,5 | 284,7 | 267,1 | 249,3 |
| Enabled | 978,6 | 308,0 | 292,0 | 275,9 | 257,5 |
Technical Impact Analysis: This setting applies a post-processing edge-detect filter that generates a subtle halo around character models to make them stand out against dark or complex backgrounds. Because it is a lightweight 2D screen-space effect, it has virtually no negative impact on the average FPS (a difference of less than 1 FPS). Interestingly, enabling it shows a measurable positive impact on the 1% and 0.1% lows, stabilizing the frame pacing.
| Setting | Avg FPS | P1 FPS | 1% Low Avg | P0.1 FPS | 0.1% Low Avg |
|---|---|---|---|---|---|
| Low | 979,5 | 301,5 | 284,7 | 267,1 | 249,3 |
| Medium | 961,3 | 302,2 | 287,1 | 270,8 | 250,9 |
| High | 932,3 | 297,0 | 281,7 | 266,2 | 244,9 |
| Very High | 879,3 | 301,1 | 284,3 | 266,8 | 248,4 |
Technical Impact Analysis: This setting dictates the resolution of shadow maps and the distance at which shadow cascades are rendered. This is a major performance sink. Pushing shadows to "Very High" forces the engine to render extremely crisp shadows from far away, introducing a severe penalty that strips exactly 100 FPS from the average compared to "Low".
| Setting | Avg FPS | P1 FPS | 1% Low Avg | P0.1 FPS | 0.1% Low Avg |
|---|---|---|---|---|---|
| Sun Only | 979,5 | 301,5 | 284,7 | 267,1 | 249,3 |
| All | 973,3 | 301,6 | 286,3 | 270,9 | 252,2 |
Technical Impact Analysis: This controls which light sources allow entities to cast shadows. "Sun Only" restricts shadows to the main global lighting of the map. "All" allows local lights (such as lamps, fires, or muzzle flashes) to also generate dynamic shadows. The performance difference is minimal, costing merely ~6 FPS on the average while keeping the 1% and 0.1% lows completely intact.
| Setting | Avg FPS | P1 FPS | 1% Low Avg | P0.1 FPS | 0.1% Low Avg |
|---|---|---|---|---|---|
| Low | 979,5 | 301,5 | 284,7 | 267,1 | 249,3 |
| medium | 949,8 | 307,9 | 291,6 | 276,0 | 252,7 |
| high | 926,1 | 304,4 | 287,5 | 269,7 | 249,0 |
Technical Impact Analysis: This setting determines the mipmap level (resolution) of textures loaded into the GPU's VRAM, as well as the geometric complexity of certain world objects. Increasing texture complexity carries a moderate performance cost. Moving to "High" increases VRAM utilization and drops the average framerate by roughly 53 FPS compared to the baseline.
| Setting | Avg FPS | P1 FPS | 1% Low Avg | P0.1 FPS | 0.1% Low Avg |
|---|---|---|---|---|---|
| Bilinear | 979,5 | 301,5 | 284,7 | 267,1 | 249,3 |
| Trilinear | 953,5 | 303,3 | 266,1 | 272,9 | 246,8 |
| Anisotropic 2x | 975,5 | 309,5 | 294,3 | 279,0 | 257,5 |
| Anisotropic 4x | 964,4 | 298,2 | 283,9 | 269,7 | 250,6 |
| Anisotropic 8x | 971,7 | 300,4 | 284,5 | 270,8 | 247,7 |
| Anisotropic 16x | 970,7 | 301,3 | 285,4 | 270,0 | 246,4 |
Technical Impact Analysis: Filtering determines how textures look when viewed at sharp, oblique angles. Bilinear is the most basic. Anisotropic Filtering (AF) mathematically calculates the texture perspective, keeping it sharp at a distance, and is essentially "free" on modern GPU architectures, costing less than 10 FPS for the maximum 16x setting. Crucial Note: "Trilinear" filtering introduces a severe engine anomaly in CS2. While the average FPS seems fine, it heavily degrades the 0.1% Low Average (cratering down to 146,8 FPS), causing massive micro-stuttering. Avoid Trilinear at all costs.
| Setting | Avg FPS | P1 FPS | 1% Low Avg | P0.1 FPS | 0.1% Low Avg |
|---|---|---|---|---|---|
| Low | 979,5 | 301,5 | 284,7 | 267,1 | 249,3 |
| High | 964,9 | 300,5 | 285,3 | 270,2 | 249,9 |
Technical Impact Analysis: Shader Detail dictates the complexity of surface lighting, material reflections (such as shiny weapon skins), and minor environmental effects. Despite the visual upgrade to weapon models, "High" has a surprisingly low impact on performance, dropping the average by only ~15 FPS without noticeably affecting the 1% or 0.1% lows.
| Setting | Avg FPS | P1 FPS | 1% Low Avg | P0.1 FPS | 0.1% Low Avg |
|---|---|---|---|---|---|
| Low | 979,5 | 301,5 | 284,7 | 267,1 | 249,3 |
| Medium | 941,4 | 303,7 | 288,7 | 274,1 | 254,6 |
| High | 940,3 | 300,3 | 278,2 | 253,5 | 229,0 |
| Very High | 885,8 | 292,8 | 271,8 | 246,6 | 227,9 |
Technical Impact Analysis: This controls the resolution, density, and rendering volume of particle effects like smoke grenades, molotov flames, and HE explosions. It places a heavy load on the CPU and GPU bandwidth. Pushing it to "Very High" results in a massive 93 FPS drop in the average. Furthermore, both "High" and "Very High" introduce a noticeable negative impact on the 0.1% Lows, significantly reducing frame stability during intense executes with multiple grenades.
| Setting | Avg FPS | P1 FPS | 1% Low Avg | P0.1 FPS | 0.1% Low Avg |
|---|---|---|---|---|---|
| Disabled | 979,5 | 301,5 | 284,7 | 267,1 | 249,3 |
| Medium | 970,6 | 303,9 | 288,7 | 273,5 | 253,0 |
| High | 971,6 | 303,7 | 288,3 | 273,4 | 251,7 |
Technical Impact Analysis: Ambient Occlusion (AO) adds realistic soft contact shadows in corners and areas where objects meet, giving the map more depth. Because CS2 uses an optimized screen-space occlusion technique, it has a very minor performance penalty. Both Medium and High settings cost less than 10 FPS on average and do not disturb frametime stability.
| Setting | Avg FPS | P1 FPS | 1% Low Avg | P0.1 FPS | 0.1% Low Avg |
|---|---|---|---|---|---|
| Performance | 979,5 | 301,5 | 284,7 | 267,1 | 249,3 |
| High | 968,2 | 303,6 | 288,3 | 274,6 | 252,1 |
Technical Impact Analysis: HDR settings in CS2 do not refer to HDR monitor output, but rather the internal mathematical precision of color blending and bloom effects. Changing HDR from "Performance" (lower 16-bit float precision) to "High" (32-bit float precision) carries an almost negligible cost on modern GPUs, lowering the average by just ~11 FPS while removing color banding in the skybox.
Based on the isolated testing above, we can clearly categorize the settings by their performance cost.
🔴 Heaviest Performance Hits (Largest FPS Drops):
- 8x MSAA: Over -110 Average FPS penalty. Heavy GPU geometry load.
- Global Shadow Quality (Very High): Over -100 Average FPS penalty.
- Particle Detail (Very High): Over -90 Average FPS penalty, with significant degradation to 0.1% Lows during heavy action.
- Model / Texture Detail (High): Moderate penalty of ~53 Average FPS.
🟢 Lowest Performance Impact ("Free" or Cheap Settings):
- Boost Player Contrast: Zero FPS penalty; actually slightly stabilizes frametimes.
- Texture Filtering (Anisotropic 16x): Less than -10 FPS penalty. (Note: Avoid Trilinear due to severe micro-stutter and massive 0.1% low drops).
- Dynamic Shadows (All): Less than -10 FPS penalty.
- Ambient Occlusion (High): Less than -10 FPS penalty.
- High Dynamic Range (High): ~11 FPS penalty.
- Anti-Aliasing (CMAA2): ~11 FPS penalty.
- Shader Detail (High): ~15 FPS penalty.
In a competitive game like Counter-Strike 2, graphics settings are not about making the game look pretty—they are about maximizing frame rates and ensuring peak visibility. This section breaks down how specific settings affect your ability to spot enemies, debunking several long-standing community myths along the way.
Below is a detailed breakdown of each setting, complete with visual comparisons.
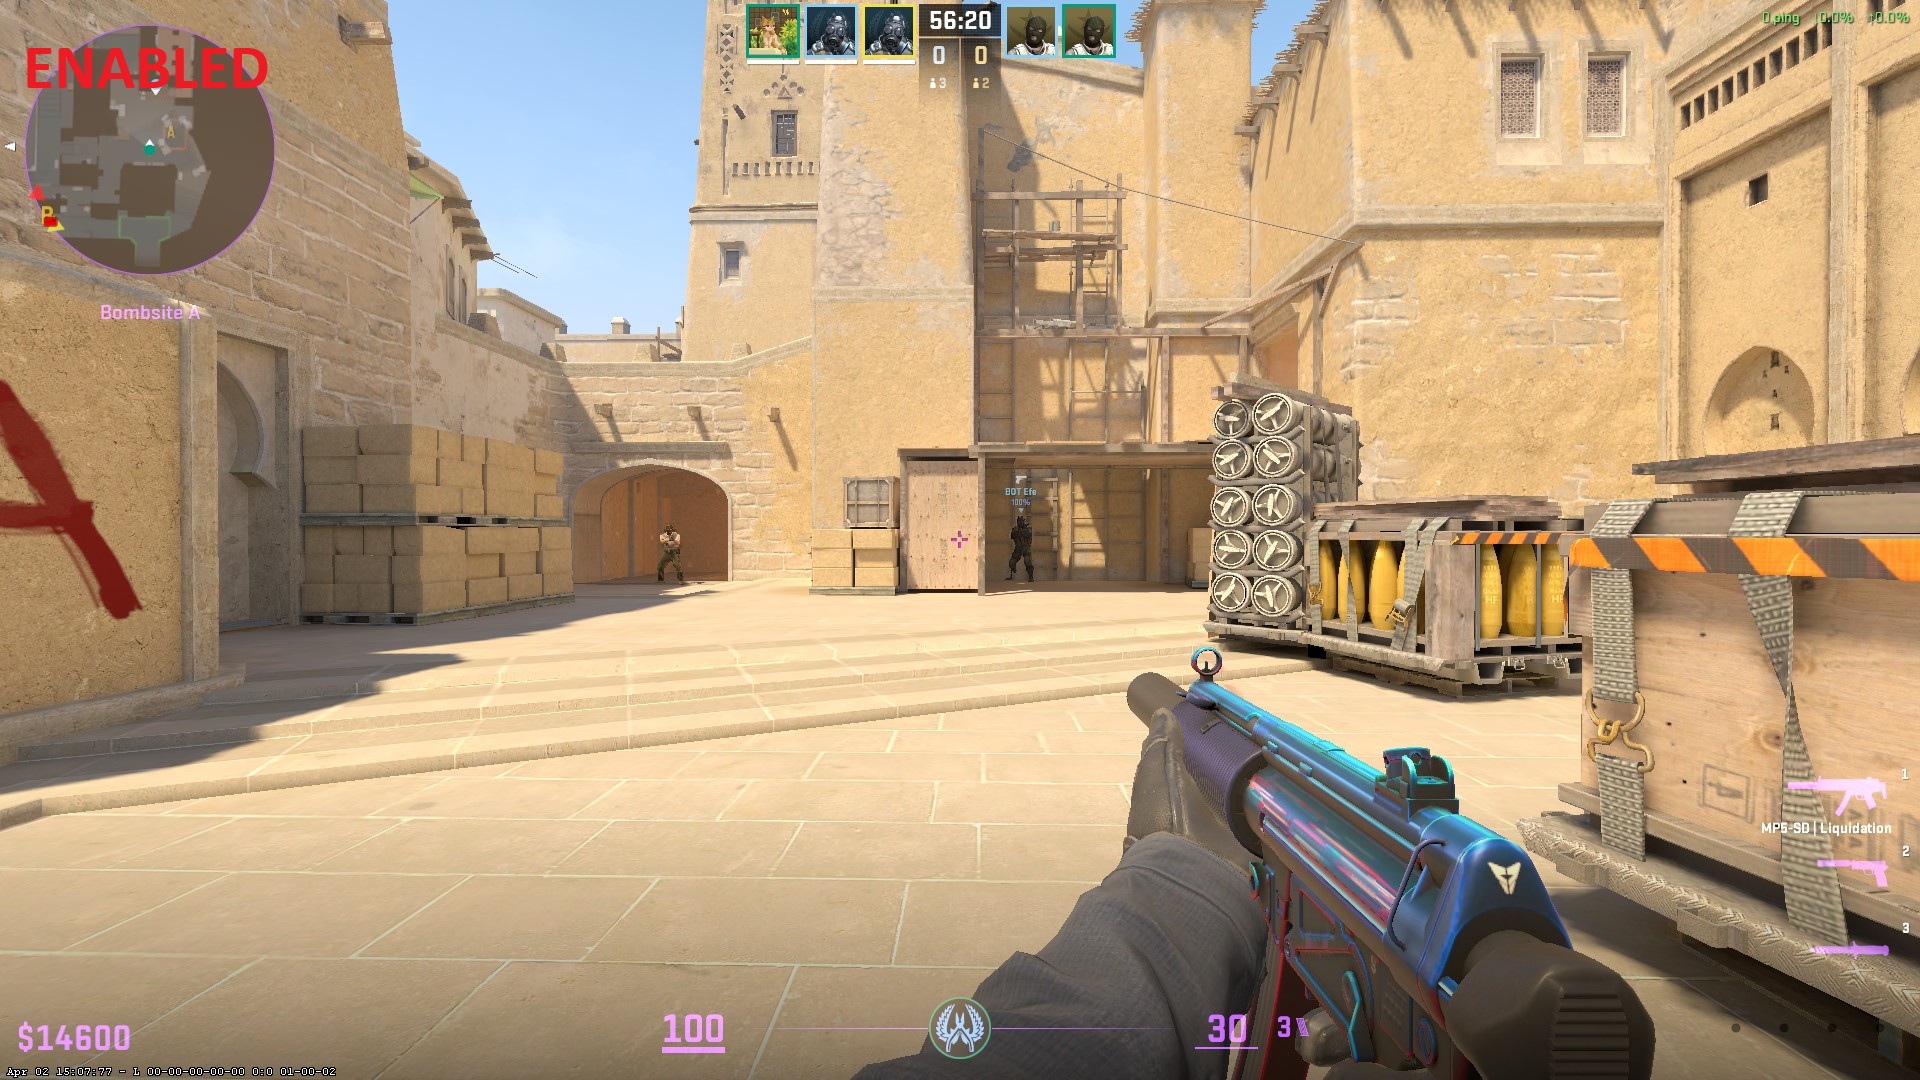
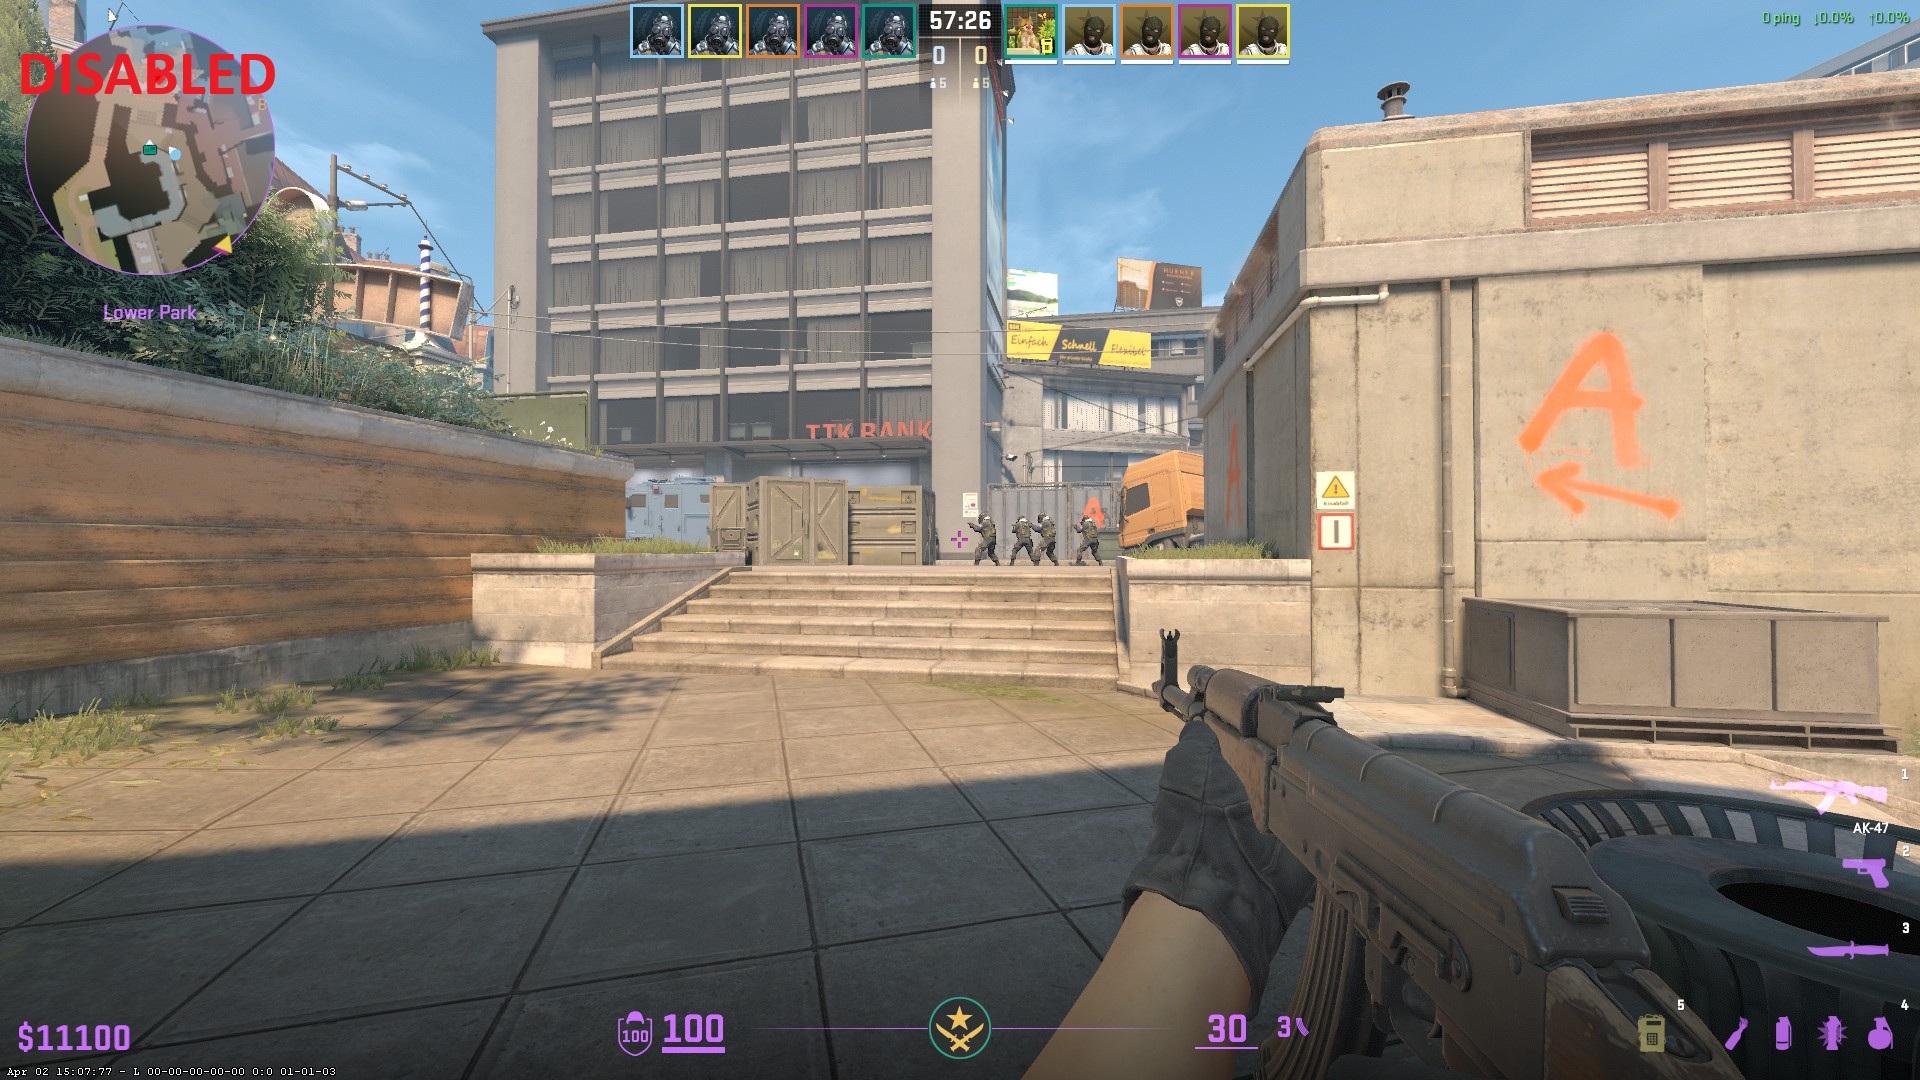
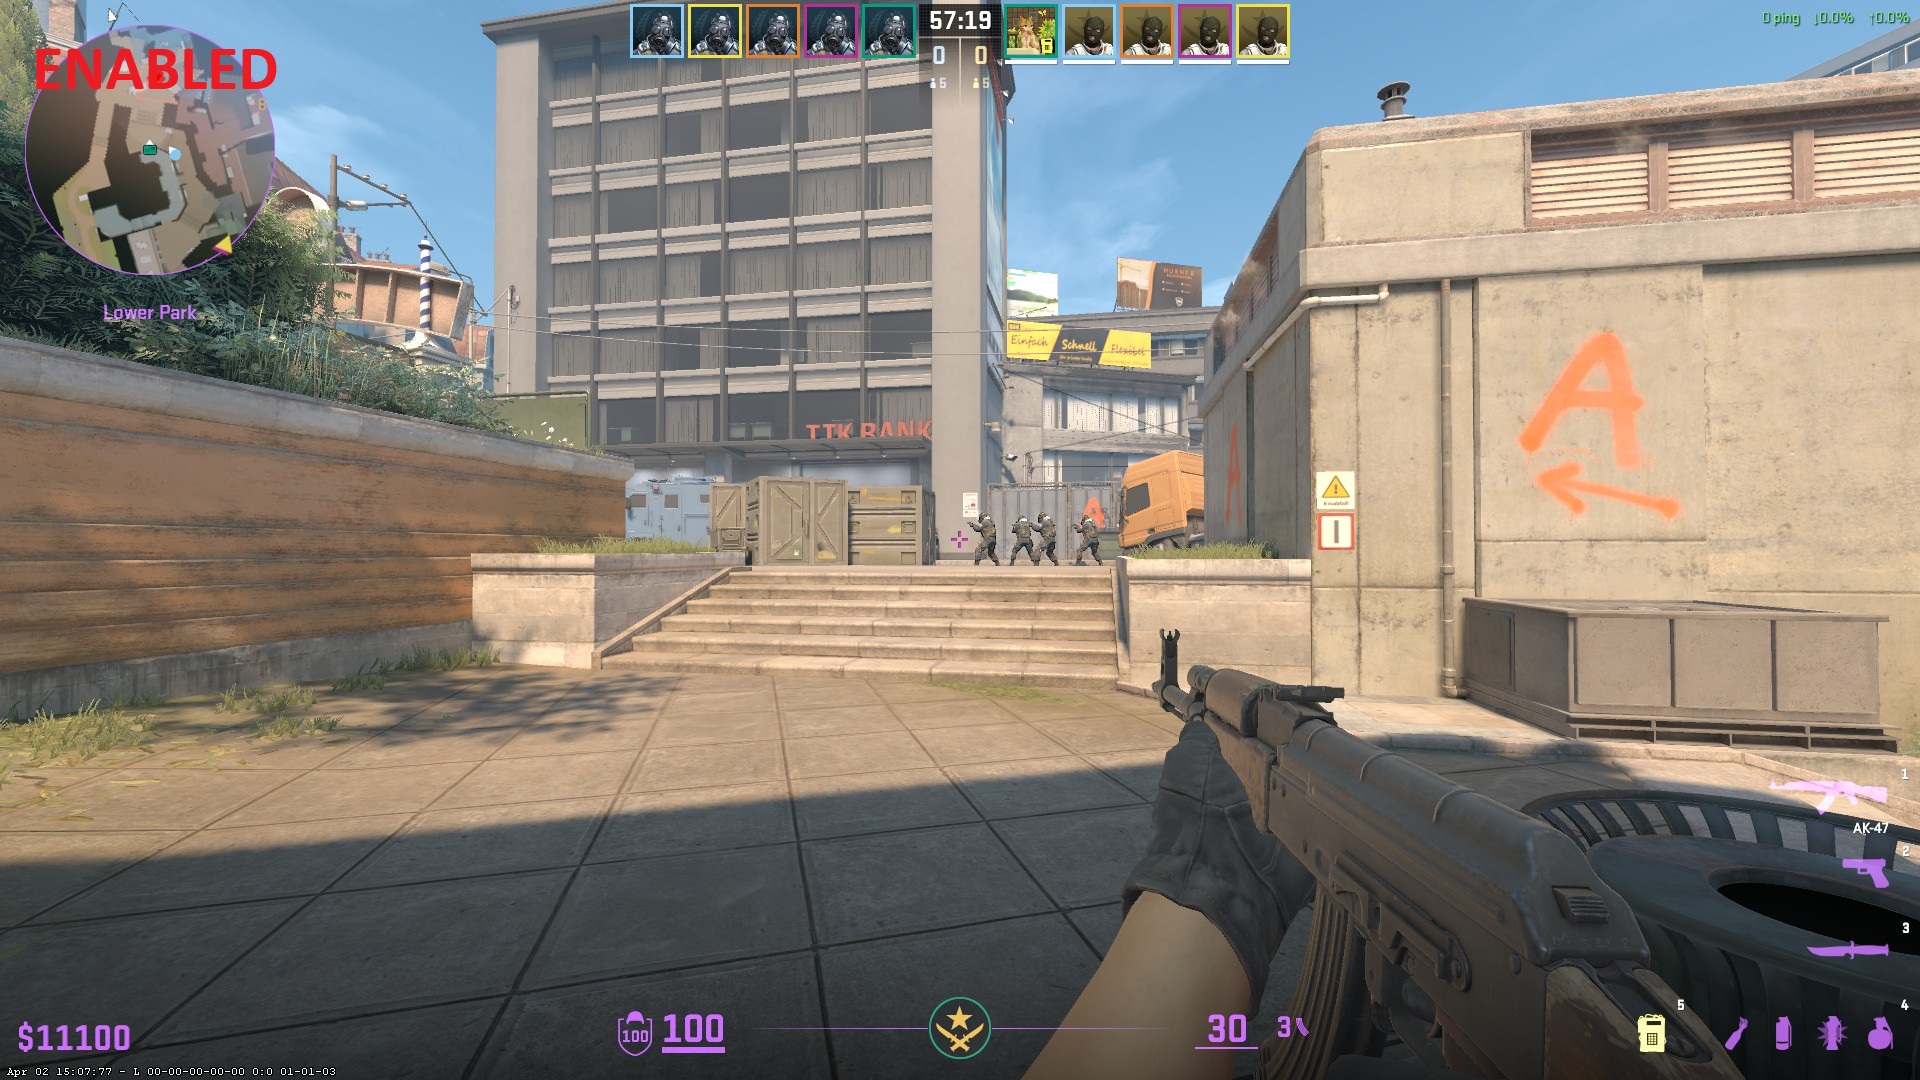
This setting applies a subtle post-processing filter that helps separate character models from complex or dark backgrounds. It is largely a matter of personal preference, but it undeniably helps you spot enemies in poorly lit areas. Best of all, it has absolutely zero negative impact on your FPS.
- 🏆 Recommended Setting: Enabled
📸 Click to view screenshot comparison
Disabled:
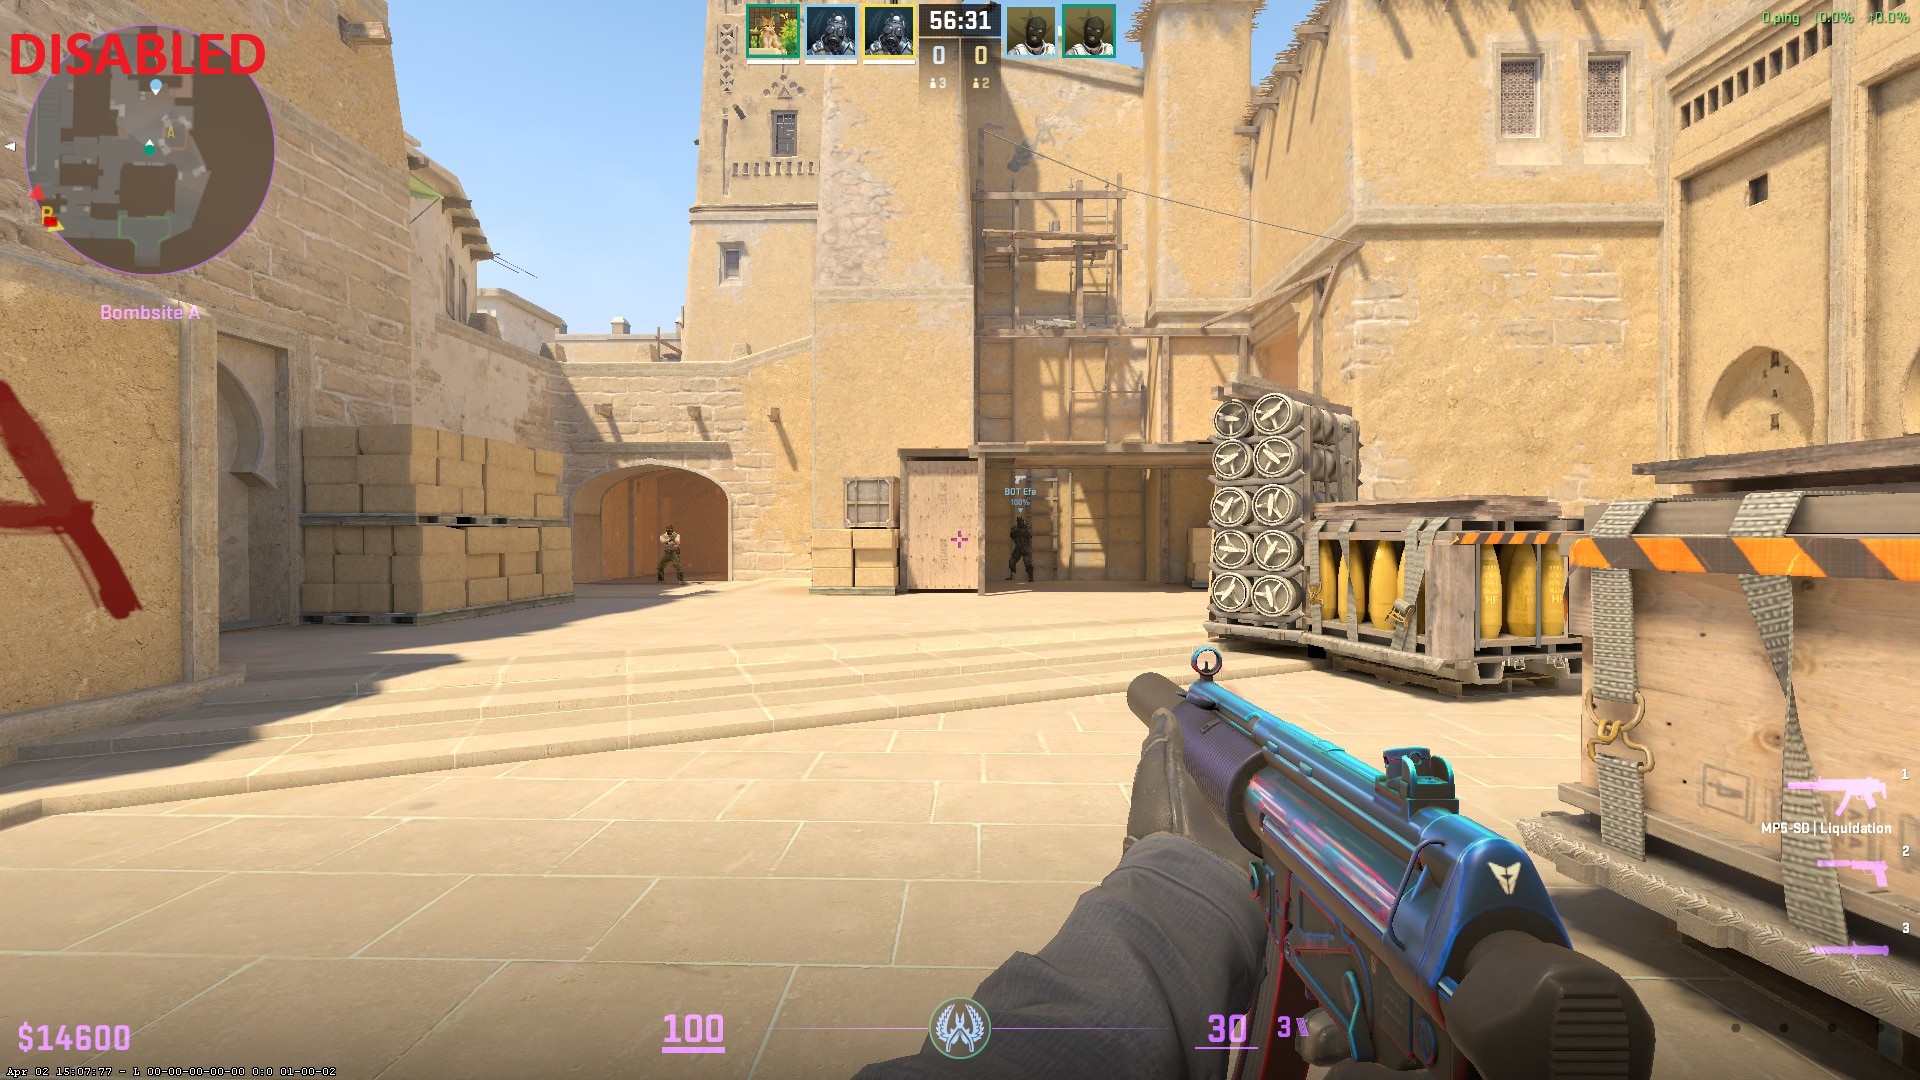
Enabled:
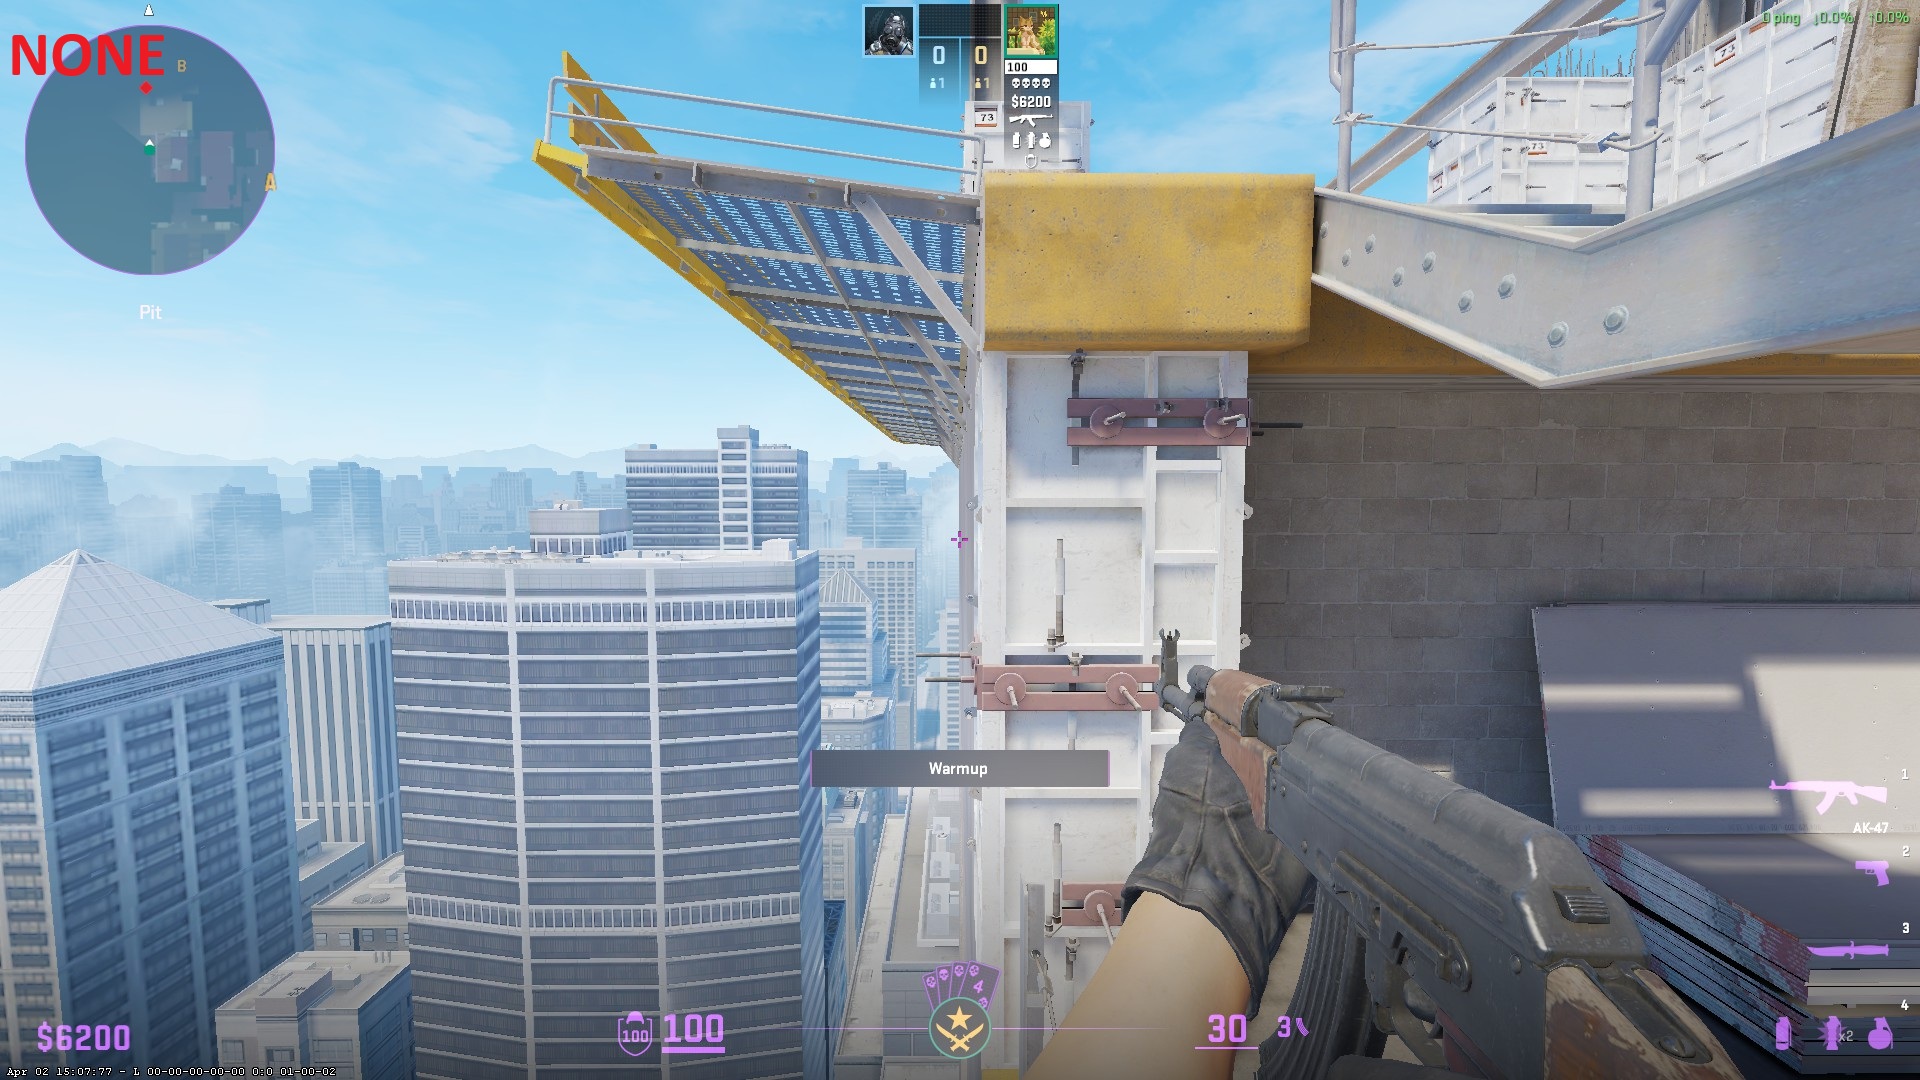
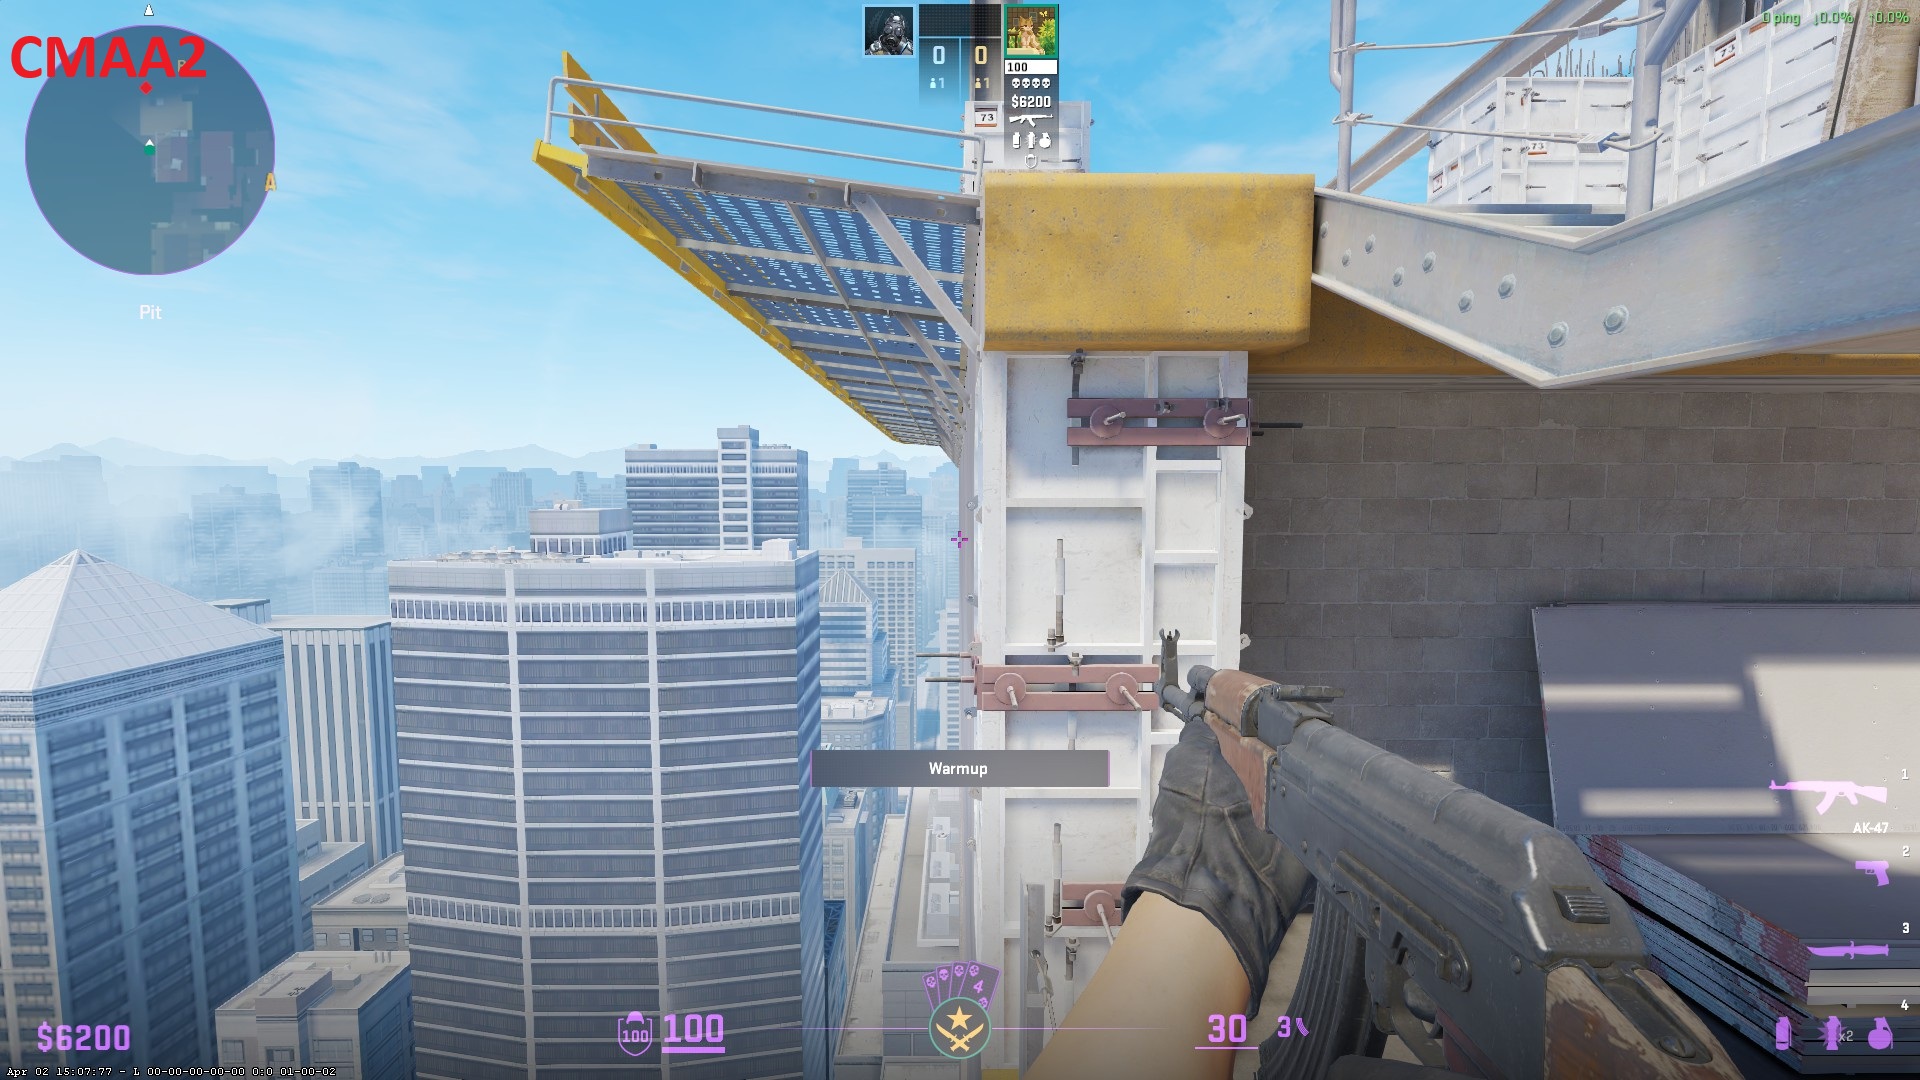
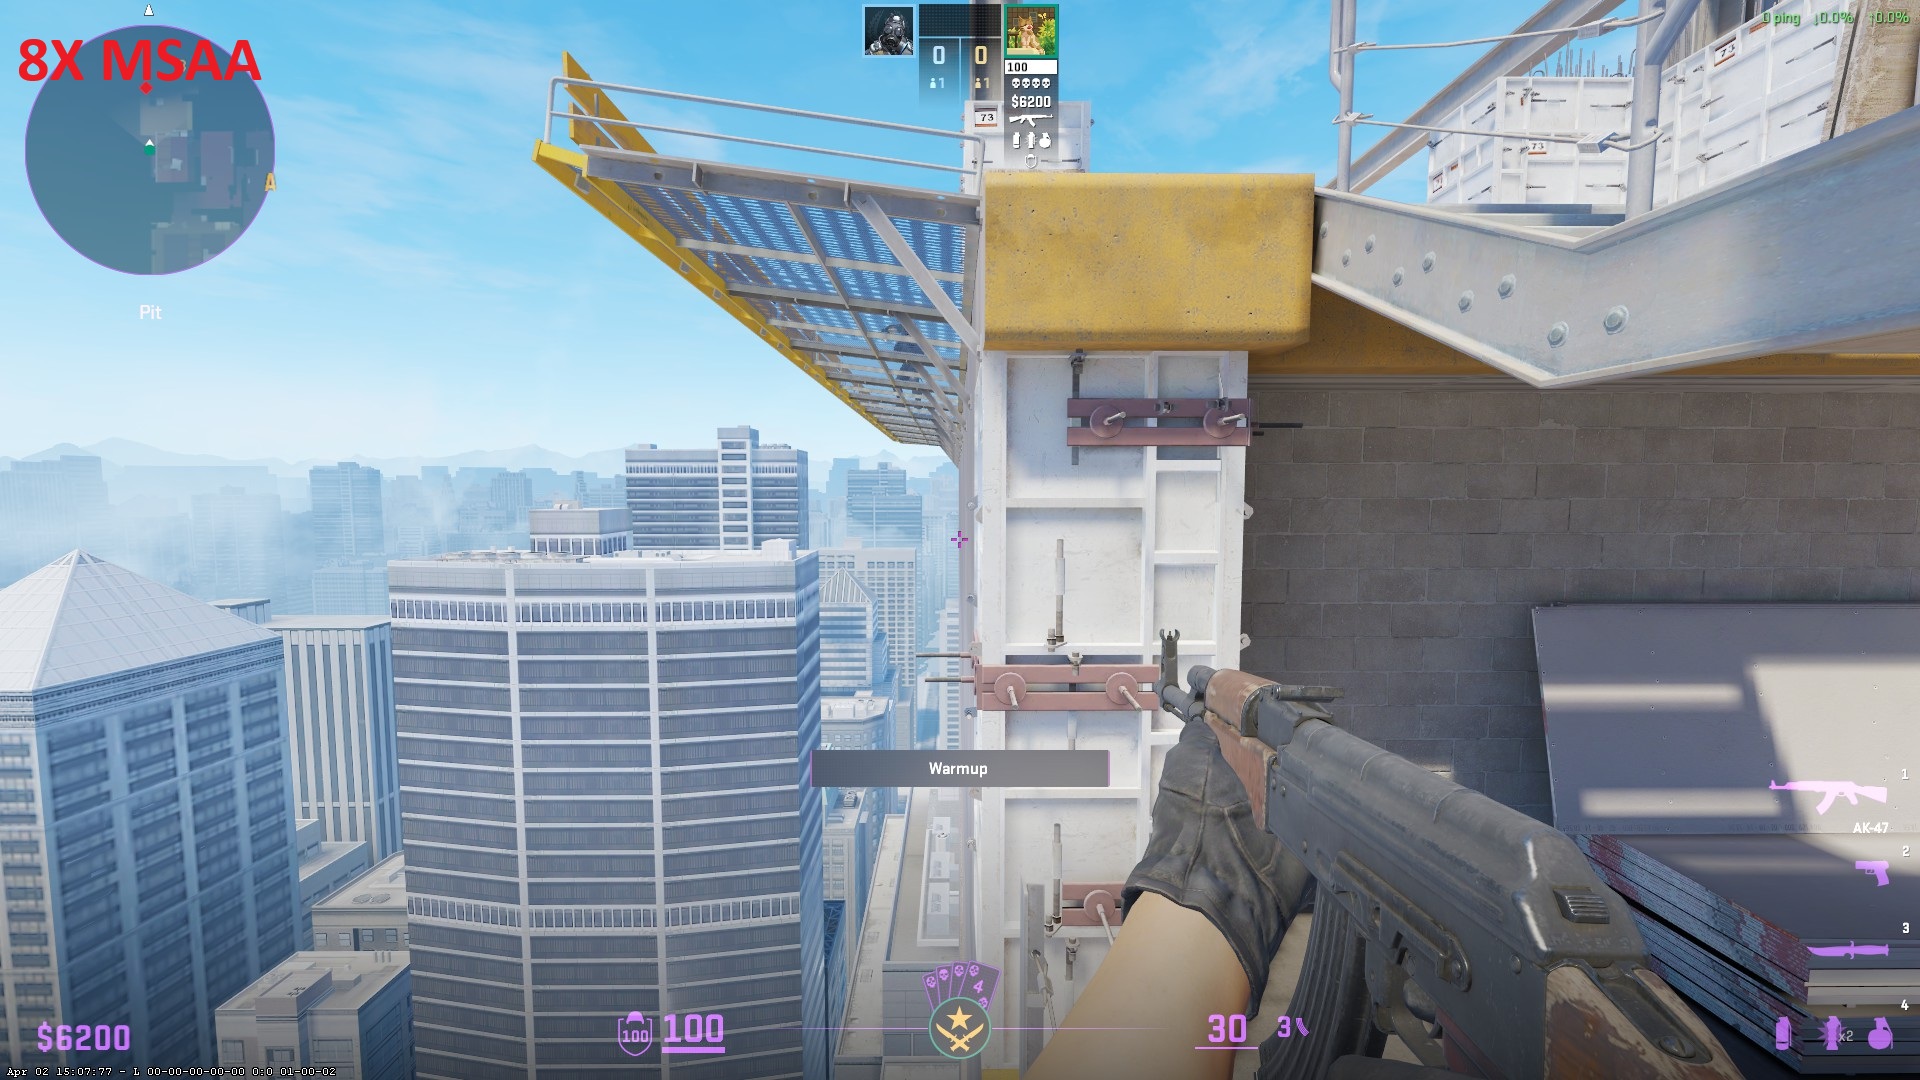
This is one of the most taxing settings in the game. While setting it to "None" yields the highest raw FPS, we are forced to use MSAA for gameplay reasons. Without MSAA, visibility is severely compromised in specific scenarios (for example, trying to spot an enemy standing behind the metal catwalk grates on de_Vertigo).
CMAA2 should be avoided as it provides no tangible benefits. While MSAA is mandatory for visual clarity, pushing it to 4x or 8x MSAA offers diminishing returns and heavily tanks your framerate without giving you any extra competitive advantage.
- 🏆 Recommended Setting: 2X MSAA
📸 Click to view screenshot comparison
None:
 CMAA2:
 2x MSAA:
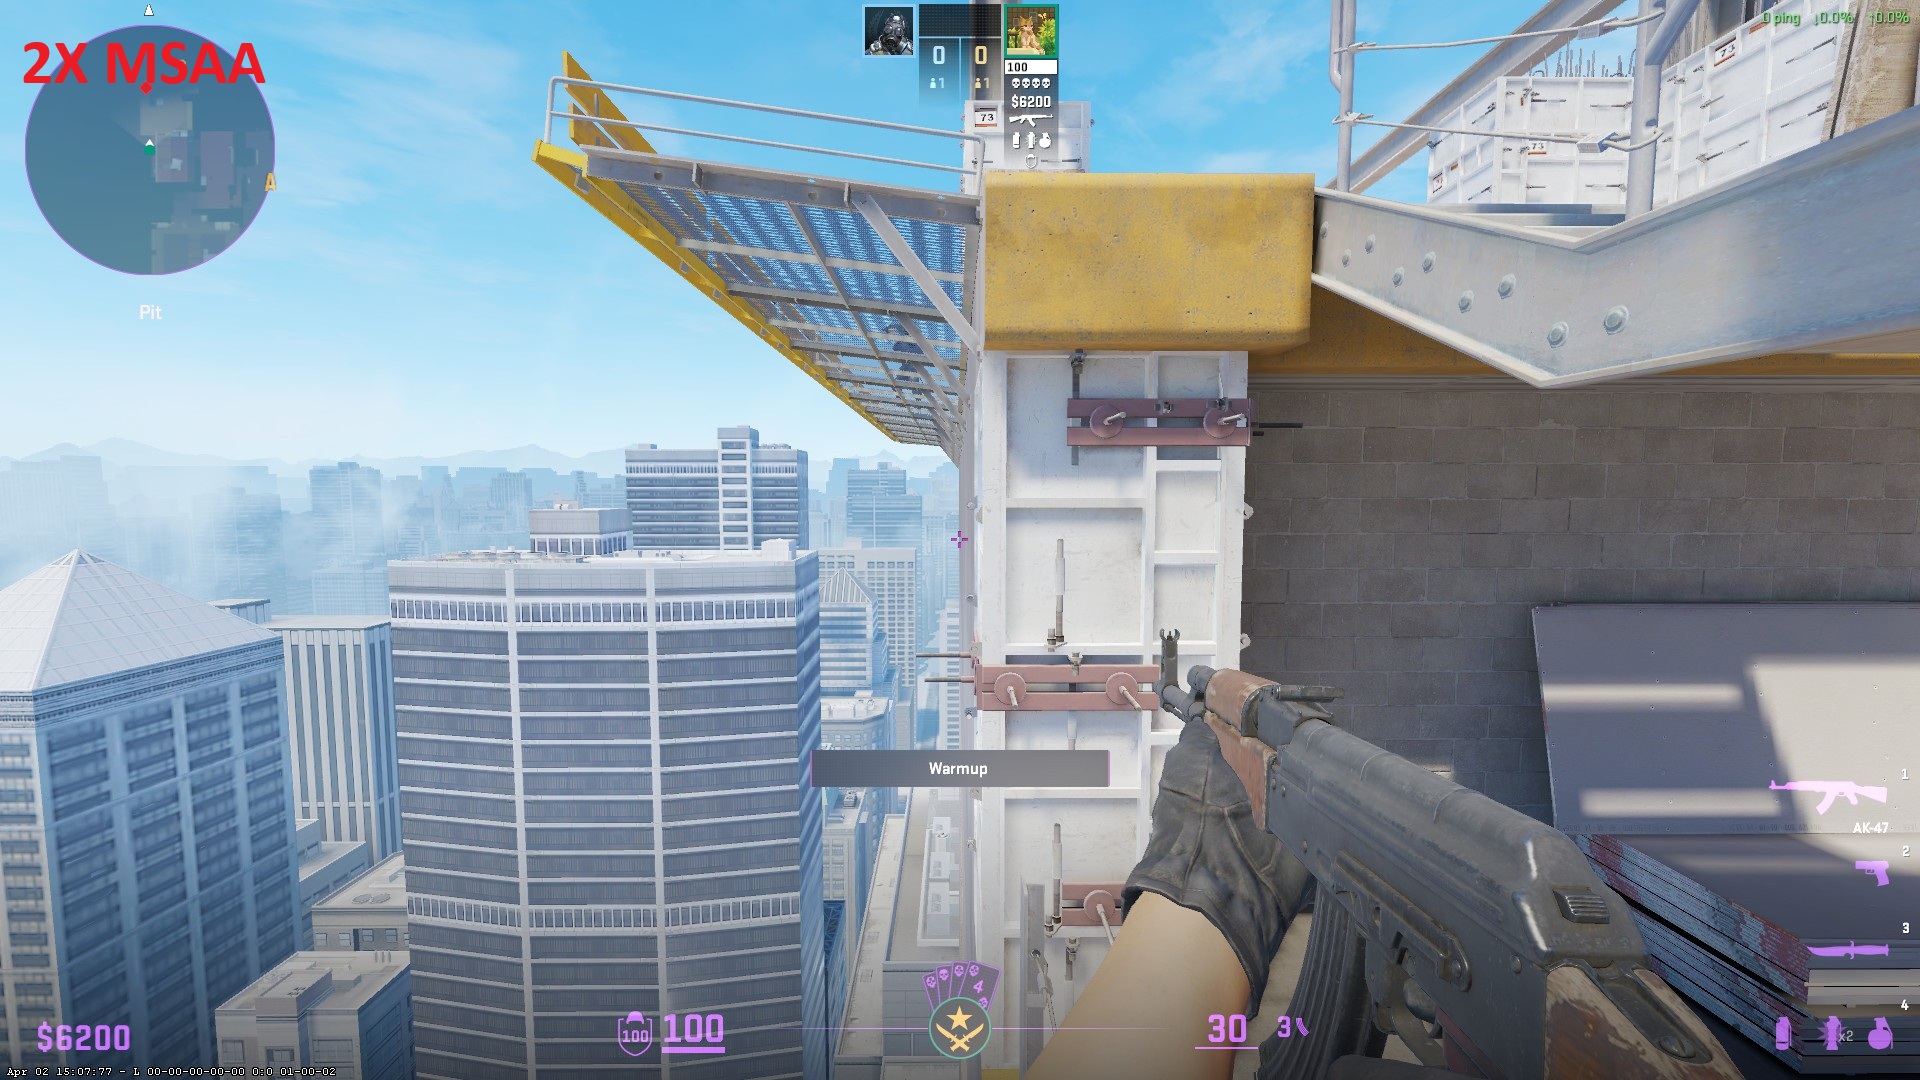 8x MSAA:
This setting is a massive FPS drain. There is a persistent myth from the CS:GO era and the early CS2 beta that you must play on "High" to see enemy shadows correctly. Valve has fixed this. Setting this to "Low" renders the exact same critical player shadows as "Very High." The only difference is aesthetic resolution. "Very High" will devastate your framerate even on powerful modern GPUs.
- 🏆 Recommended Setting: Low
📸 Click to view screenshot comparison
Low:
Very High:
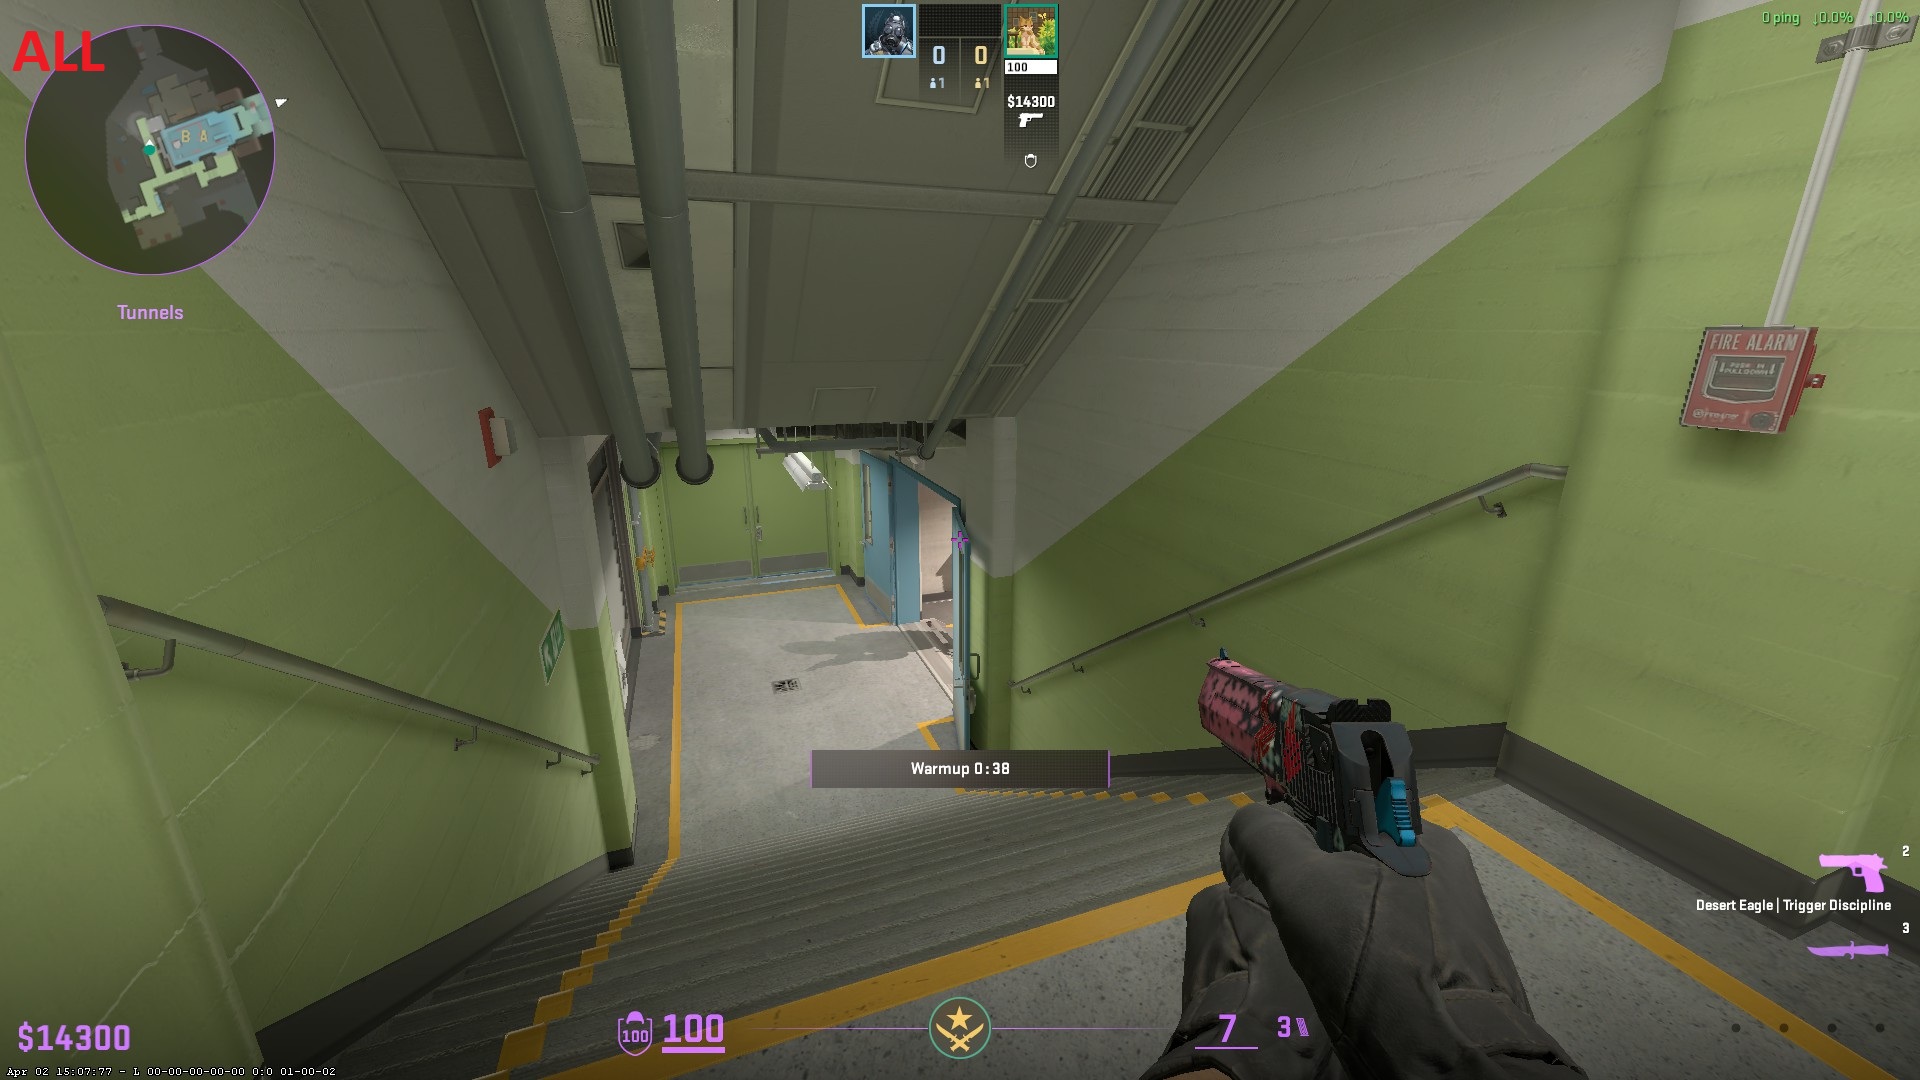
Unlike Global Shadow Quality, this setting is critical for competitive play. If you set this to "Sun Only," the game will stop rendering shadows cast by local light sources (like lamps or fires). This means an enemy could be standing right around a corner, and you will not see their shadow. Setting it to "All" ensures you always receive this vital visual information.
- 🏆 Recommended Setting: All
📸 Click to view screenshot comparison
Sun Only:
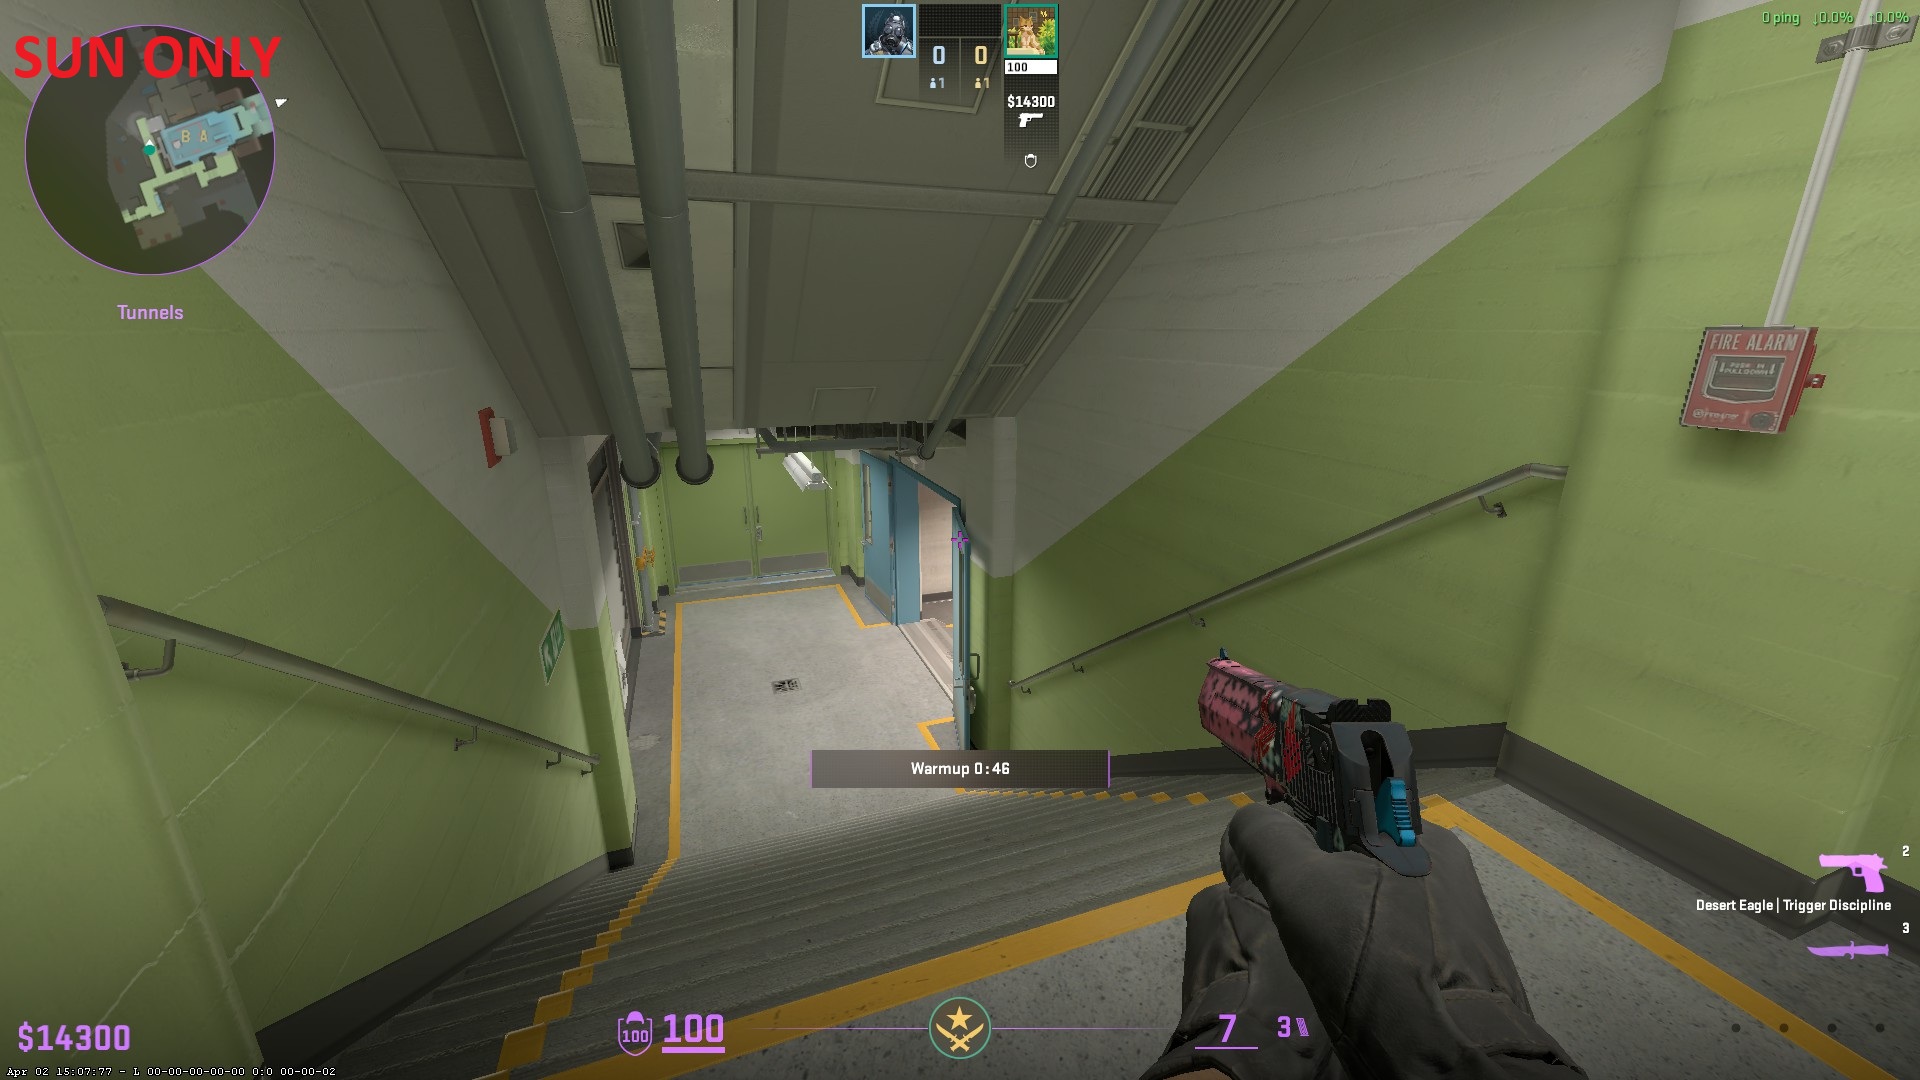
All:
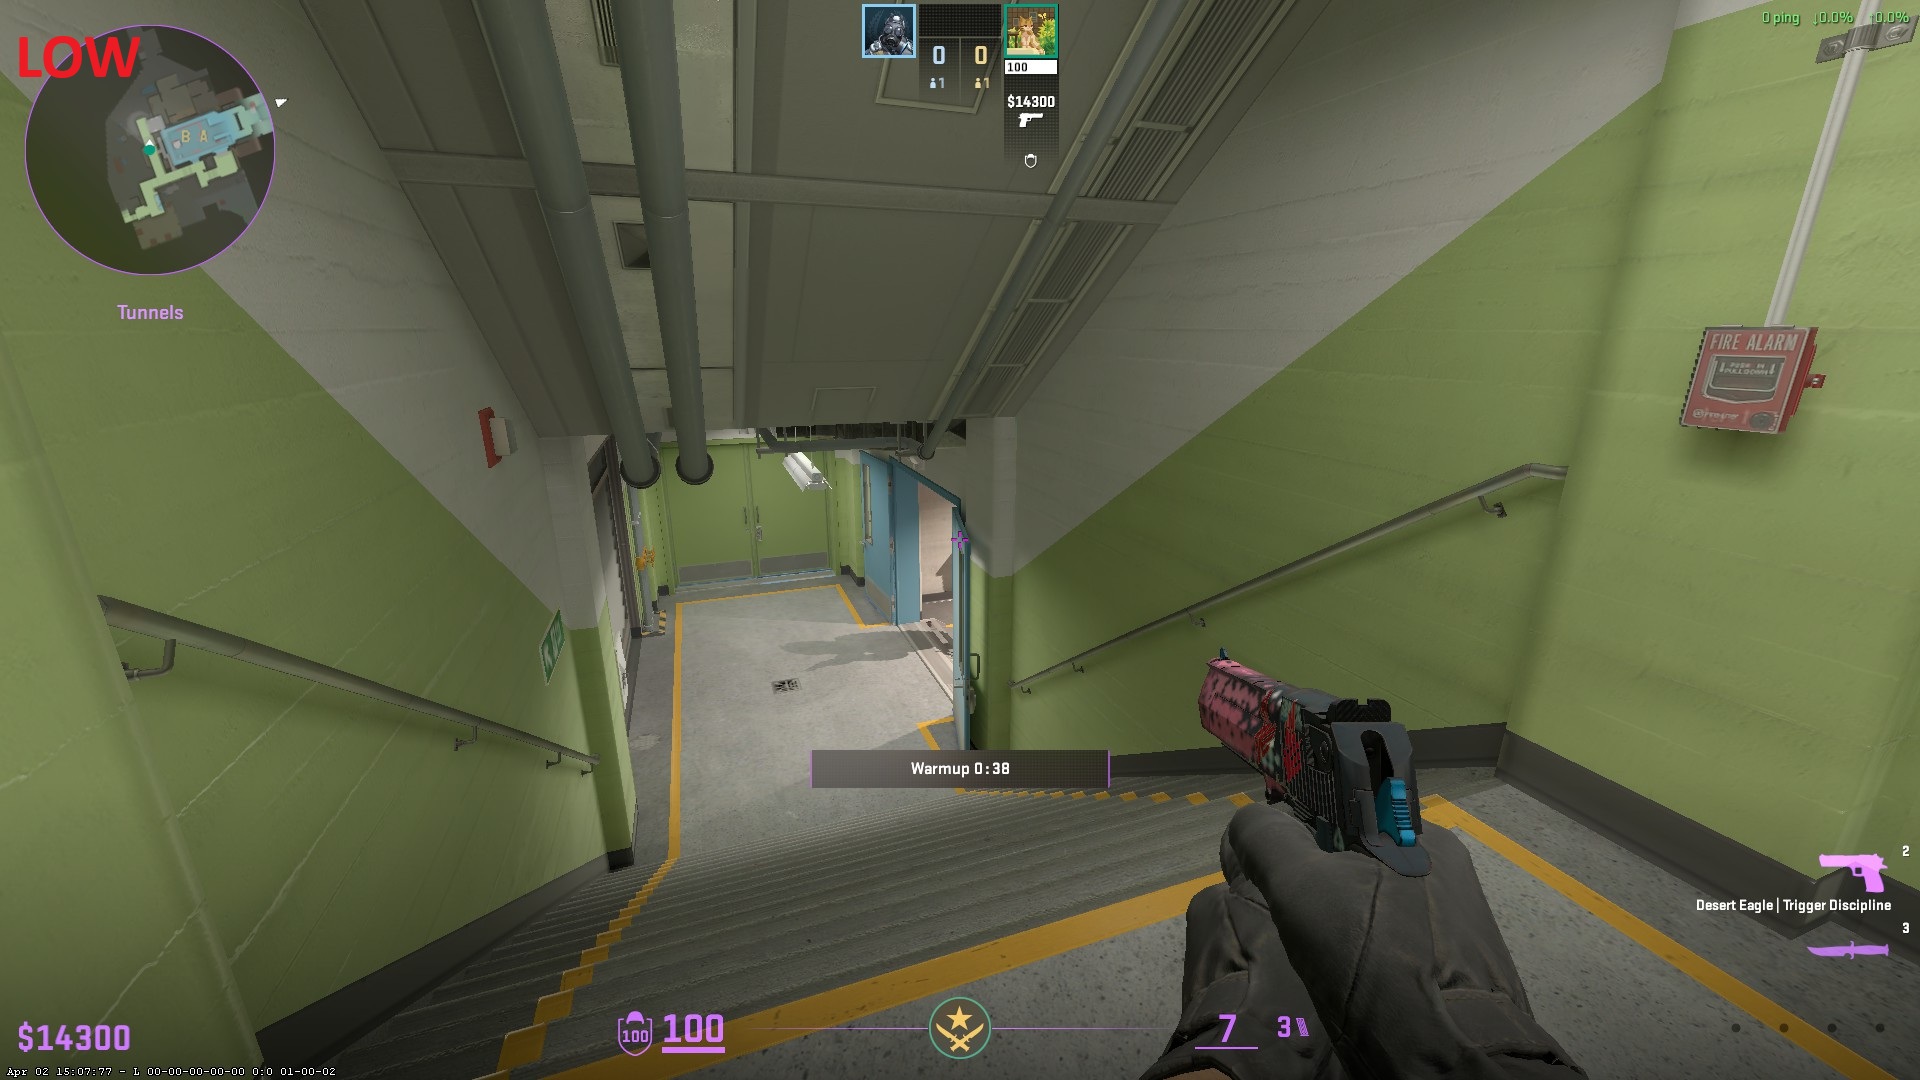
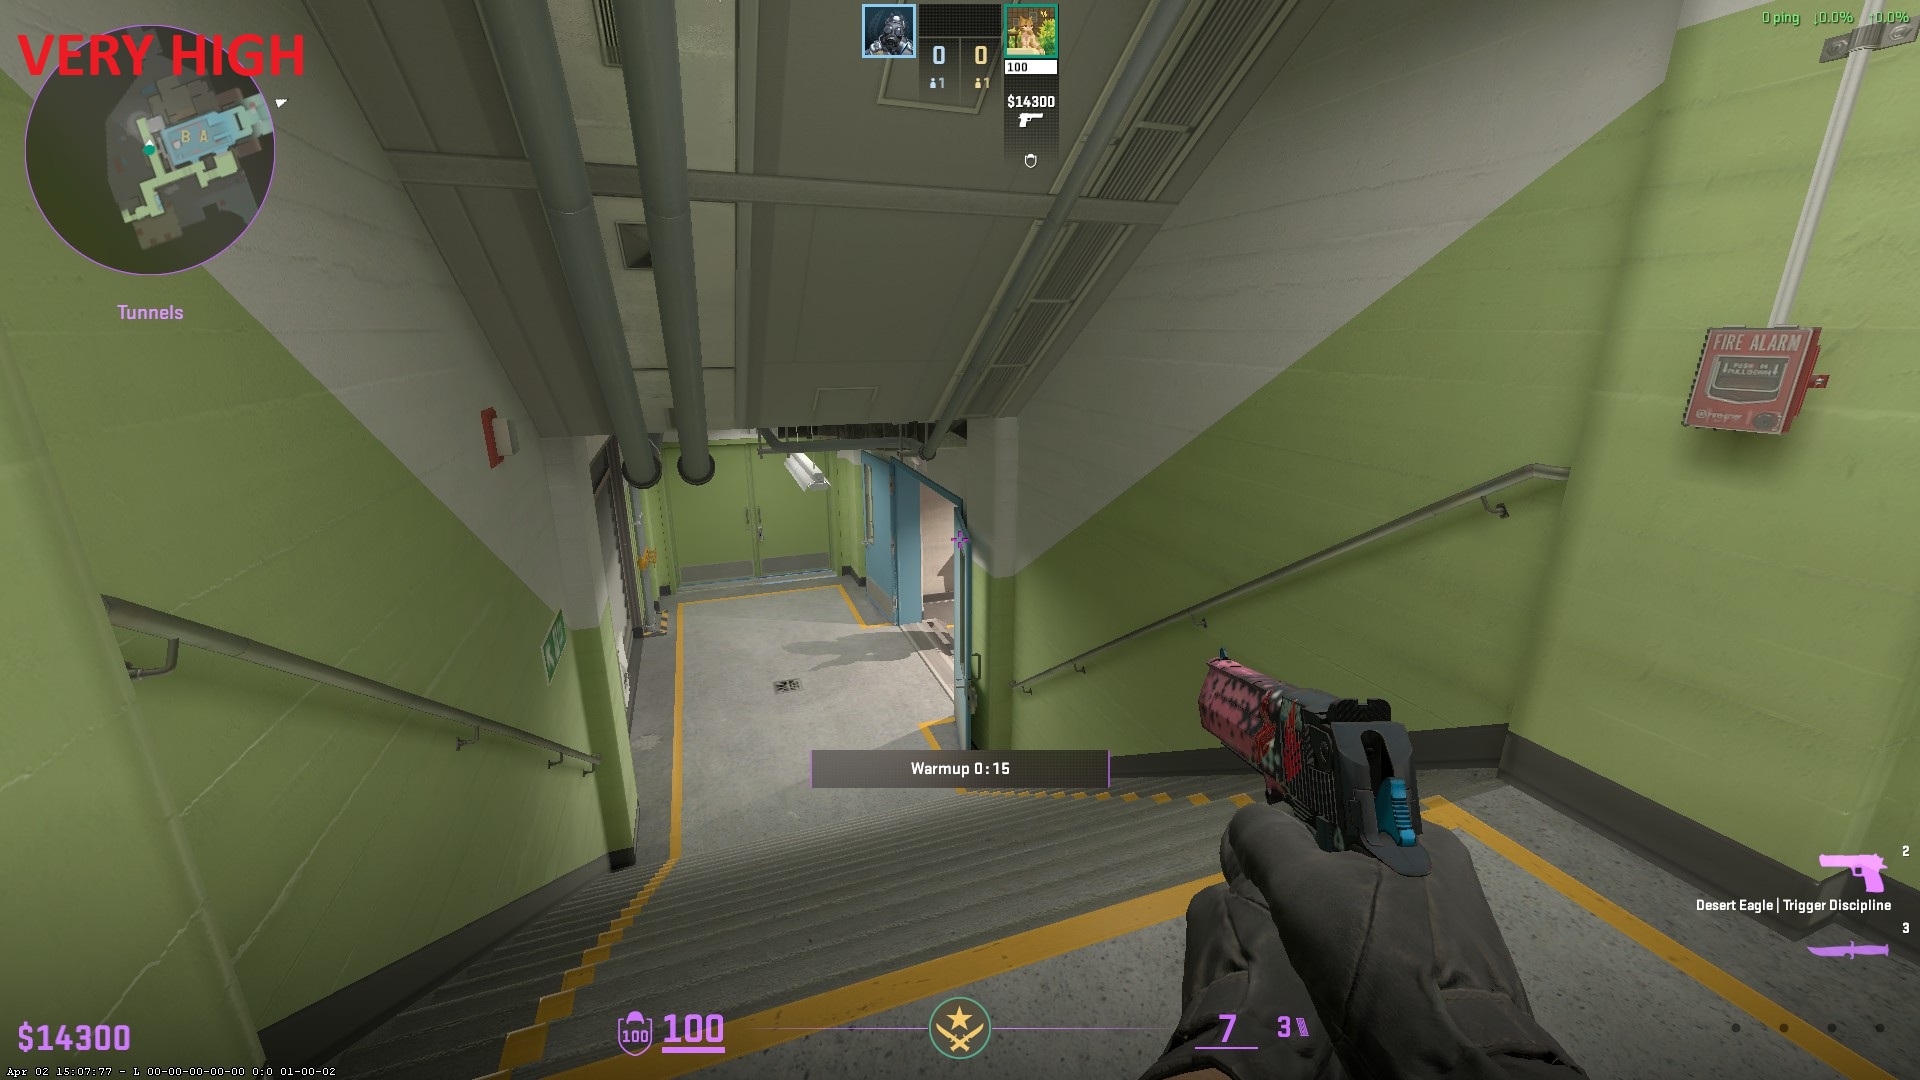
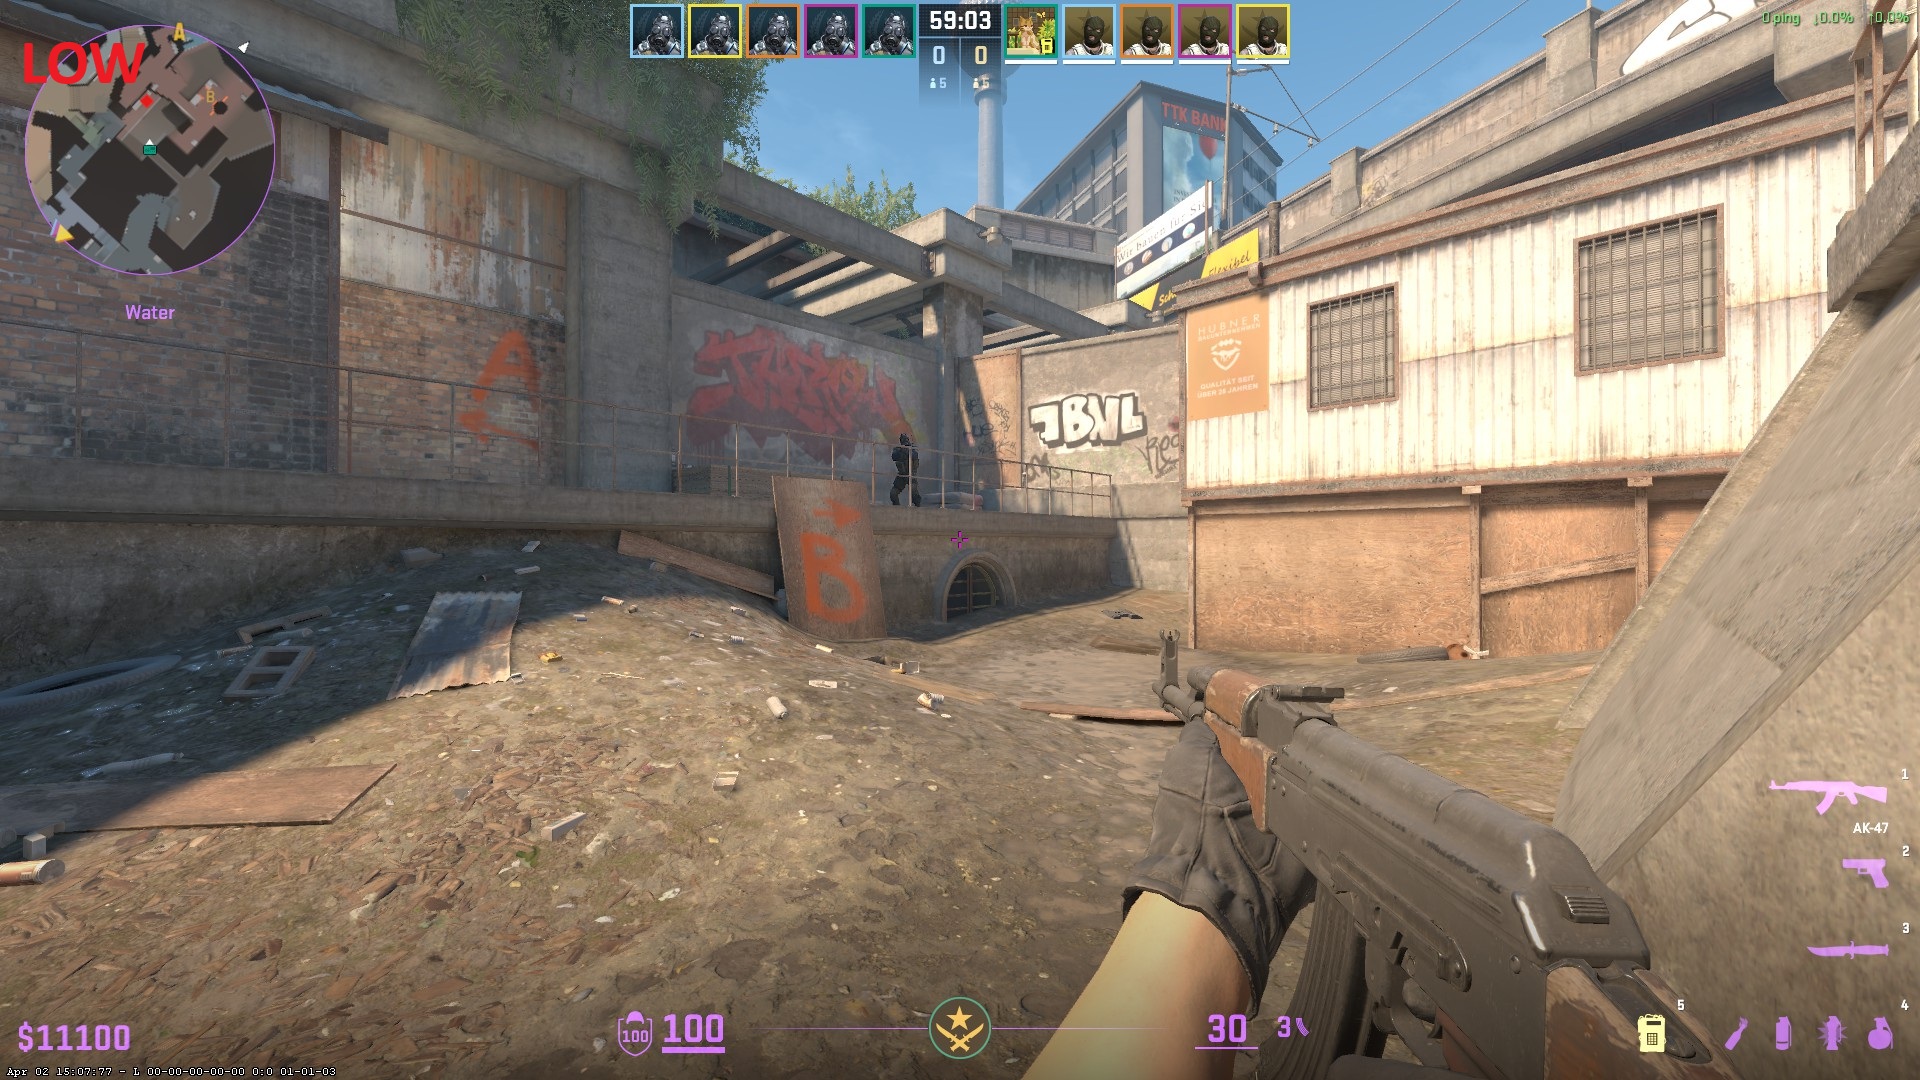
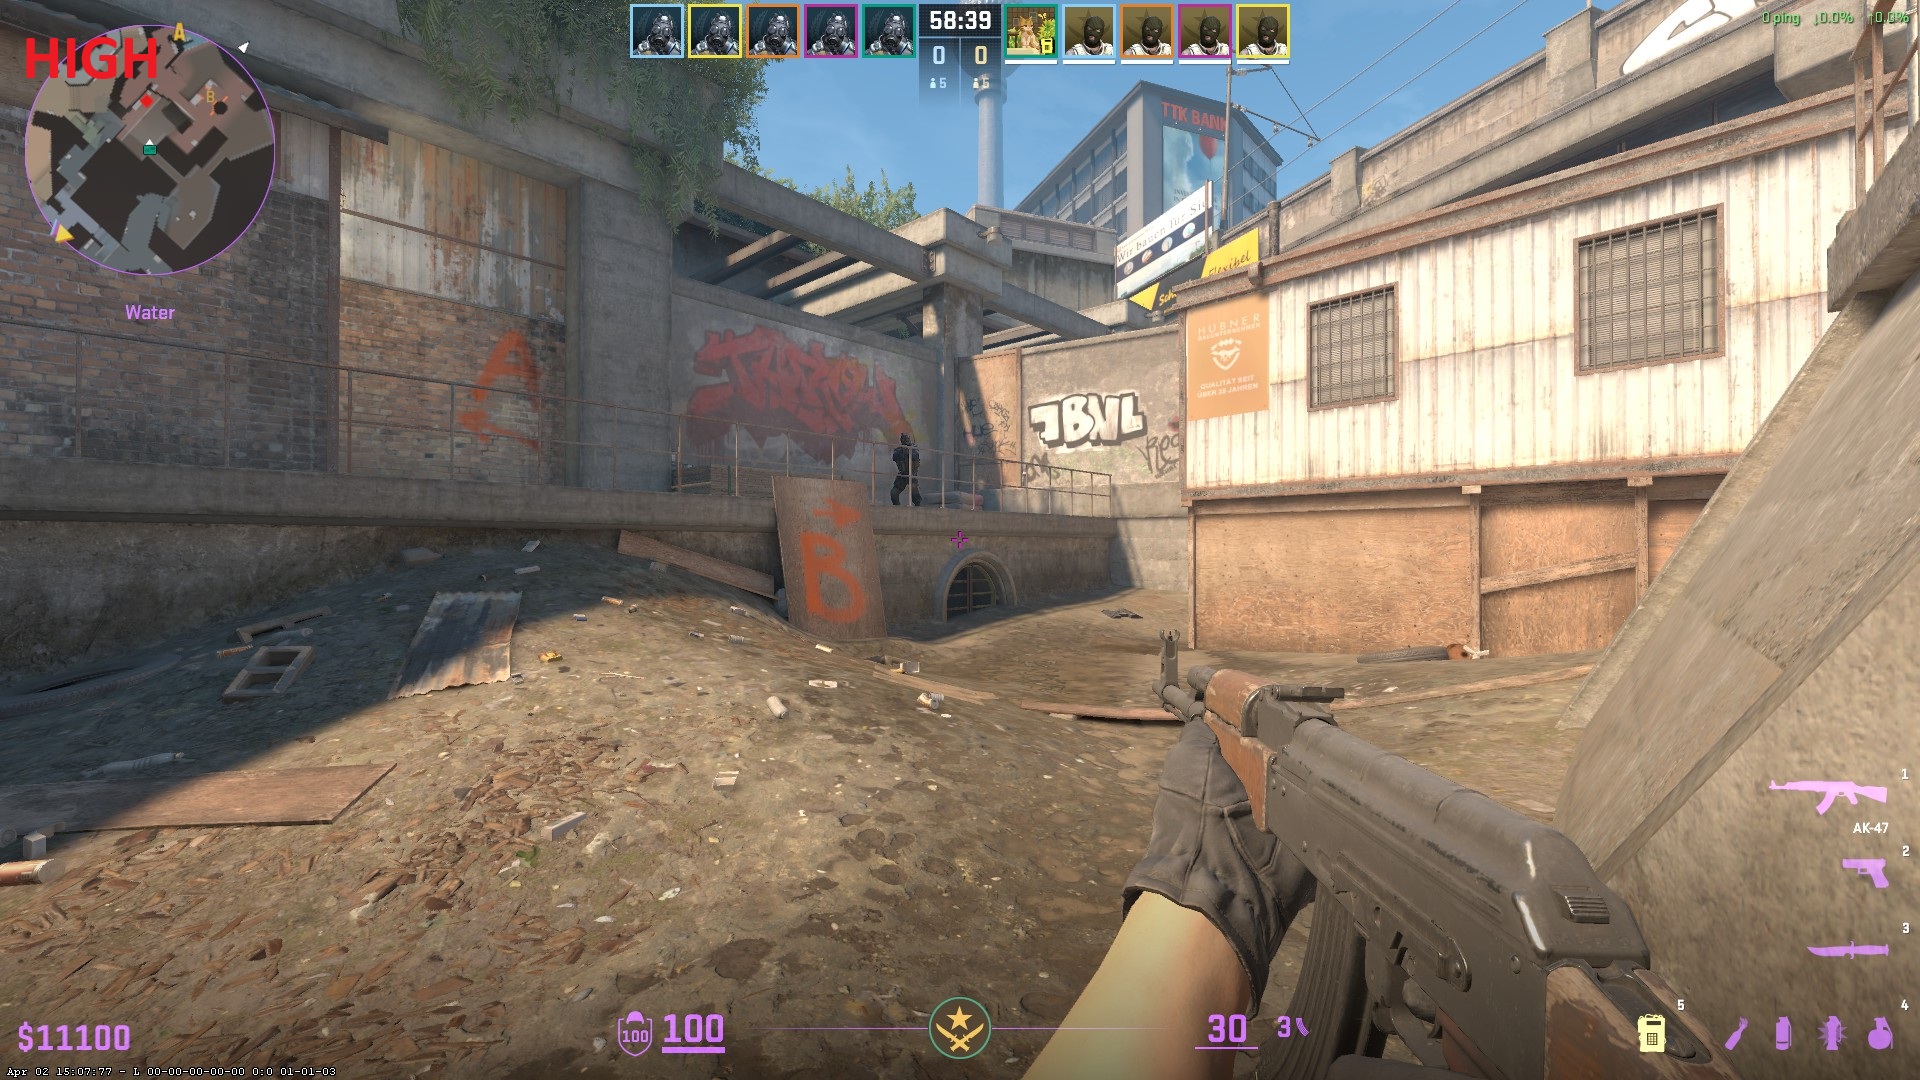
Despite what you might expect, this setting has a noticeable impact on performance, especially on older GPUs (though still measurable on high-end hardware). Increasing this to High provides absolutely zero competitive advantage. It purely enhances the visual fidelity of walls and objects. In a competitive environment, visual distractions should be minimized.
- 🏆 Recommended Setting: Low
📸 Click to view screenshot comparison
Low:
High:
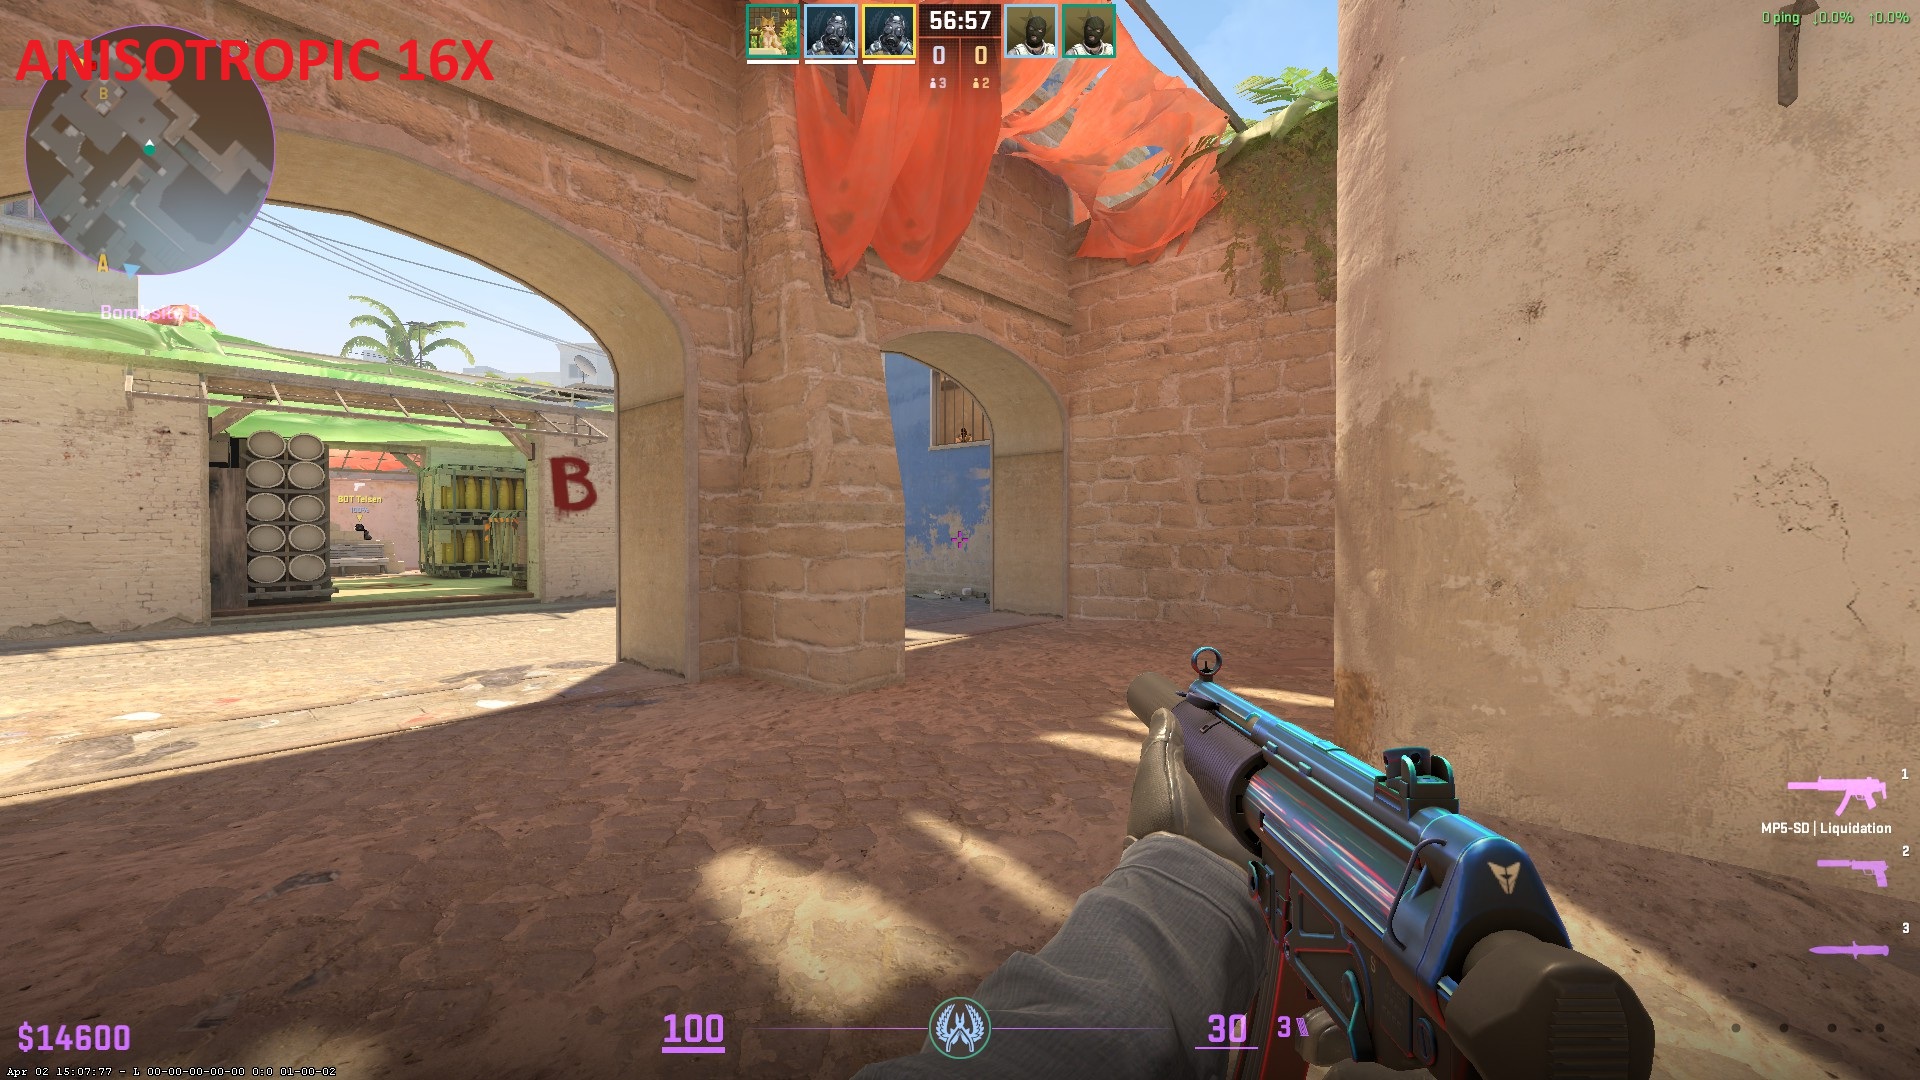
The performance difference between Bilinear (979 Avg FPS) and Anisotropic 16x (971 Avg FPS) is incredibly small. However, the visual clarity difference is massive.
Using Bilinear severely blurs textures when viewed at sharp angles. This makes distant enemies (such as a head peeking over a box) very difficult to see. Anisotropic 2x provides a massive leap in visual clarity at a distance with almost no FPS cost. If you have a powerful PC, you can confidently use Anisotropic 16x without losing any noticeable performance. Players on very low, stretched resolutions (like 1024x768) should especially consider using 16x to regain some much-needed texture clarity. That being said, for the vast majority of setups, Anisotropic 2x remains the perfect sweet spot for balancing maximum visibility and top-tier frame rates. (Note: Completely avoid Trilinear due to stutter issues).
- 🏆 Recommended Setting: Anisotropic 2X (or 16X for high-end PCs / low resolutions)
📸 Click to view screenshot comparison
Bilinear:
 Anisotropic 2x:
 Anisotropic 16x:
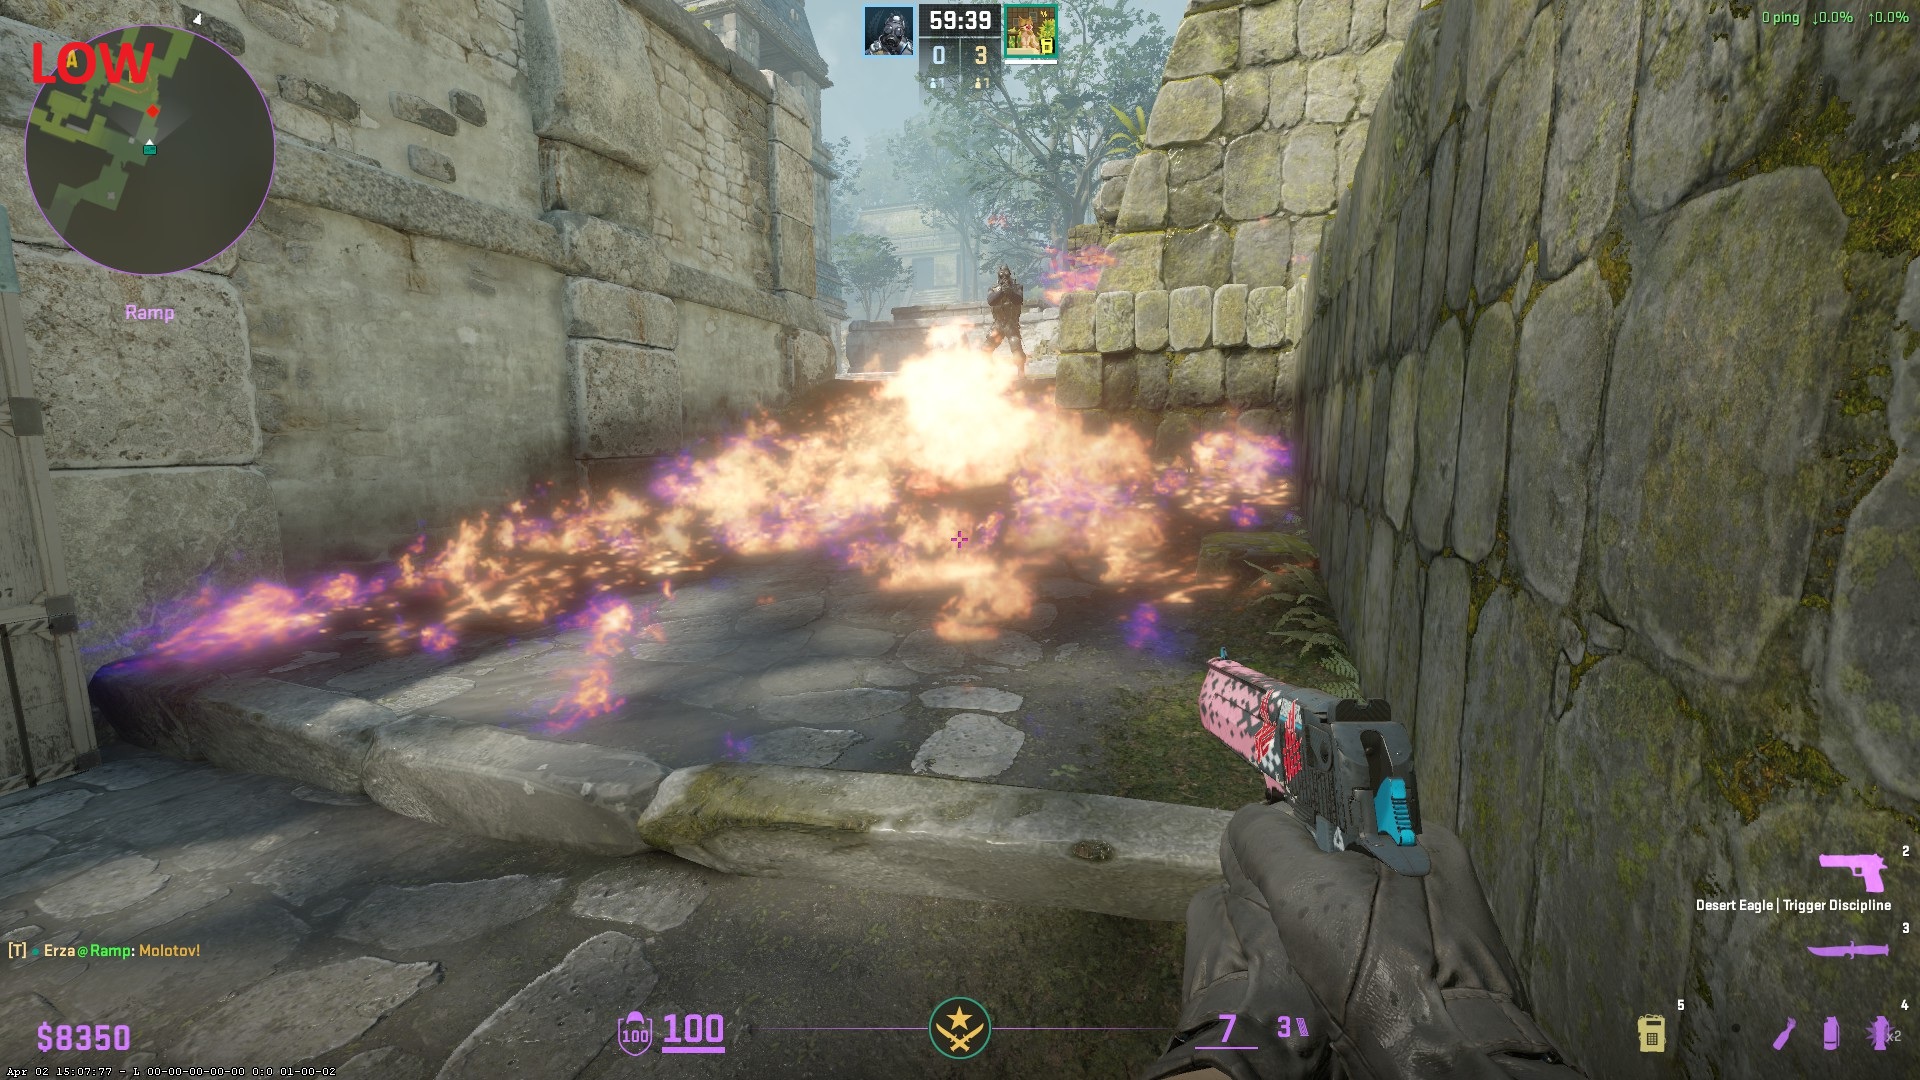
This is a strictly visual setting. In CS:GO, Shader Detail actually affected how well you could see through molotov flames, but that is no longer the case in CS2. Turning this to High will cost you frames for no gameplay benefit. The only reason to raise this setting is if you want your weapon skins to look shinier and more detailed. For pure competitive performance, keep it low.
- 🏆 Recommended Setting: Low
📸 Click to view screenshot comparison
Low:
High:
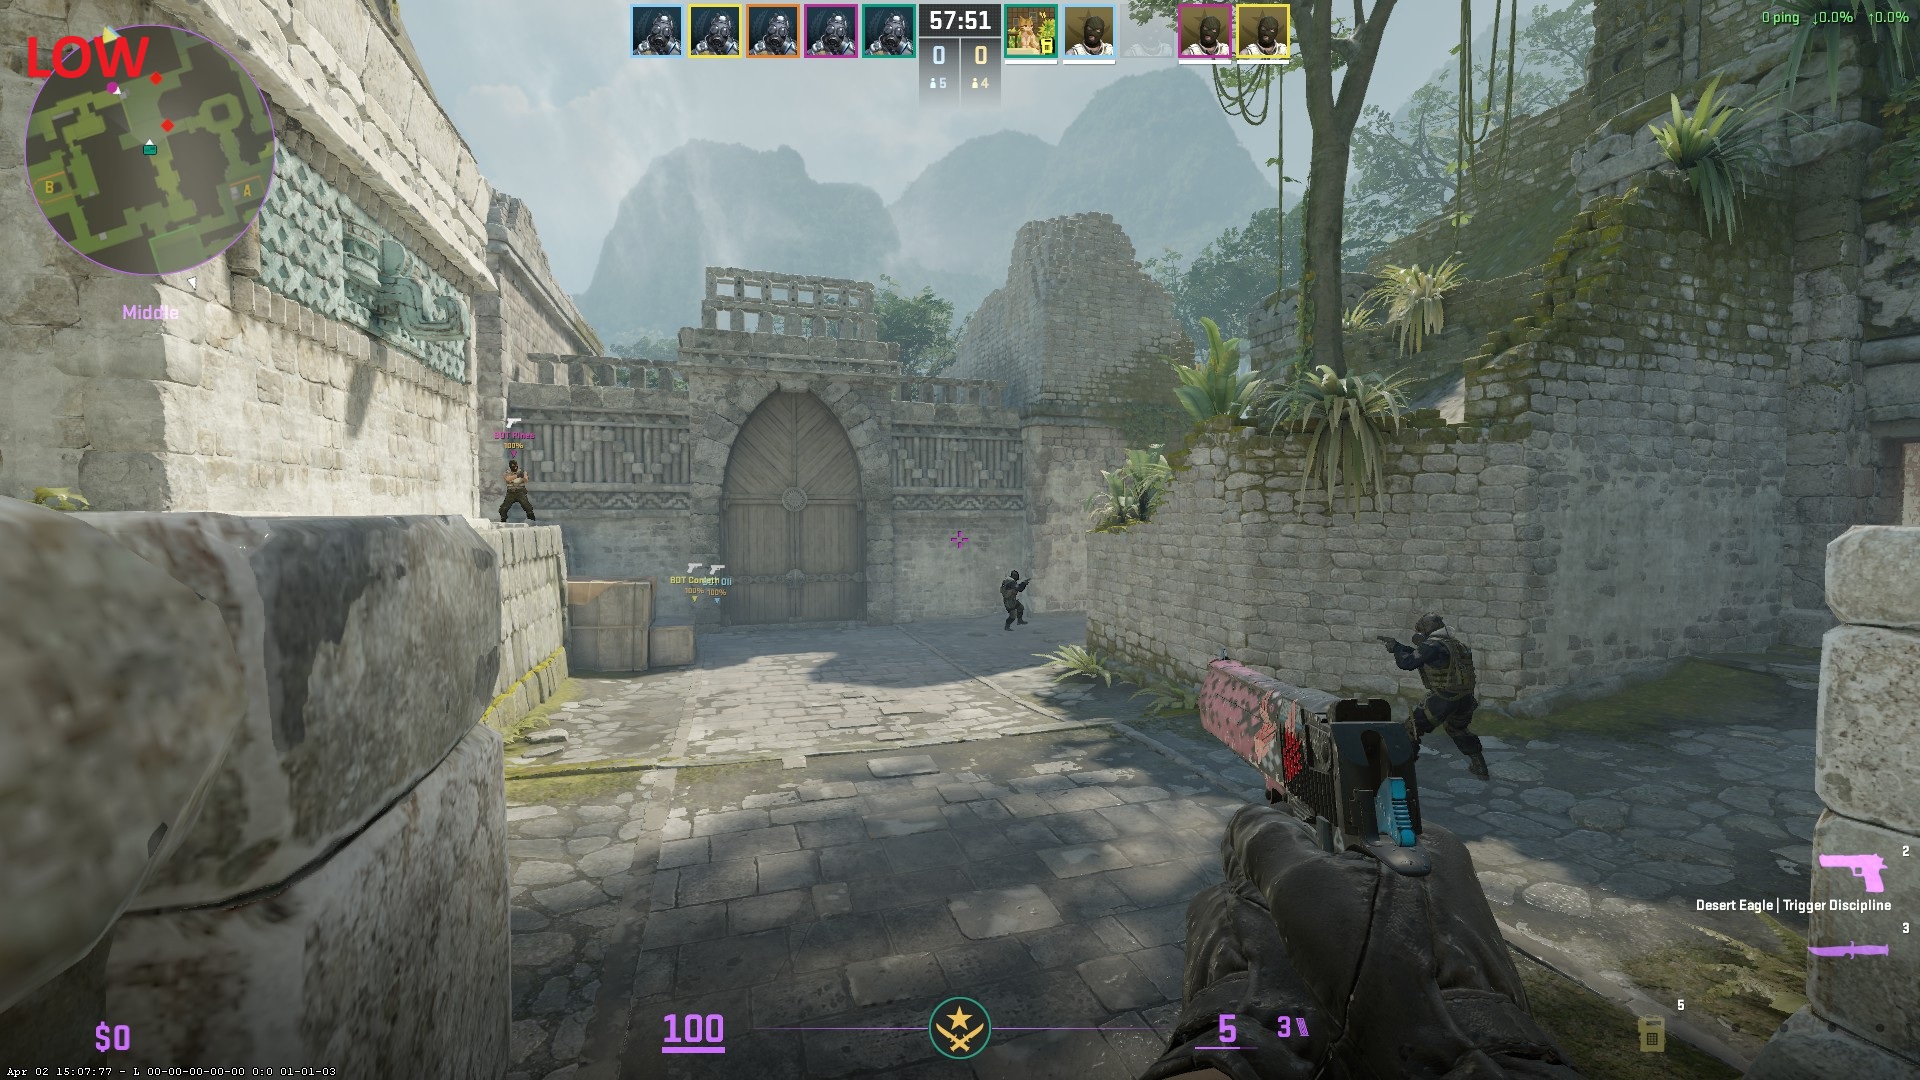
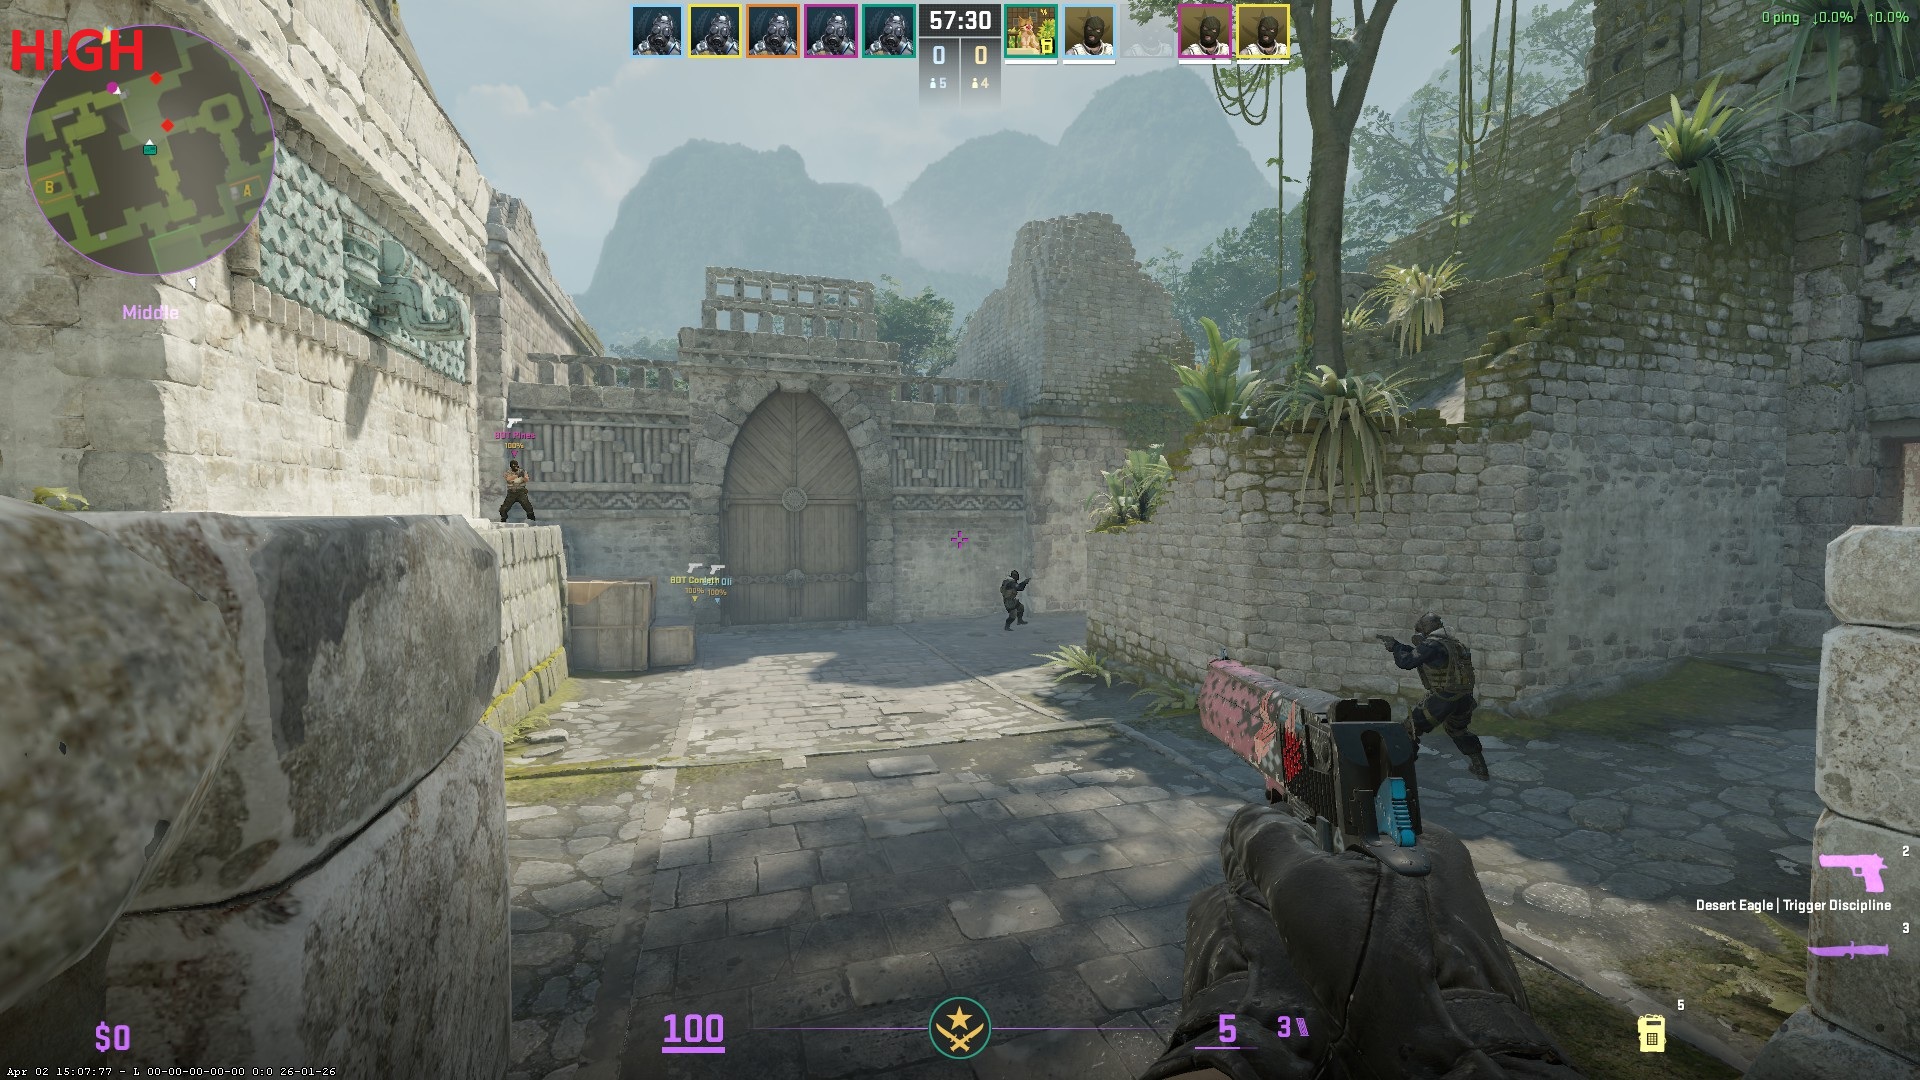
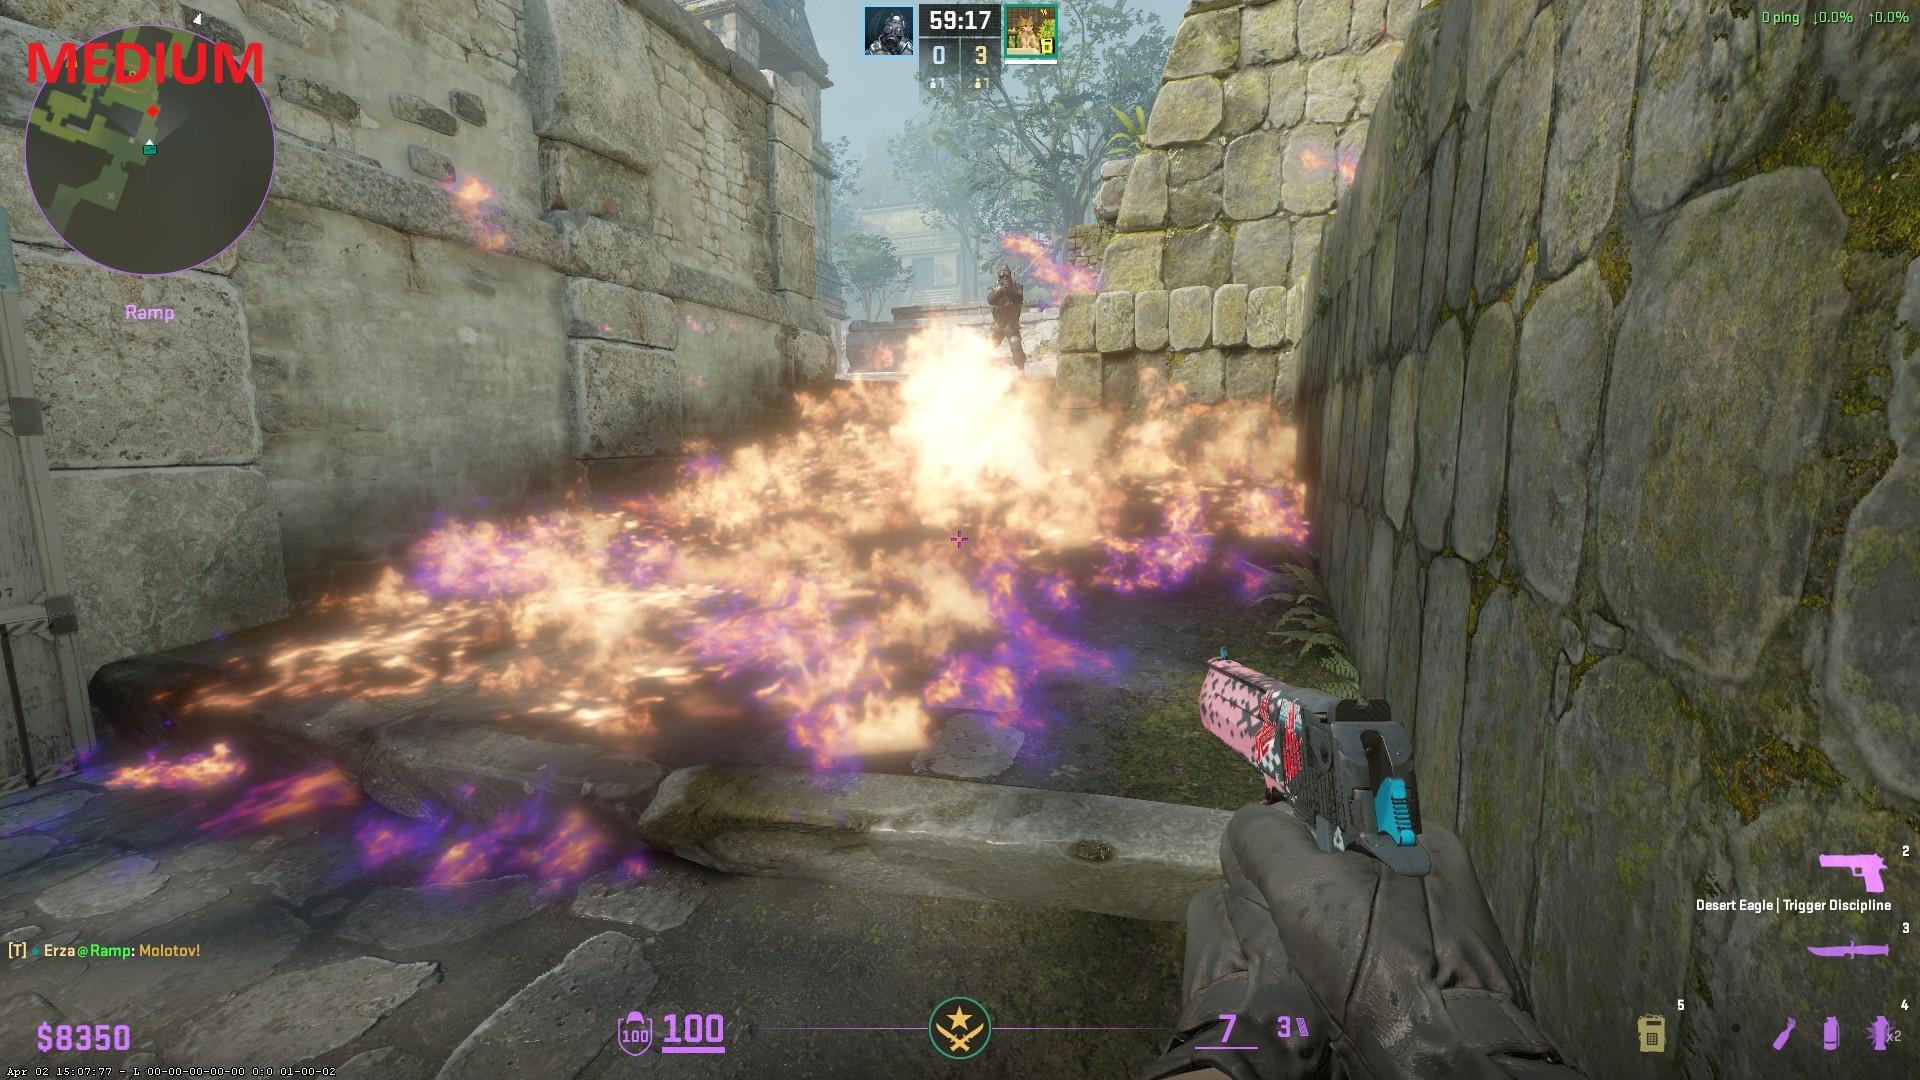
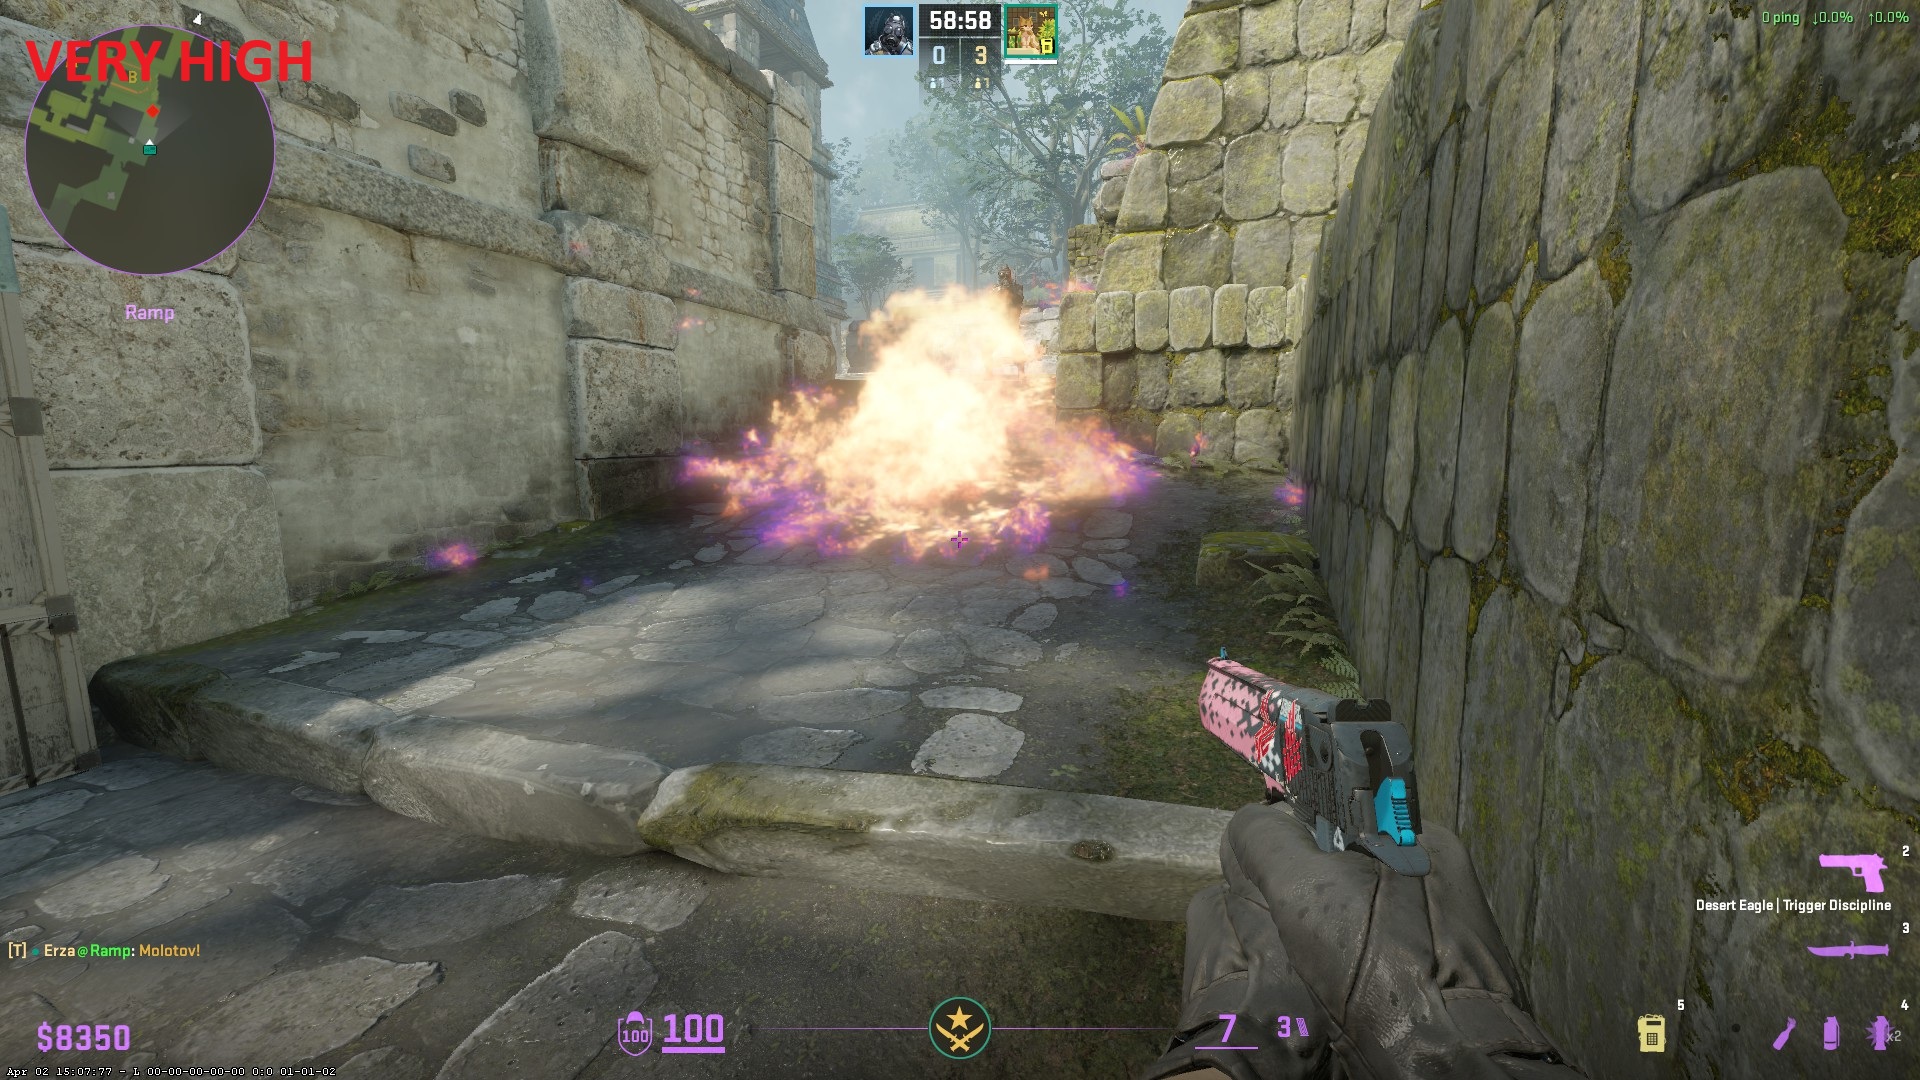
This is a critical setting for optimization. It eats a staggering amount of framerate—dropping nearly 100 FPS on average when moved from Low to Very High.
There are rumors that higher Particle Detail makes it easier to see through HE grenade explosions or molotovs. Extensive testing proves this false. Higher settings provide zero visibility advantages; they merely add extra debris and fluff that clutter your screen and drastically reduce your FPS.
- 🏆 Recommended Setting: Low
📸 Click to view screenshot comparison
Low:
 Medium:
 Very High:
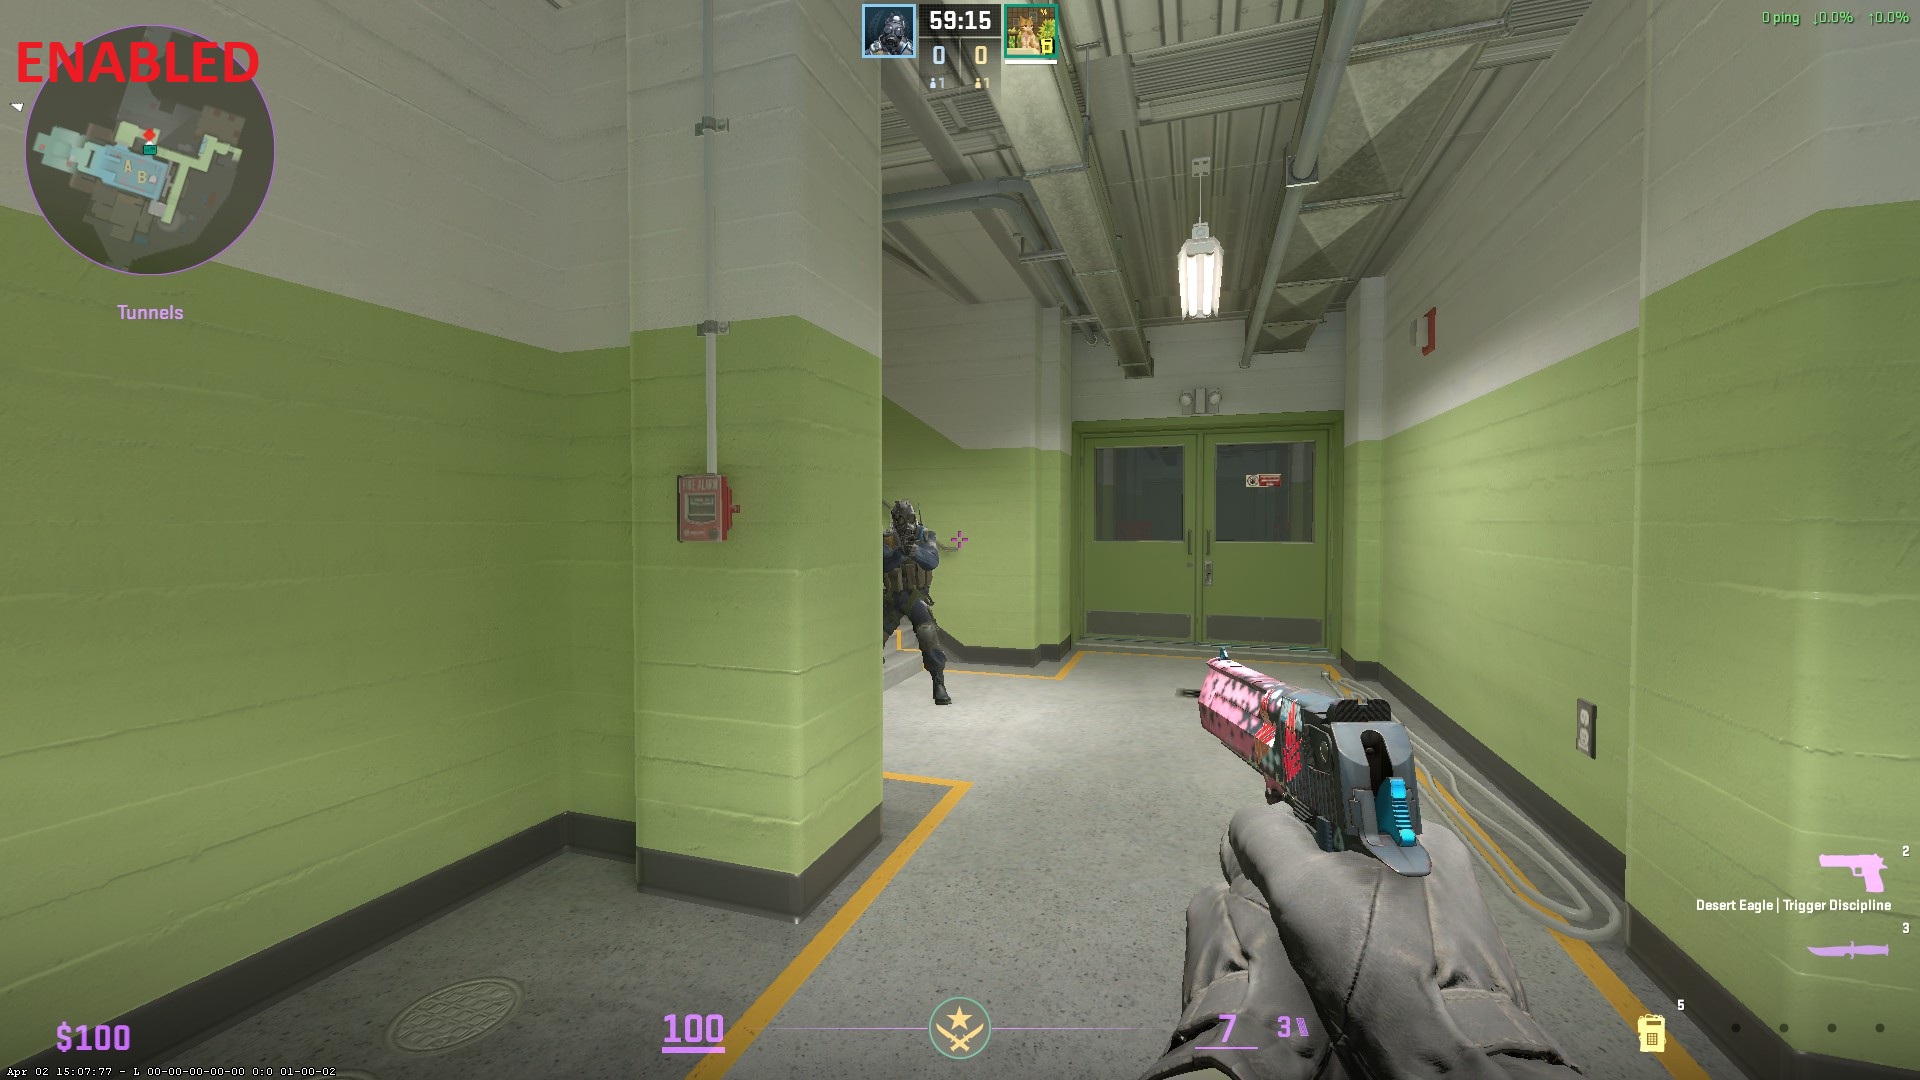
Here is another debunked myth. During the early days of CS2, playing with AO enabled would sometimes cause enemy shadows to leak through walls before they peeked. Valve patched this exploit long ago. Today, AO is purely a cosmetic effect that adds soft contact shadows to corners. Because it serves no competitive purpose, it should be turned off.
- 🏆 Recommended Setting: Disabled
📸 Click to view screenshot comparison
Disabled:
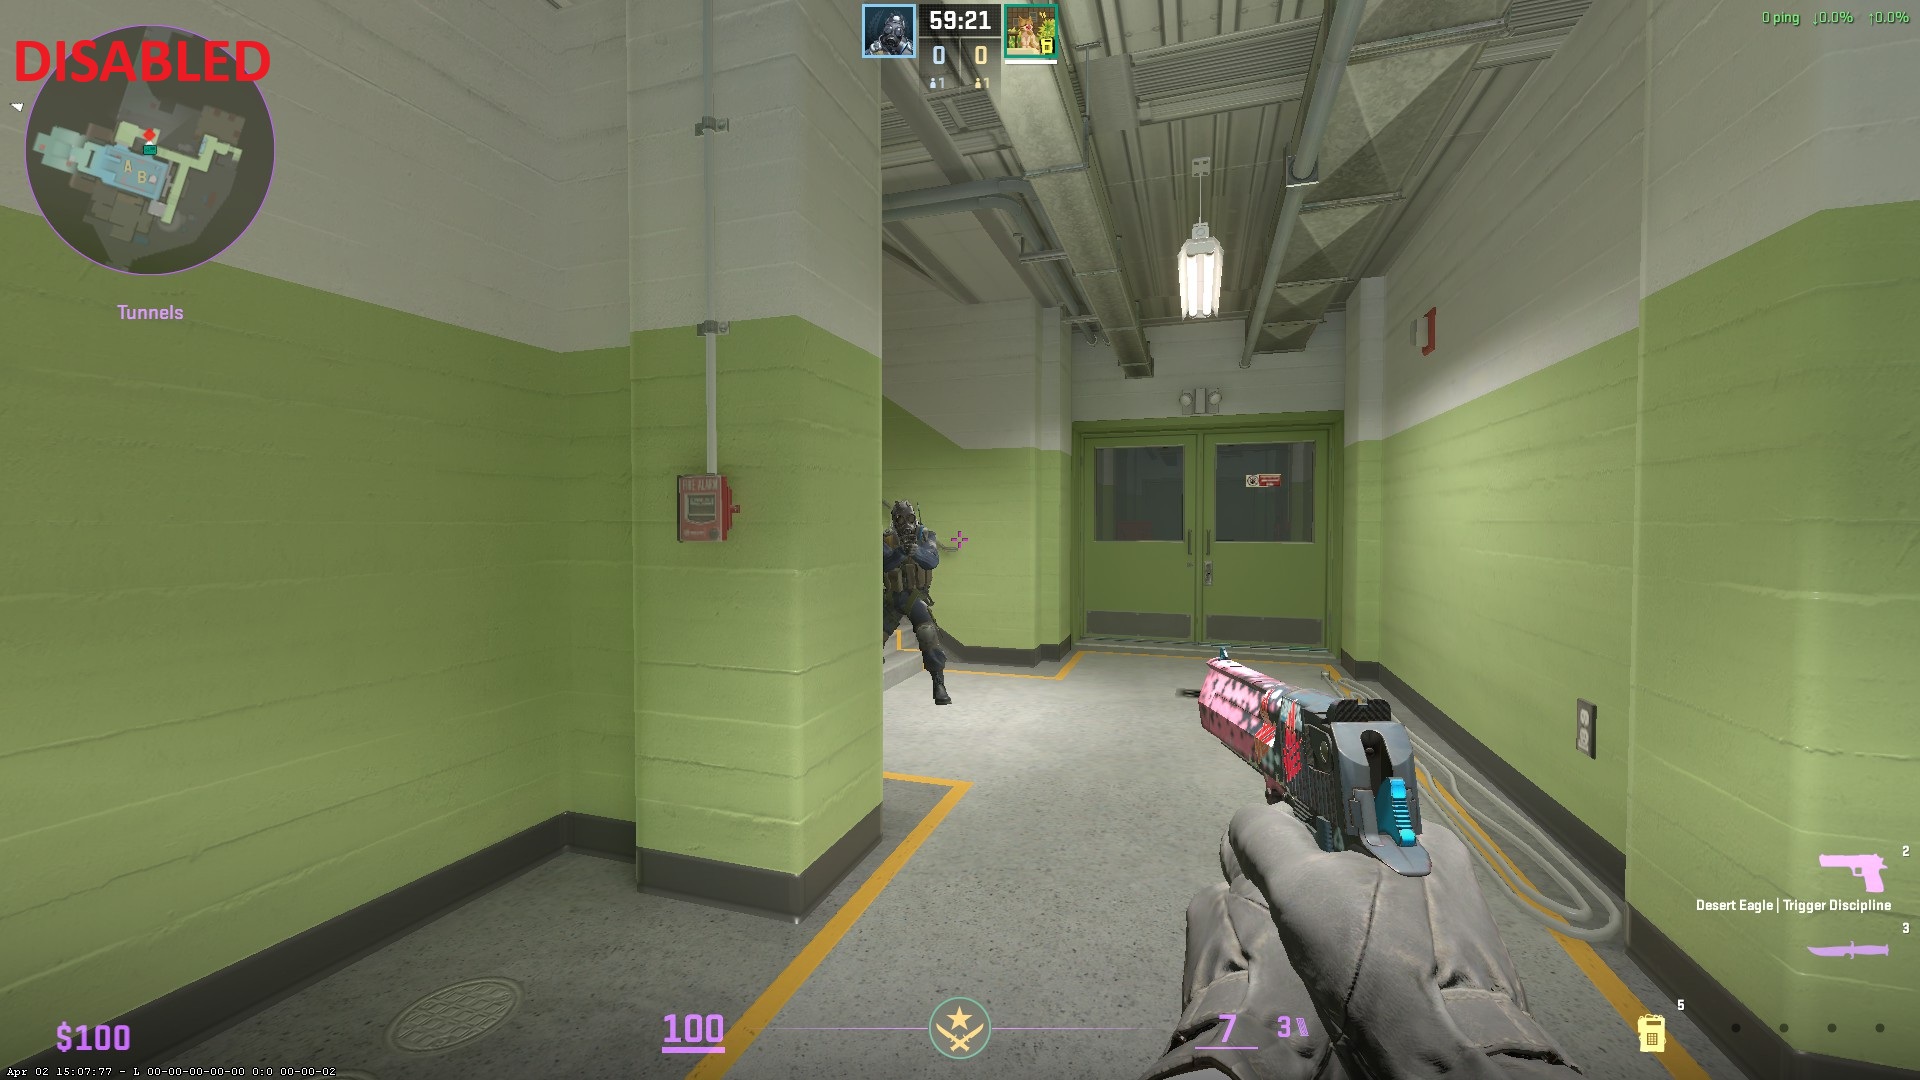
Enabled:
Note: This setting does not refer to your physical monitor's HDR capabilities, but rather the game engine's internal mathematical color precision. This setting has a very minor impact on performance. However, setting it to "Performance" introduces an unpleasant film grain/banding effect to the image, which can subtly hinder visibility. The FPS cost of "High" is negligible, and it provides a much cleaner, sharper image without the grain.
- 🏆 Recommended Setting: High
📸 Click to view screenshot comparison
Performance (Off):
High (On):
FSR functions by rendering the game at a lower resolution and artificially upscaling it to fit your screen. CS2 currently uses an outdated FSR 1 implementation. It looks terrible, makes the game incredibly blurry, and introduces noticeable input lag. It provides absolutely no value for competitive play and should never be used.
- 🏆 Recommended Setting: Disabled (Highest Quality)
After rigorous testing across multiple system layers, the data paints a very clear picture of what actually matters for Counter-Strike 2 performance on a modern system. Relying on outdated CS:GO myths or placebo "FPS boost" packs will often hurt your performance rather than help it.
Here is the definitive summary of how to optimize your setup:
- Optimal CPU Config: The biggest performance gains come from intelligent thread scheduling. To maximize stability and 1% lows, you should disable Hyper-Threading/SMT (HT for Intel, SMT for AMD) and uncheck Core 0 to isolate the game from heavy OS background tasks.
- Tools: You can achieve this using my hobbyist tool, Process Core Optimizer, or a proven commercial solution like Process Lasso.
- Method: Always use Windows CPU Sets instead of Hard Affinity. CPU Sets act as a "soft" rule for the Windows scheduler, which prevents game crashes and input stutter when playing on aggressive kernel-level anti-cheats (like FACEIT AC) that often block hard affinity masks.
- Optimal Graphics Config: Competitive CS2 is about balancing peak FPS with perfect visibility. Most settings should be turned down to minimize visual clutter and GPU load. However, you must keep Dynamic Shadows on All, MSAA on 2X, and HDR on High to prevent massive visibility disadvantages.
- Launch Options: Keep your launch options clean. Do not use legacy commands like
-highor thread modifiers. Only use utility commands that you actually need (e.g.,-novidto skip the intro video,-consoleto enable the developer console, or-allow_third_party_softwareif you use recording tools like OBS). - NVIDIA Reflex / AMD Anti-Lag 2.0: The choice to use these latency-reduction tools is heavily based on personal preference and game feel. Technologically, these features pace the CPU to prevent it from running ahead of the GPU, reducing the render queue and theoretically minimizing click-to-photon input latency. However, they carry a significant FPS penalty, which can cause noticeable stuttering on weaker systems. While technically a "YES" for latency reduction, it is a firm "NO" for raw FPS. Observing the current meta, the vast majority of top professional CS2 players keep these technologies Disabled. Since I currently lack the physical hardware (like LDAT tools) to measure exact end-to-end latency, I cannot give a definitive verdict yet. I will update this guide once I have the tools to verify their exact impact, but for now: test it yourself, and if in doubt, leave it disabled.
Let the modern OS do its job. For visual learners, here is the quick checklist of how your Windows 11 system should be configured for CS2:
| Windows Feature | Recommended State |
|---|---|
| Hardware-Accelerated GPU Scheduling (HAGS) | Enabled ✅ |
| Windows Game Mode | Enabled ✅ |
| Windows Power Plan | Balanced (or tweaked by me Ultimate Perfomance) 🔋 |
| Core Isolation (Memory Integrity / VBS) | Disabled ❌ |
🛠️ How to change these Windows settings (Click to expand)
- How to Enable HAGS:
- Press
Windows Key, type Graphics settings, and press Enter. - Click on Change default graphics settings.
- Toggle Hardware-accelerated GPU scheduling to On. (Requires a PC restart).
- Press
- How to Enable Game Mode:
- Press
Windows Key, type Game Mode settings, and press Enter. - Toggle Game Mode to On.
- Press
- How to Change Power Plan:
- Press
Windows Key, type Choose a power plan, and press Enter. - Select Balanced. (Note: The modern Windows 11 scheduler handles frequency scaling best on Balanced for most CPUs).
- Press
- How to Disable Core Isolation (Memory Integrity):
- Press
Windows Key, type Core Isolation, and press Enter. - Toggle Memory integrity to Off. (Requires a PC restart). Note: This disables a virtualization security layer. While perfectly fine for a personal gaming PC, be aware of what this feature does before disabling it.
- Press
Below is the final, fully optimized configuration derived directly from the benchmark data in this guide. This setup guarantees the highest possible frame rates without sacrificing crucial competitive visibility.
| Category | Setting | Recommended Value |
|---|---|---|
| Video | Resolution | 1280x960 or 1920x1080 |
| Video | Display Mode | Borderless Windowed (If Windows 11 optimizations are ON) |
| Advanced Video | Boost Player Contrast | Enabled |
| Advanced Video | Wait for Vertical Sync | Disabled |
| Advanced Video | Multisampling Anti-Aliasing Mode | 2X MSAA |
| Advanced Video | Global Shadow Quality | Low |
| Advanced Video | Dynamic Shadows | All |
| Advanced Video | Model / Texture Detail | Low |
| Advanced Video | Texture Filtering Mode | Anisotropic 2X (or 16X for high-end PCs) |
| Advanced Video | Shader Detail | Low |
| Advanced Video | Particle Detail | Low |
| Advanced Video | Ambient Occlusion | Disabled |
| Advanced Video | High Dynamic Range | High |
| Advanced Video | FidelityFX Super Resolution | Disabled (Highest Quality) |
| Advanced Video | NVIDIA Reflex / AMD Anti-Lag 2.0 | Disabled / Preference |