The Python script shows the performance of the client portfolio extracted from Excel based datasets
Datasets used are as attached
- Raw Price Data of stocks on the daily from the year of 2007 till 2017.
The file raw_price_data.csv provides the observed closing prices of stocks at different trading dates. The historical prices span from 1-Jan-2007 till 31-Jan-2017. As the name suggests, the price data has not been pre-processed, there are be incomplete price information for stocks which did not begin trading before 1-Jan-2007. An example is NYSEARC: MENU which did not have any price information earlier than 7-Nov-2016.
For some stocks, there might not be any price information at all, either due to a data query malfunction or human errors. An example is NYSEARCA: TPYP where there is an empty column.
There are some stocks where there are holes in the price data. An example is NYSEARCA: PFM where price data between 7-Dec-2016 to 20-Dec-2016 is missing.
The remaining columns denotes the observed closing prices of stocks. The column headers specify the names of stocks.
- Portfolio of clients which shows initial investment and monthly investments made with specific weightage of stocks in each portfolio.
The specific of the portfolio is created in the portfolio database with the following details:
• Portfolio id (id), which is a unique identifier to the portfolio
• Portfolio construction date, (PC Date) which refers to the date when the portfolio is set up
• The composition of the portfolio, which will include the names of the stocks and their respective composition. It is assumed that a maximum of 7 stocks is allowed in the portfolios and the names of the stocks are obtained in the columns denoted by x_1, x_2, …, x_7. The weight of each stock is obtained from the columns denoted by w_1, w_2, …, w_7.
• The initial investment amount (initial_invt) is the amount of wealth used to create the portfolio
• The monthly investment amount (monthly_invt) is the sum of money which the client will pay every month to acquire the portfolio
The details of all the portfolios that is managed are recorded in the portfolios.csv file.
The portfolio is set up on the PC Date, i.e. the initial investment amount is used to buy stocks with their allocation specified in w_1, … w_7. Subsequently, the monthly investment amount is used to acquire stock on the last date of each month.
For example, for portfolio with id = 1, it is a 5-underlyings portfolio and the portfolio is set up on 14-April-2008 with a sum of $2,100 and for all subsequent monthly trading dates, the portfolio will be set up with a sum of $410.
If the PC Date or last date of each month is not a trading date, it is assumed that the trades will be executed immediately at the next trading date.
Performance of client portfolio are shown in the format as presented below
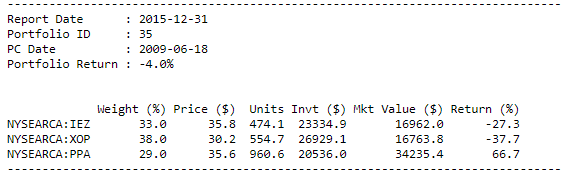
The first three columns report the names, allocation and prices of the stocks in the portfolio on Report Date. The Units column reports the total units of the stocks held in the portfolio on the Report Date and the Invt $ column prints the total amount of money used to acquire the respective stocks. The Mkt Value ($) column reports the market value of the stocks on Report Date while the Return (%) column prints the return of stock in the portfolio.
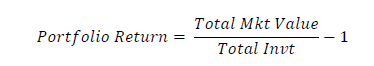
The overall portfolio return is determined by: