To use:
- install npm packages.
- run "npm run dev:react" to initialize webpack and babel.
- run "npm start" to start web browser in localhost:3000.
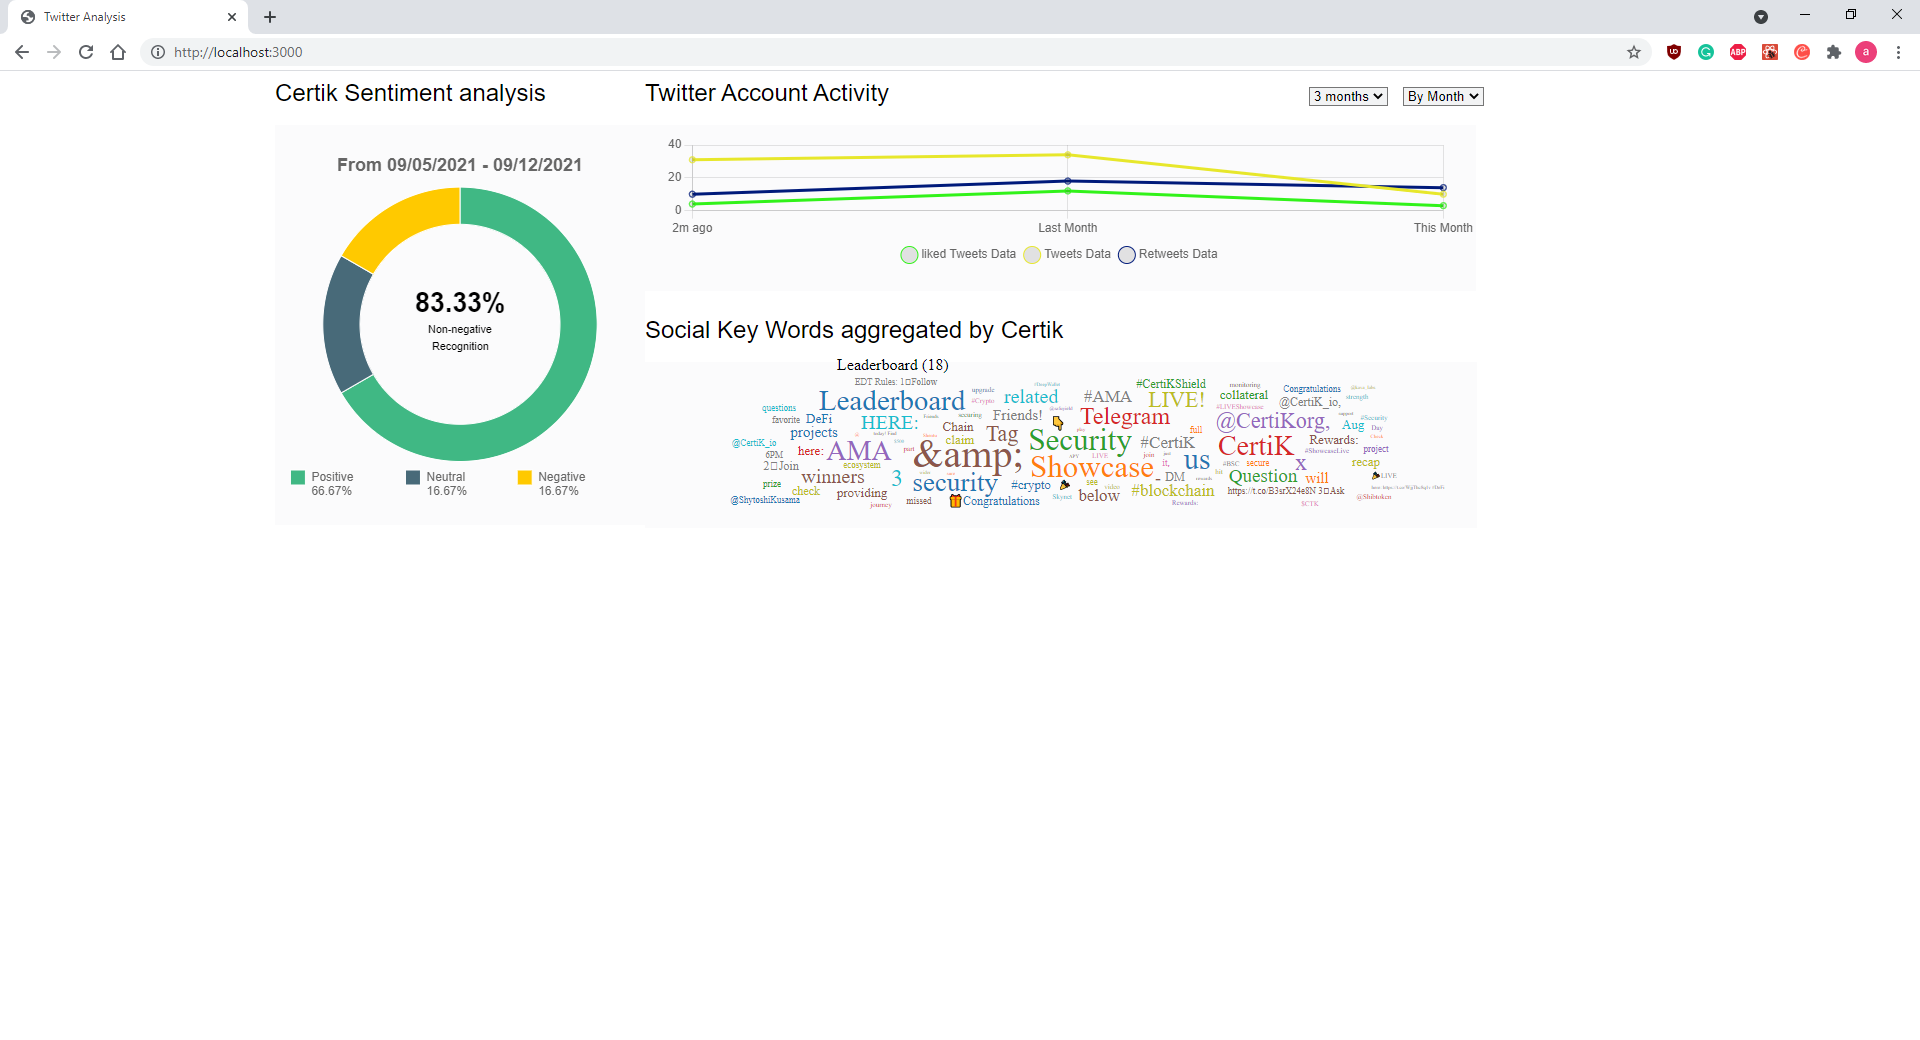
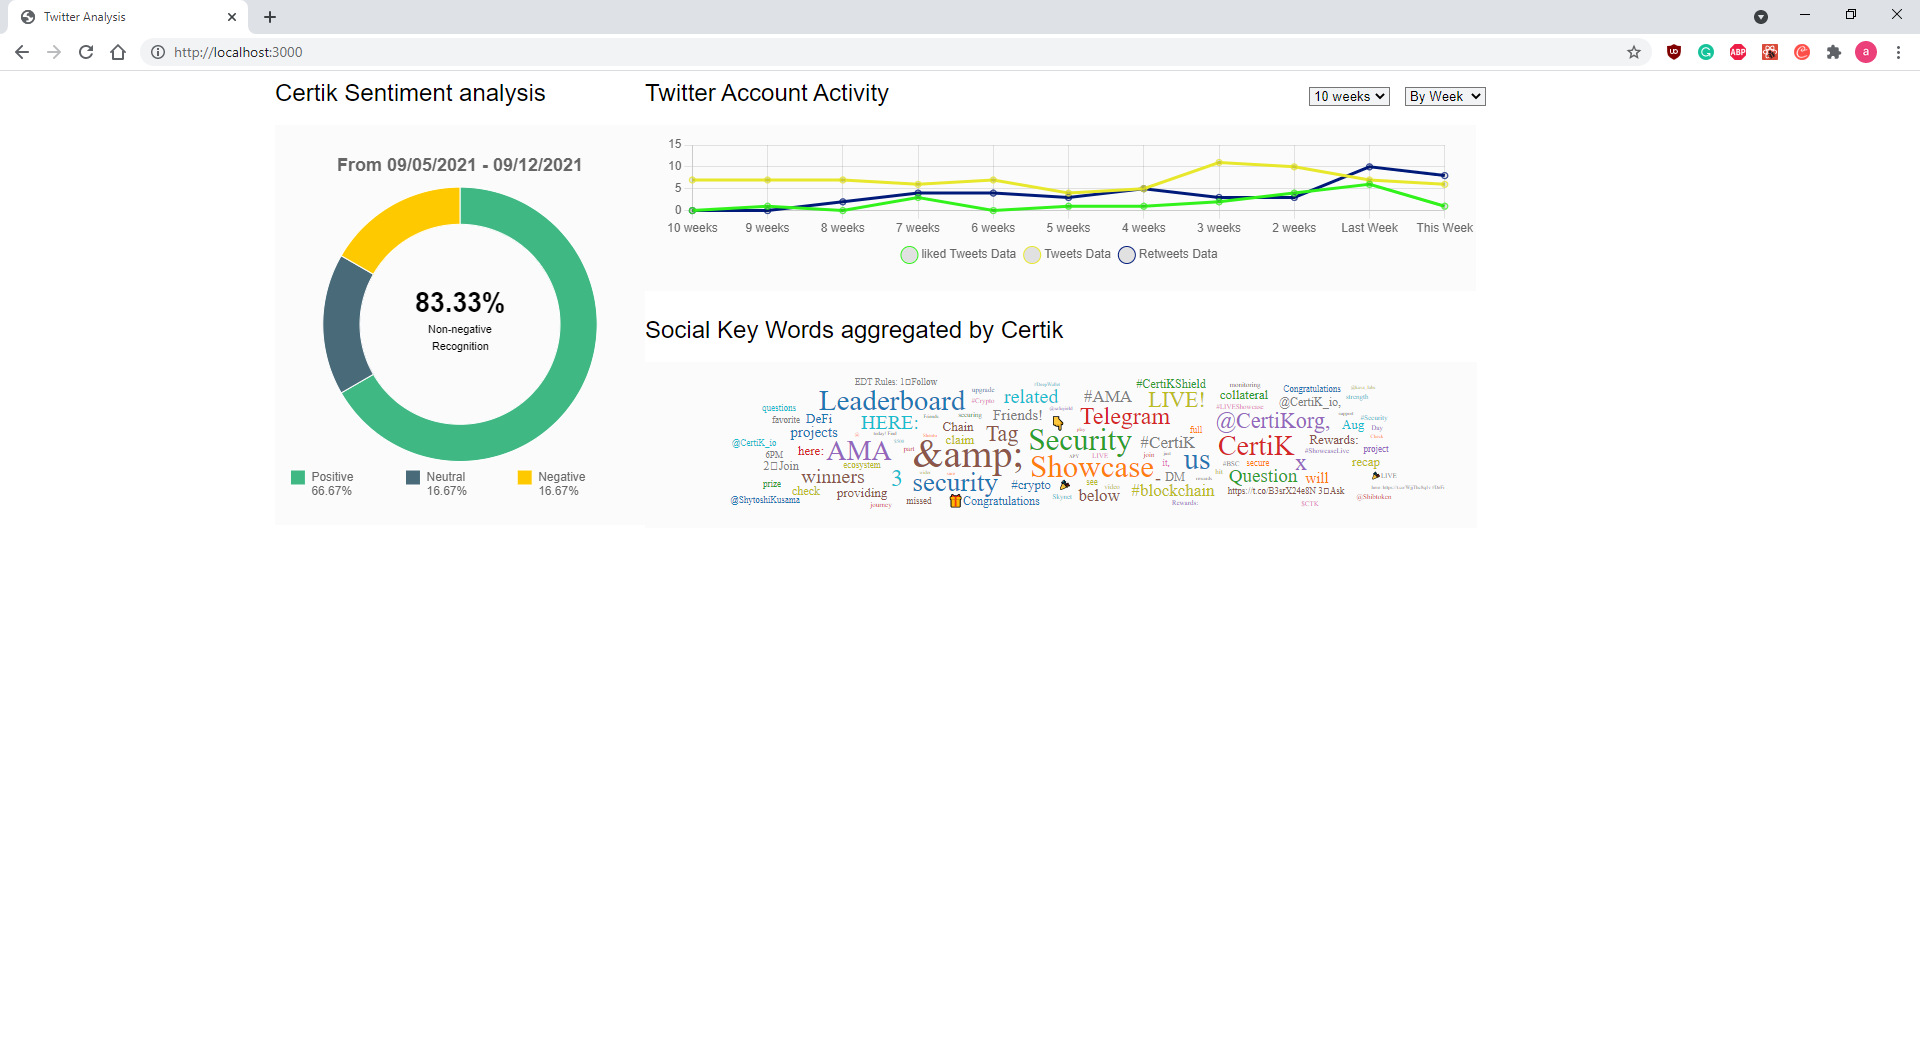
The image below is the initilaization of the webpage.

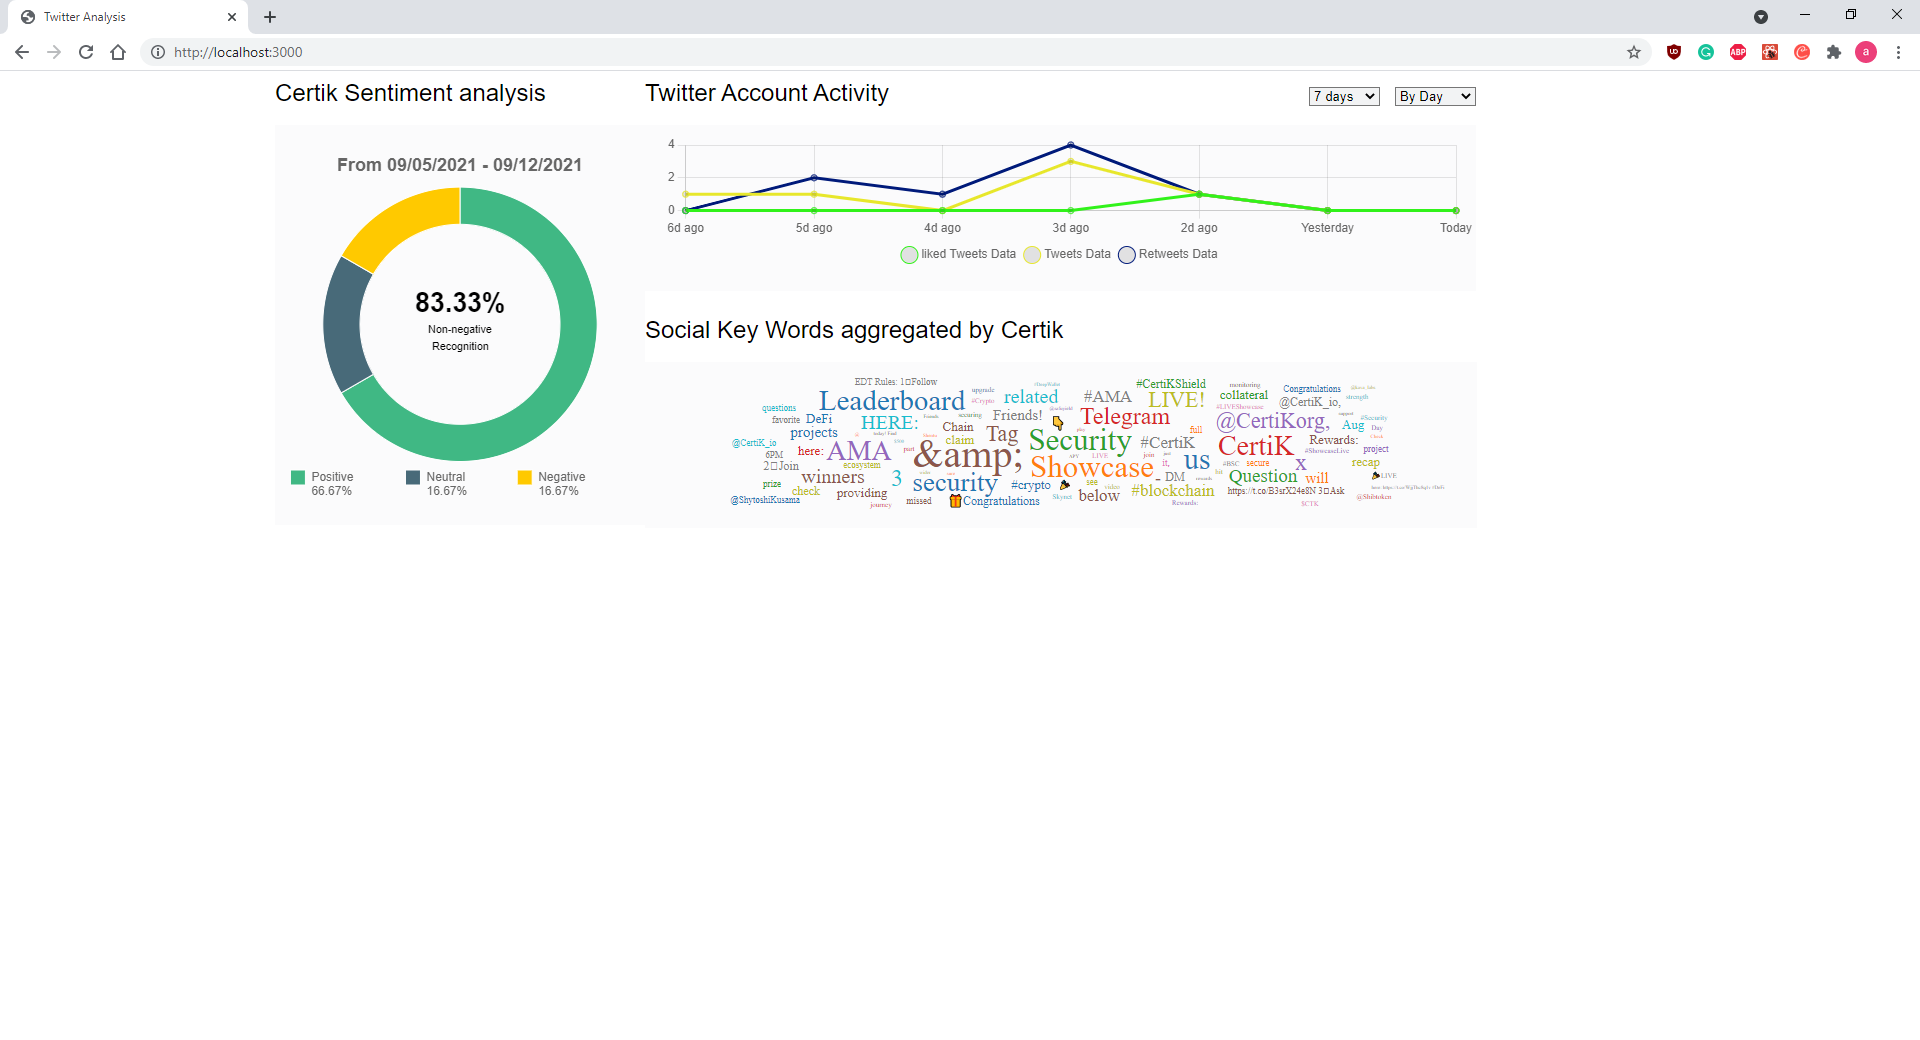
On the left we have a doughnut graph that states the dates of tweet data gathered at the top and the % of positive and neutral tweets in the middle. The colors are color coded to a legend right below.
On the top right we have a line graph of the number of tweets, retweets, and likes send out by the Certik Twitter's account. The time range and time index of the line graph can be customized as shown below.
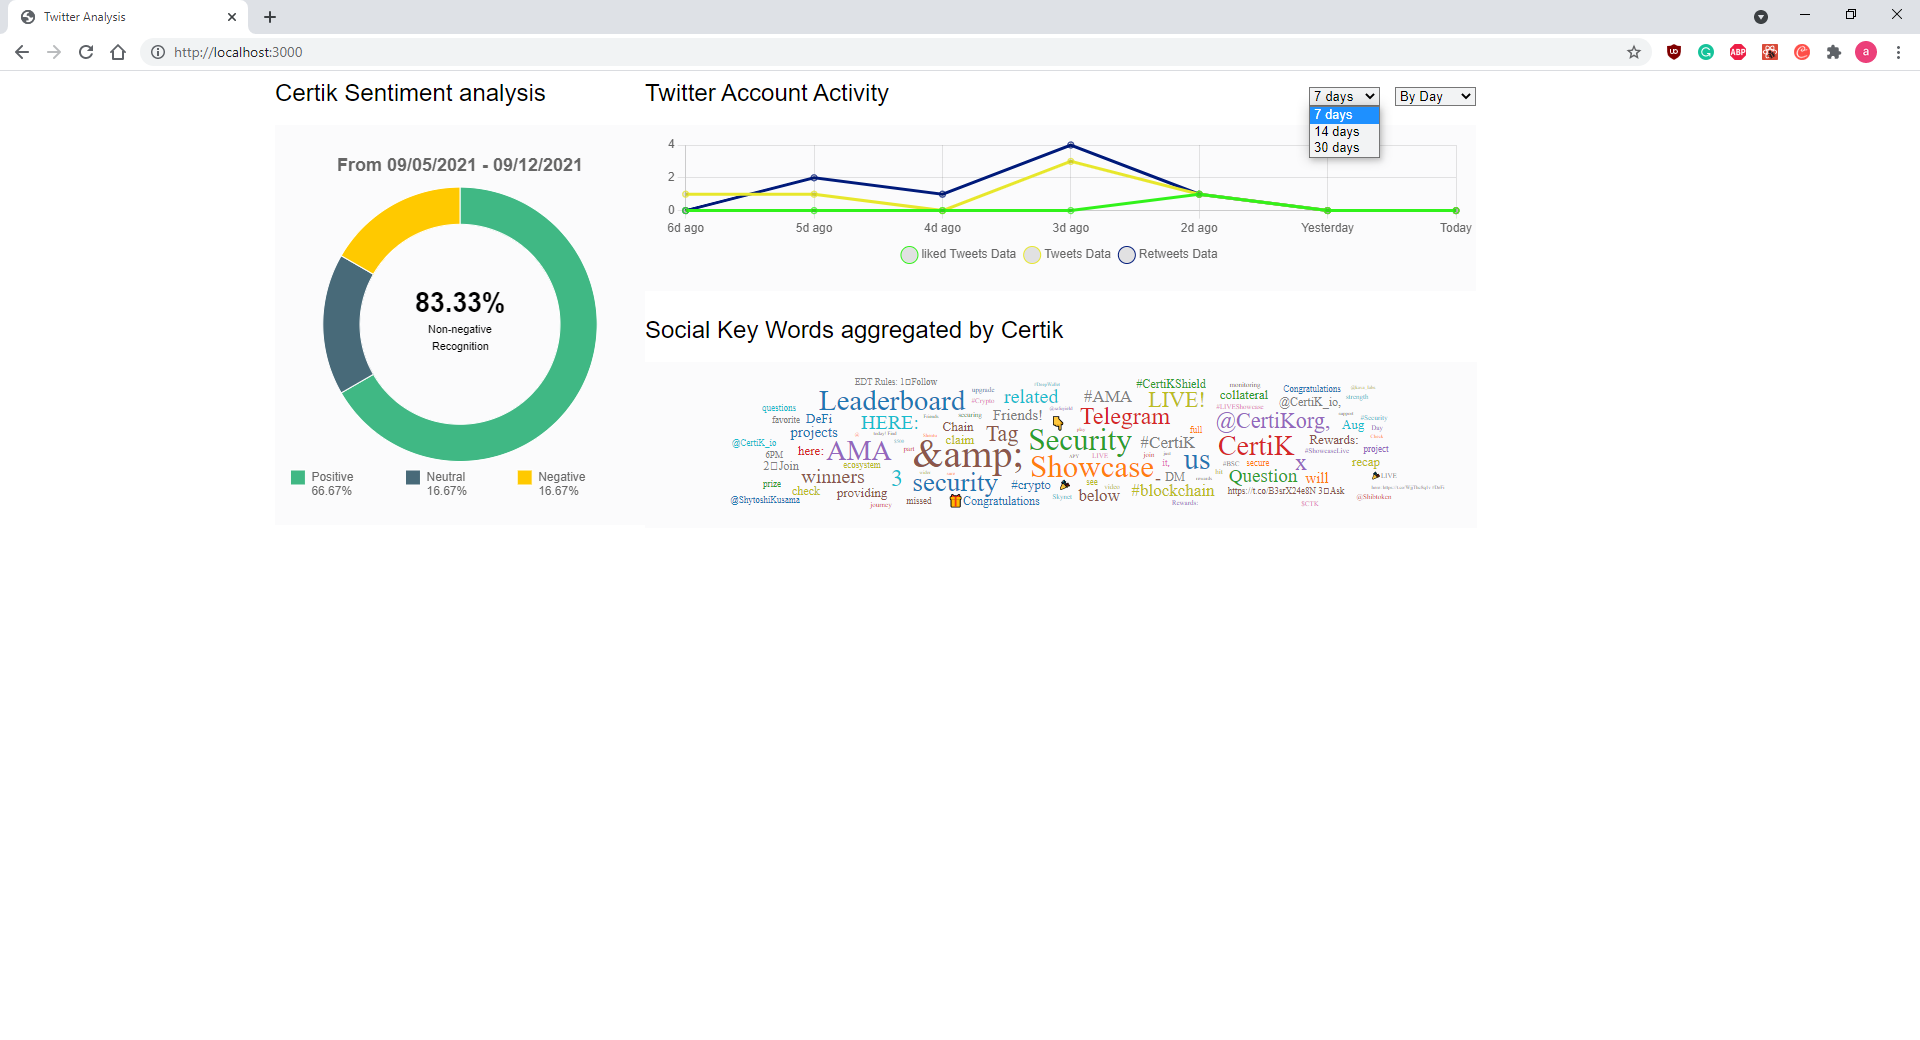
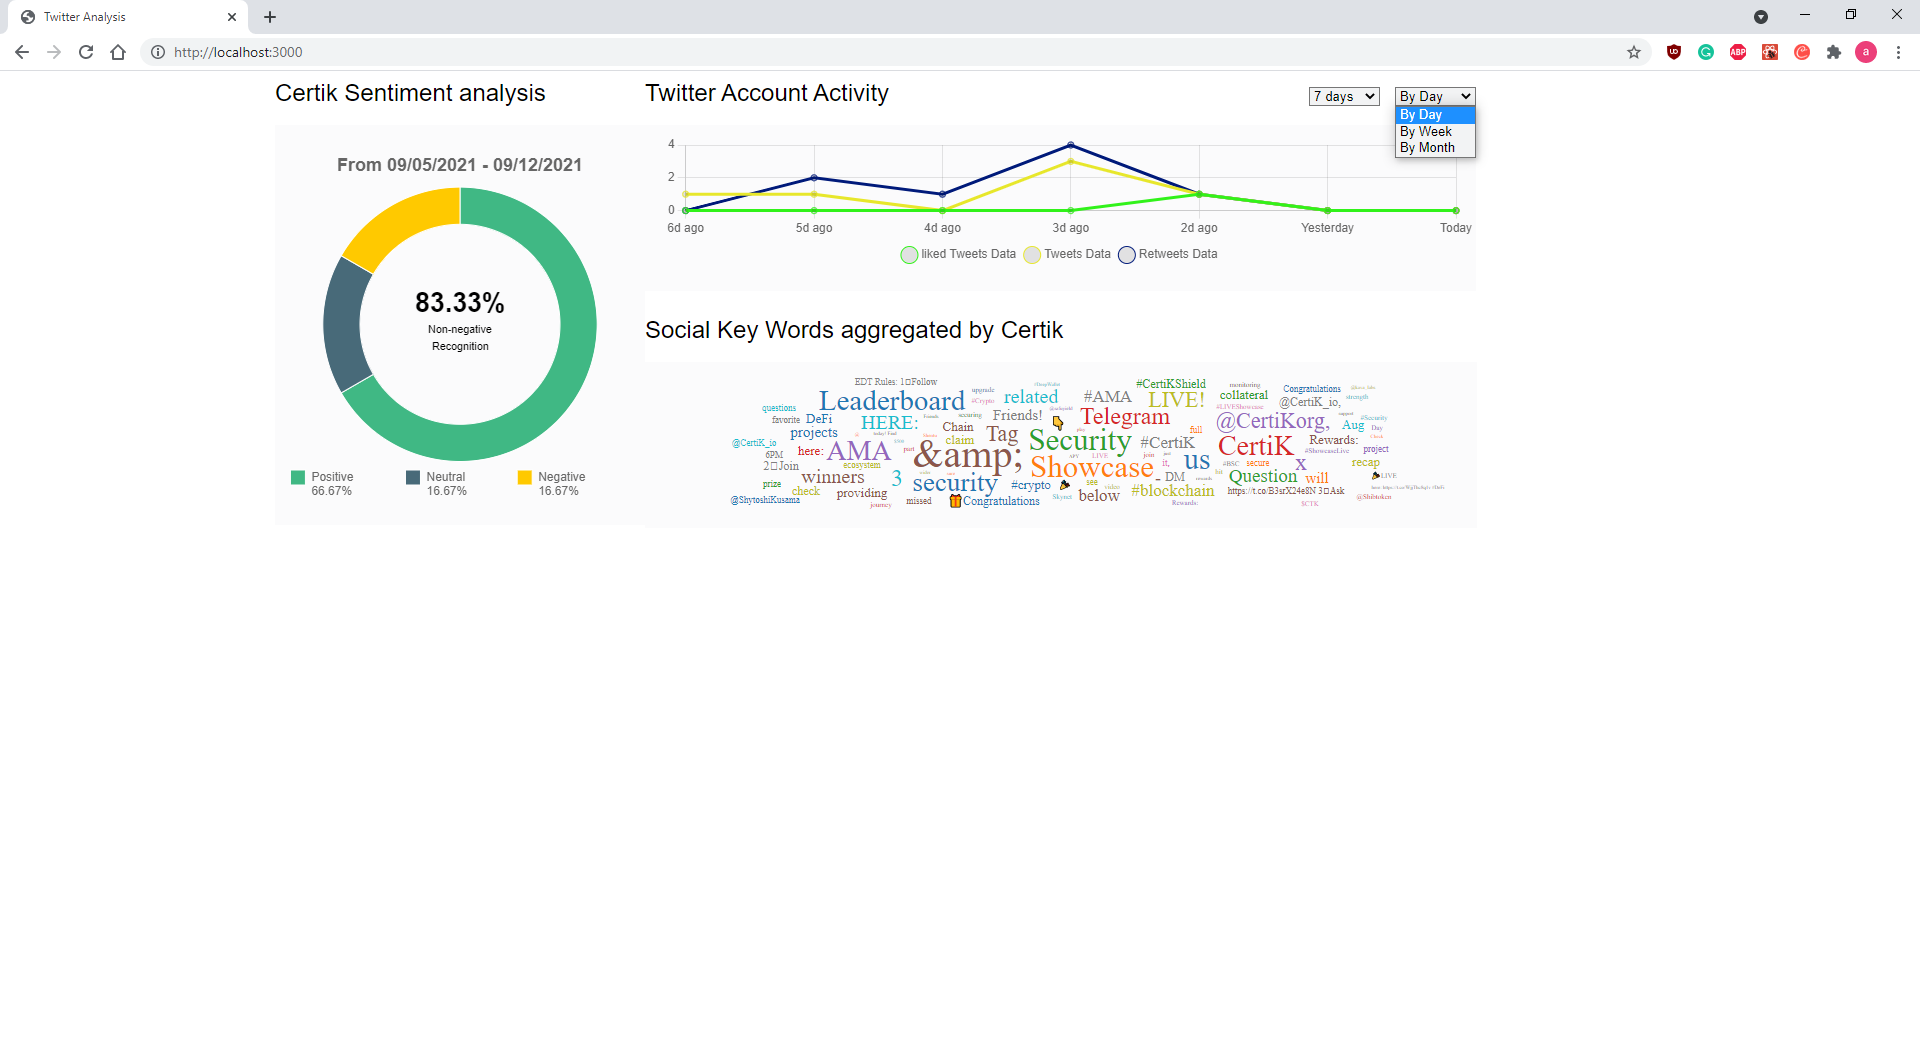
Image below is an example of choosing "By weeks" in time frame of "7 weeks" and "By weeks" in time frame of "10 weeks."
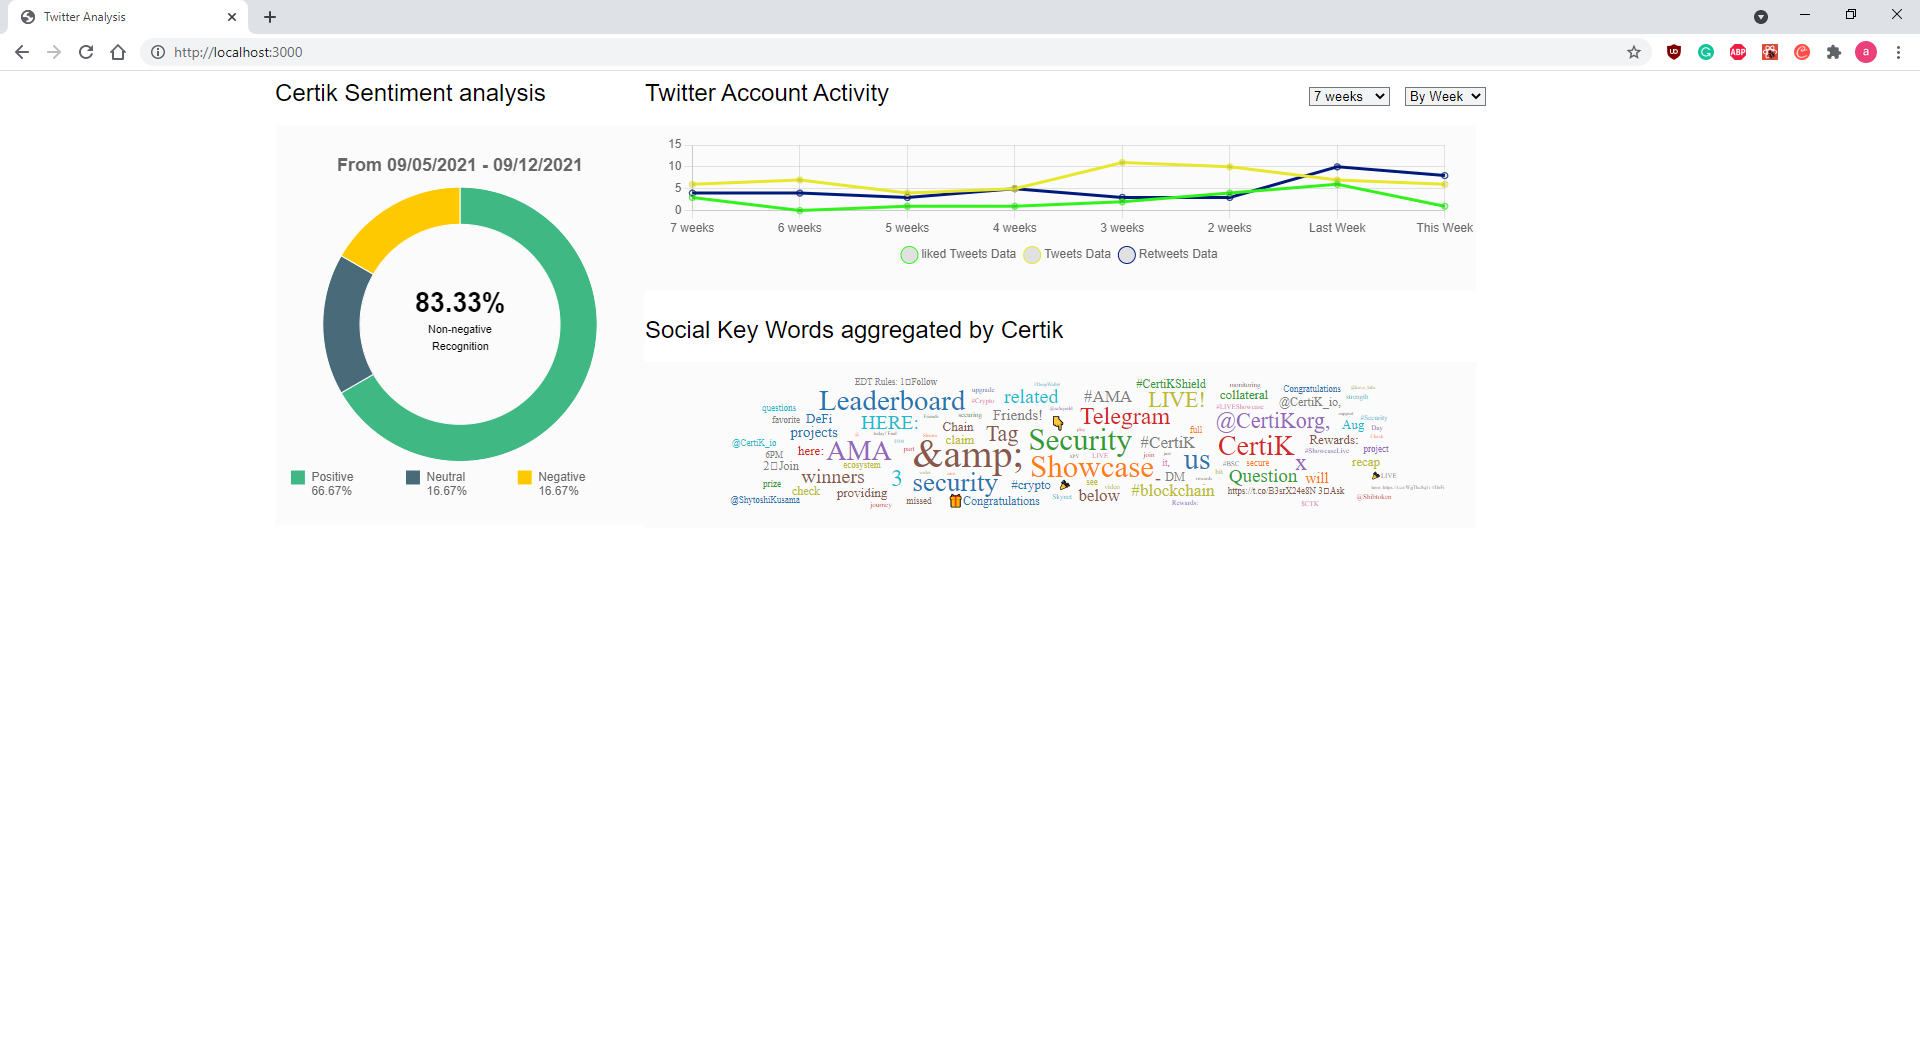
Below are examples of "By Day" and "7 Days", "By Week" and "7 weeks', and "By Month" and "3 Months."


On the bottom right is a wordcloud of the most commonly used nonstop words for Certik's Twitter. On Hover, it will display the word and count of times it has been used.