Practicing some basic map skills
First I created a basic choropleth map using folium and the Oregon Health Authority's open data on vaccination https://visual-data.dhsoha.state.or.us/t/OHA/views/OregonVaccineMetricsSummaryTable/OregonCOVID-19VaccineProgressSummaryTable?:showAppBanner=false&:display_count=n&:showVizHome=n&:origin=viz_share_link&:isGuestRedirectFromVizportal=y&:embed=y

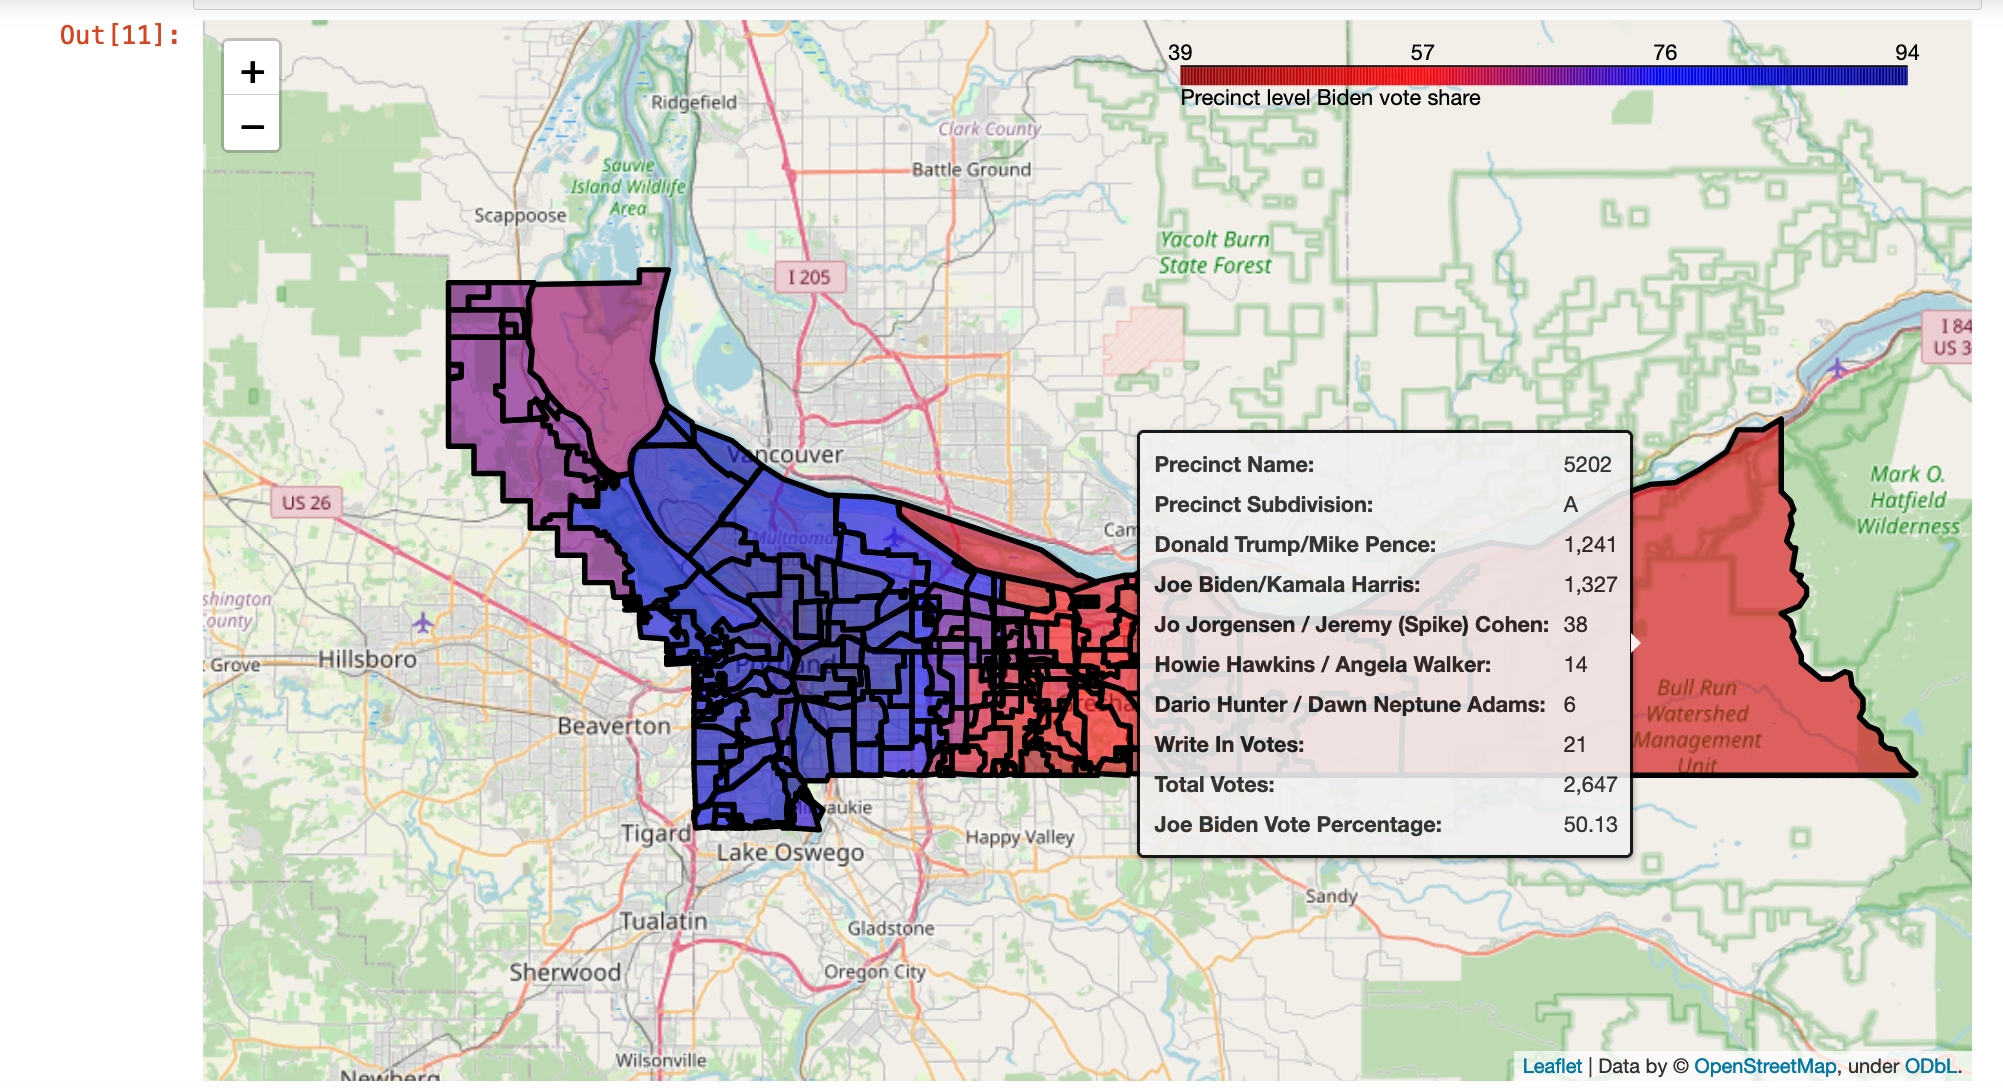
I also created a precinct level map of Multnomah County showing the percentage of the vote Biden won in each precinct,
using Multnomah County precinct level data (https://www.multco.us/file/93747/download):
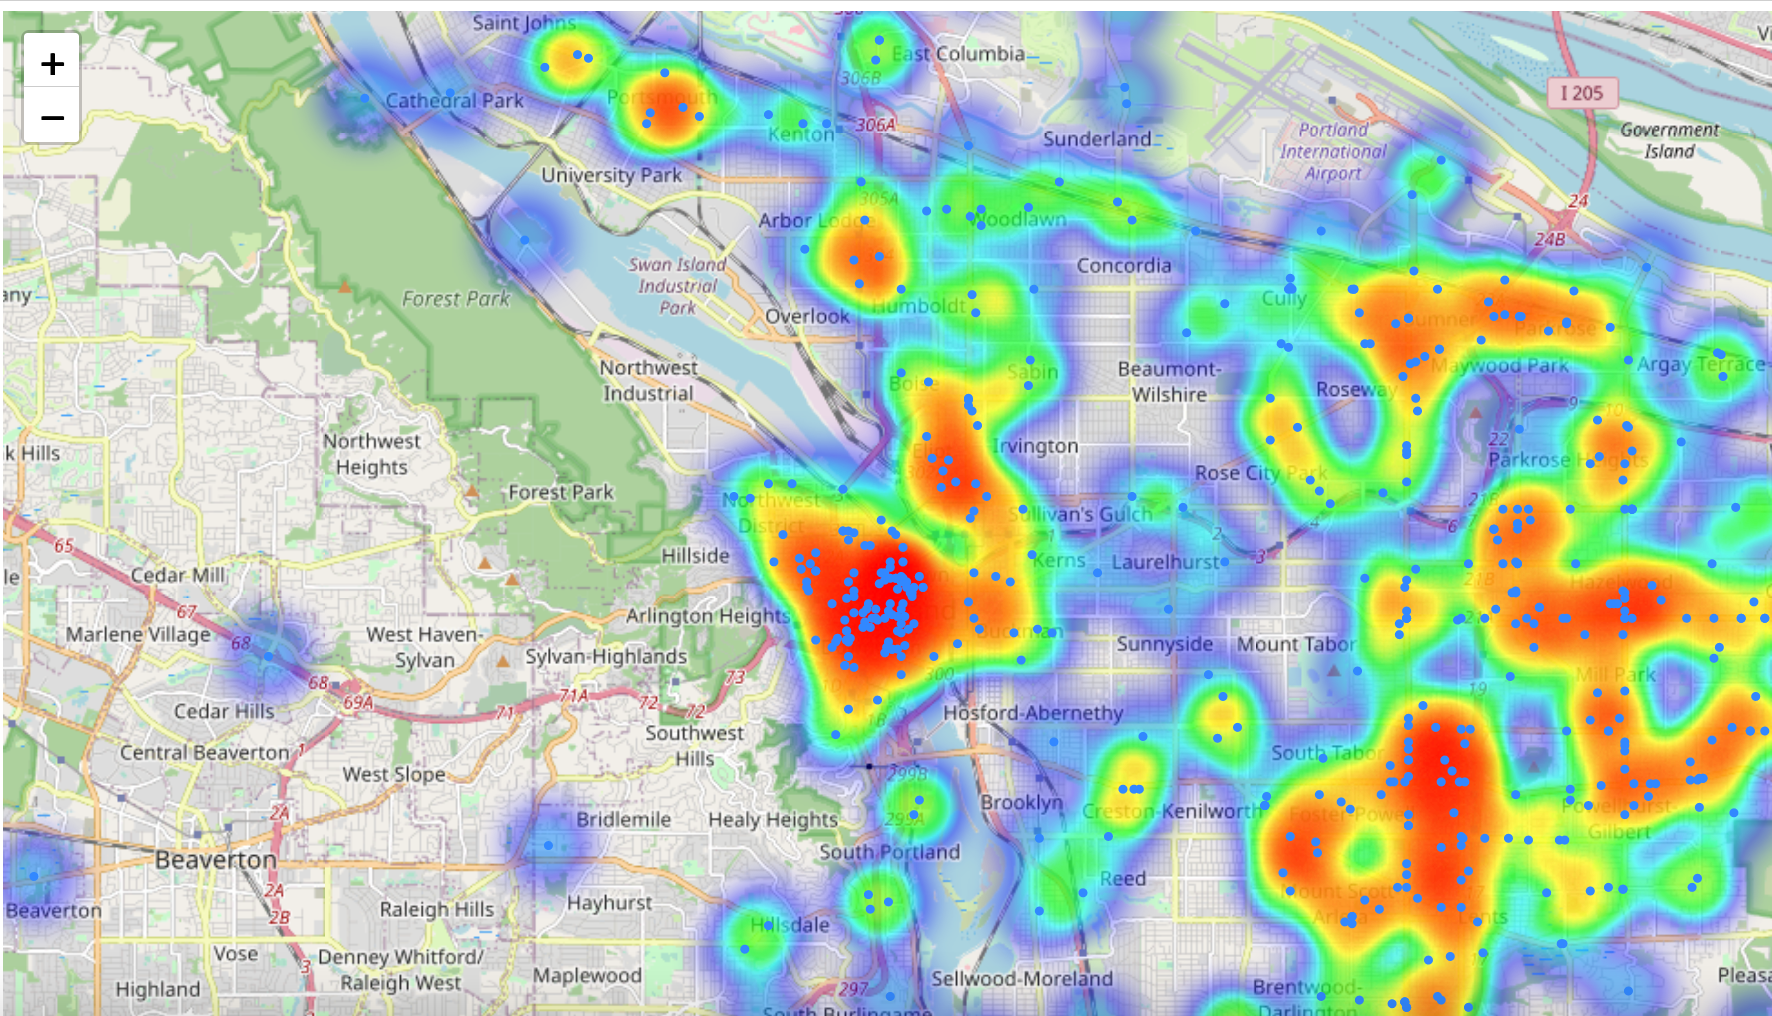
Here's a heatmap using folium of some city of Portland crime stats (https://www.portlandoregon.gov/police/71978):