Under construction
Collects metrics from some SQL Server instance for stored procedures and exposes them to a prometheus compatible REST endpoint. Intention is in tracking and analyzing performance within the database, without the necessisity any adaption in the client code.
Supported metrics are describes below.
The total elapsed time, in microseconds, for completed executions of this stored procedure.
The minimum elapsed time, in microseconds, for completed executions of this stored procedure.
The average elapsed time, in microseconds, for completed executions of this stored procedure.
The last (youngest) elapsed time, in microseconds, of completed execution of this stored procedure.
The minimum number of physical reads that this stored procedure has ever performed during a single execution.
The minimum number of physical reads that this stored procedure has ever performed during a single execution.
The average number of physical reads that this stored procedure has performed during a single execution.
The number of physical reads performed the last time the stored procedure was executed.
The minimum number of logical reads that this stored procedure has ever performed during a single execution.
The minimum number of logical reads that this stored procedure has ever performed during a single execution.
The average number of logical reads that this stored procedure has performed during a single execution.
The number of logical reads performed the last time the stored procedure was executed.
The minimum number of logical writes that this stored procedure has ever performed during a single execution.
The minimum number of logical writes that this stored procedure has ever performed during a single execution.
The average number of logical writes that this stored procedure has performed during a single execution.
The number of buffer pool pages dirtied the last time the plan was executed. If a page is already dirty (modified) no writes are counted.
The maximum number of page server reads that this stored procedure has ever performed during a single execution.
The minimum number of page server reads that this stored procedure has ever performed during a single execution.
The average number of page server reads that this stored procedure has performed during a single execution.
The number of buffer pool pages dirtied the last time the plan was executed. If a page is already dirty (modified) no writes are counted.
The maximum CPU time, in microseconds, that this stored procedure has ever consumed during a single execution.
The minimum CPU time, in microseconds, that this stored procedure has ever consumed during a single execution.
The minimum CPU time, in microseconds, that this stored procedure has ever consumed during a single execution.
CPU time, in microseconds, that was consumed the last time the stored procedure was executed.
Counts the number of executions between now an the last fetch.
Please consider also documentation about managed view sys.dm_exec_procedure_stats https://docs.microsoft.com/en-us/sql/relational-databases/system-dynamic-management-views/sys-dm-exec-procedure-stats-transact-sql?view=sql-server-ver15. Some of the above mentioned metrics are similar to those provided by sys.dm_exec_procedure_stats, but there are slight customizations one should be aware of.
The app has to run in combination with some prometheus instance. Additionally required XEvent session has to be configured and started. The figure below shows the main building blocks of this system.
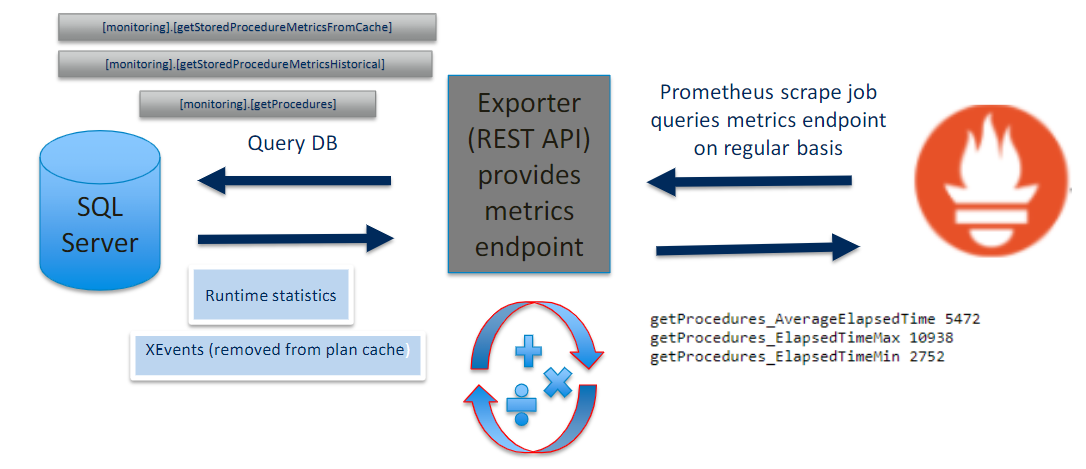
Basically all required information is already provided by the SQL Server, so that all metrics can be calculated from two basic sources:
- execution statistics (sys.dm_exec_procedure_stats stats)
- extended event session
Statistics for stored procedures are retrieved from the management view sys.dm_exec_procedure_stats stats. As the metrics are collected periodically (compare prometheus scrape job strategy) and statistics are maybe kept in the cache only for a short time, the sourcing of the extended event query_cache_removal_statistics is required to get consistent data. Putting both sources together, one yields a full history of statistics.
The entry point of the application is a prometheus compatible https://myapipath/metrics endpoint (HTTP Method GET without any further parameters). Whenever the GEt is triggered it runs through following scenario:
- Fetch statistical records from datasource and enrich these with the name of the stored procedures.
- Pass the yield records to the provider engine for calculation.
- Format the retrieved response into the prometheus metrics and emit.
Please be aware that the application is not stateless. It has to store some characteristics (e.g.: timestamp, execution count) of the previous fetch avoiding unwanted multiple consideration of items. As a consequence you can not scale up the instance anyway. Additionally you have to avoid setting up any calls at the metrics endpoint except those comming from prometheus job.
The folder structur of the respository is given by:
- TEST
- SqlServer.Metrics.Exporter.Integration.Tests
- SqlServer.Metrics.Exporter.Tests
- SqlServer.Metrics.Provider.Tests
- SqlServer.Metrics.Provider (Business Logic)
- SqlServer.Metrics.Exporter (REST API)
- SqlServer.Monitoring (DataBase Project)
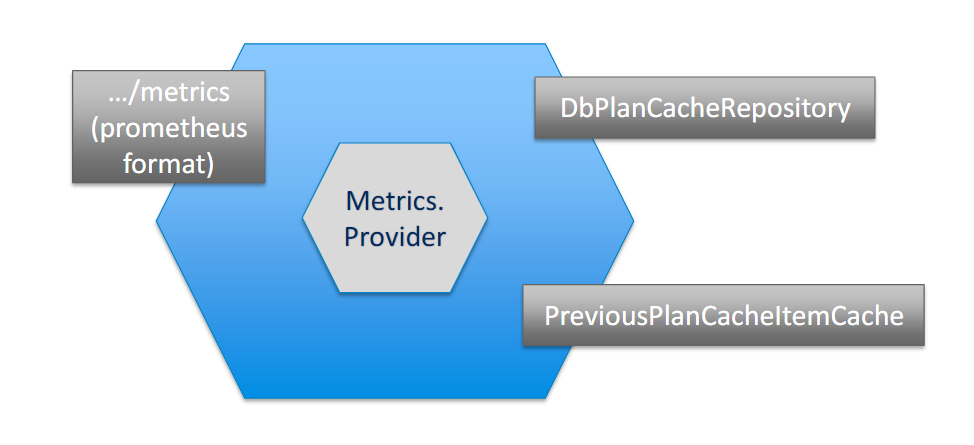
Choosen architecture style was hexagonal, where SqlServer.Metrics.Provider implements the CORE business logic. SqlServer.Metrics.Exporter, that also contains the hosting logic for the REST API, implements proper in/out- adapters. This clear separation from business and infrastructure was mainly influenced by TDD aspects and potential scenarios of reusability in differnt environments. Following figure illustrates it's hexagonal aspect.
The project SqlServer.Metrics.Exporter.Integration.Tests provides fully automated test runs against some sql server instance. For each test run a dedicated database will be created and dropped afterwards.
You only need proper rights for the accessing user in order to:
- View server state
- Run DDL
- Execute schema
If you can read C# Code going through this integration test project give you a good insight into the architectural flows.
By appsettings.json you can provide proper configuration settings:
{
  "XEventPath": "MyXEventPath", // specifies the path where XEvents are written by SQL Server instance, this value has to be aligned with the corresponding XEvent session
  "XEventFileDispatchLatencySeconds": 30, // specifies the DispatchLatency for persisting XEvents into the file system, this values has to be aligned with the corresponding XEvent session
  "InitialFetchIntervalSeconds": 300, // specifies the size of the first fetch the application performs after it was launched
  "ConnectionStrings": {
    "SqlServerToMonitor": "MySQLServerThatILoveMost" // connection string to the monitored SQL Server instance, selection of database (catalogue) is irrelevant
  },
  // ordinary serilog configuration
  "Logging": {
    "LogLevel": {
      "Default": "Information",
      "Microsoft": "Warning",
      "Microsoft.Hosting.Lifetime": "Information"
    }
  }
}As the metrics are based on delta calucations, the app contains state regarding execution counts and timestamps of the previous fetch. Therefore it is not possible to run multiple instances in parallel. You might run 2 instances in a fail over cluster for sake of avaiability, but in case of switching you will get wrong metrics for the first fetch.
In general, the application will fetch data for all stored procedures in each database.
You can reduce the amount of data by restricting the number of metrics, as each metric has to be enabled separatly by using StoredProcedureMetricsProviderFactoryMethod:
 services.AddSingleton(
                s => StoredProcedureMetricsProviderFactoryMethod.Create(
                    s.GetService<IPlanCacheRepository>(),
                    s.GetService<IPreviousItemCache>(),
                    new BuilderTypes[]
                    {
                        BuilderTypes.AverageElapsedTimeMetricsBuilder,
                        BuilderTypes.MaxElapsedTimeMetricsBuilder,
                        BuilderTypes.MinElapsedTimeMetricsBuilder,
                        BuilderTypes.LastElapsedTimeMetricsBuilder,
                        BuilderTypes.MaxPhysicalReadsMetricsBuilder,
                        BuilderTypes.MinPhysicalReadsMetricsBuilder,
                        BuilderTypes.LastPhysicalReadsMetricsBuilder,
                        BuilderTypes.AveragePhysicalRreadsMetricsBuilder,
                        BuilderTypes.MaxLogicalReadsMetricsBuilder,
                        BuilderTypes.MinLogicalReadsMetricsBuilder,
                        BuilderTypes.LastLogicalReadsMetricsBuilder,
                        BuilderTypes.AverageLogicalReadsMetricsBuilder,
                        BuilderTypes.MaxPageServerReadsMetricsBuilder,
                        BuilderTypes.MinPageServerReadsMetricsBuilder,
                        BuilderTypes.LastPageServerReadsMetricsBuilder,
                        BuilderTypes.AveragePageServerReadsMetricsBuilder,
                        BuilderTypes.MaxLogicalWritesMetricsBuilder,
                        BuilderTypes.MinLogicalWritesMetricsBuilder,
                        BuilderTypes.LastLogicalWritesMetricsBuilder,
                        BuilderTypes.AverageLogicalWritesMetricsBuilder,
                        BuilderTypes.MaxWorkerTimeMetricsBuilder,
                        BuilderTypes.MinWorkerTimeMetricsBuilder,
                        BuilderTypes.LastWorkerTimeMetricsBuilder,
                        BuilderTypes.AverageWorkerTimeMetricsBuilder
}));Additionally you can configure the scrape job interval, which leads to less data in prometheus database.
The user, that is used for querying the statistics, will only emit metrics for stored procedures it has permissions to. This was not intended as a feature, but could be utilized for restricting the set of procedures for monitoring. Nonetheless in upcoming versions, better possibilities will be implemted for including/excluding particular stored procedures.
Following script deploys a proper event session to your SQL Server instance:
create event session [RemovedFromPlanCache] on server
add event sqlserver.query_cache_removal_statistics(
    where ([compiled_object_type]='Stored Procedure'))
add target package0.event_file(SET filename=N'MyXEventFilePath, max_rollover_files=(0)')
WITH
(
	MAX_MEMORY=4096 KB,
	EVENT_RETENTION_MODE=ALLOW_SINGLE_EVENT_LOSS,
	MAX_DISPATCH_LATENCY=30 SECONDS,
	MAX_EVENT_SIZE=4096 KB,
	MEMORY_PARTITION_MODE=NONE,
	TRACK_CAUSALITY=OFF,
	STARTUP_STATE=ON)
GO

alter event session RemovedFromPlanCache
	on server
	STATE = START
GO The SQL Server user needs View Server State permissions. Apart from that, it will only retrieve required metadata of the stored procedures (e.g. name) if proper permissions to the stored procedures are in place.
In order to add some new metrics the interface IMetricsBuilder has to be implemented:
	public interface IMetricsBuilder
	{
		IEnumerable<MetricItem> Build(IGrouping<string, PlanCacheItem> grouping);
	}
Each Metric is listed by the enum BuilderTypes,
	    public enum BuilderTypes
	    {
		AverageElapsedTimeMetricsBuilder,
		ExecutionCountMetricsBuilder,
		MaxElapsedTimeMetricsBuilder,
		MinElapsedTimeMetricsBuilder,
		LastElapsedTimeMetricsBuilder,
		MaxPhysicalReadsMetricsBuilder,
		MinPhysicalReadsMetricsBuilder,
		LastPhysicalReadsMetricsBuilder,
		AveragePhysicalRreadsMetricsBuilder,
		MaxLogicalReadsMetricsBuilder,
		MinLogicalReadsMetricsBuilder,
		LastLogicalReadsMetricsBuilder,
		AverageLogicalReadsMetricsBuilder,
		MaxPageServerReadsMetricsBuilder,
		MinPageServerReadsMetricsBuilder,
		LastPageServerReadsMetricsBuilder,
		AveragePageServerReadsMetricsBuilder,
		MaxLogicalWritesMetricsBuilder,
		MinLogicalWritesMetricsBuilder,
		LastLogicalWritesMetricsBuilder,
		AverageLogicalWritesMetricsBuilder,
		MaxWorkerTimeMetricsBuilder,
		MinWorkerTimeMetricsBuilder,
		LastWorkerTimeMetricsBuilder,
		AverageWorkerTimeMetricsBuilder,
		MaxPageSpillsMetricsBuilder,
		MinPageSpillsMetricsBuilder,
		LastPageSpillsMetricsBuilder,
		AveragePageSpillsMetricsBuilder
	    }
and has to be generetable by StoredProcedureMetricsProviderFactoryMethod.
For common approaches (average, max, min, last) generic implementations of IMetricBuilder are in place: For instances, if you want to compute some average value on a particular field of a PlanCacheItem you can use GenericAverageMetricsBuilder. Required arguments are the name of the metric an a property selector on PlanCacheItem.
... = new GenericAverageMetricsBuilder("PhysicalReadsAverage", s => s.ExecutionStatistics.PhysicalReads.Total);