Null values result in discontinued line chart #131
Description
I have a cartesian containing a column chart and line chart. The problem is, for a value of x, the column chart always has a value of y, but the line chart doesn't necessarily, which results in the attached image
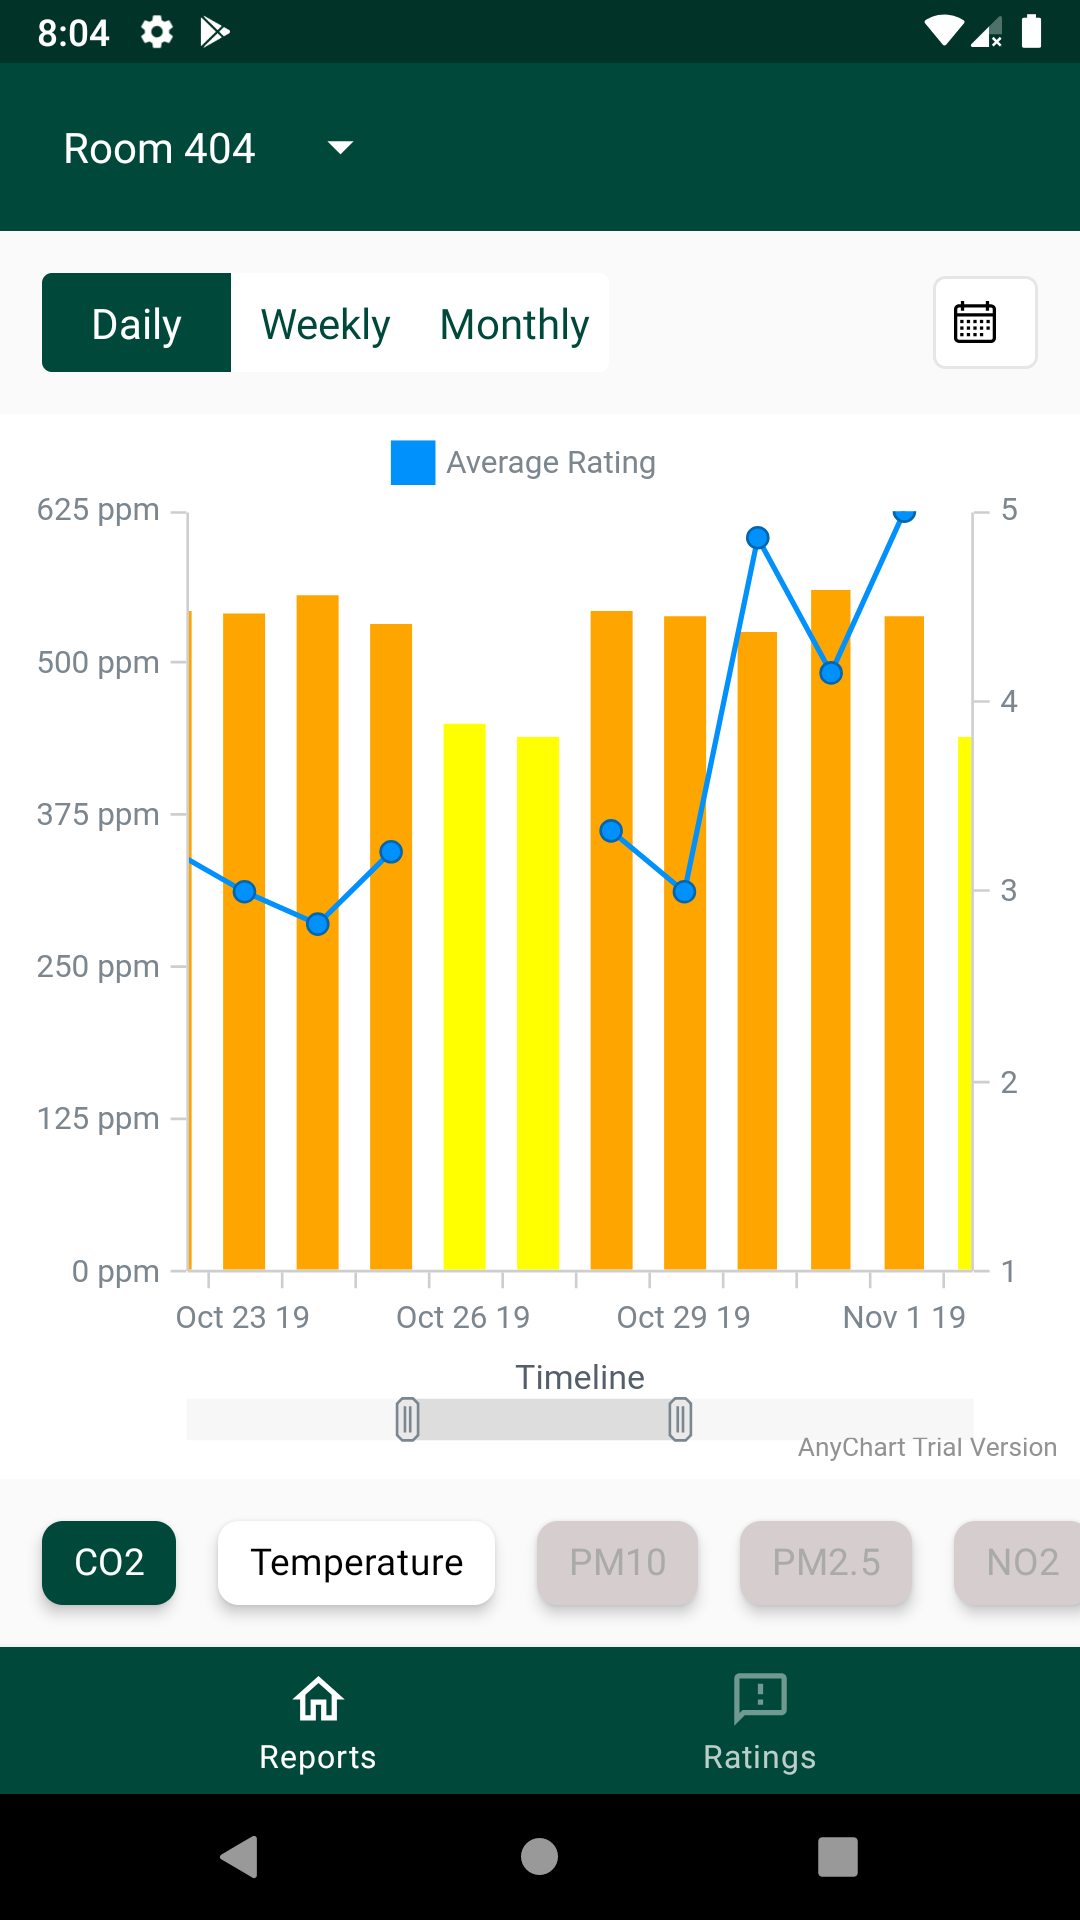
How can I possibly make it a continued line?
Below is my code
            val columnData = reports.map {
                ValueDataEntry(formatDate(groupBy, it.collectedTime), it.value)
            }

            val lineData = reports.filter { it.rating != null }.map {
                ValueDataEntry(formatDate(groupBy, it.collectedTime), it.rating)
            }

            val max = reports.map { it.value }.max() ?: 0f
            cartesian.column(columnData).name(type.toString())
                .legendItem().enabled(false)

            val scalesLinear = Linear.instantiate()
            scalesLinear.minimum(1.0f)
            scalesLinear.maximum(5.0f)
            scalesLinear.ticks("{ interval: 1 }")

            val extraYAxis = cartesian.yAxis(1)
            extraYAxis.orientation(Orientation.RIGHT)
                .scale(scalesLinear)

            val line = cartesian.line(lineData).stroke("{thickness: 2, color: '#0091fc'}")
            line.markers().enabled(true).type(MarkerType.CIRCLE)
            line.name("Average Rating")
            line.yScale(scalesLinear)

            cartesian.yScale().minimum(0.0)

            cartesian.yAxis(0).labels().format("{%Value}{groupsSeparator: } $unit")

            cartesian.xAxis(0).title("Timeline")
            cartesian.xZoom().setToPointsCount(7, true, null)