The purpose of this analysis to determine the Pyber ride sharing data in order to gain an understanding of ridership and fare metrics by the types of cities in which Pyber operates. I compared rural, suburban, and urban cities rides from data set to calculate total rides, drivers, and fares, as well as average fares per ride and per driver. V. Isualize using all the rideshare data from January to early May of 2019 to help improve access to ride-sharing services.
Here are the results of PyBer summary;
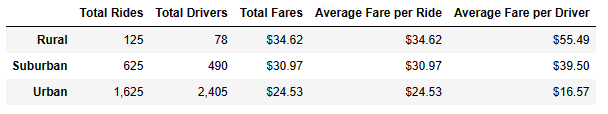
- Urban cities have the highest rides demand while rural cities have the least.
- Urban cities have higher drivers counts than subrural and rural cities.
- The average fare per ride and fare per driver are much lower in urban cities than the other 2 cities.
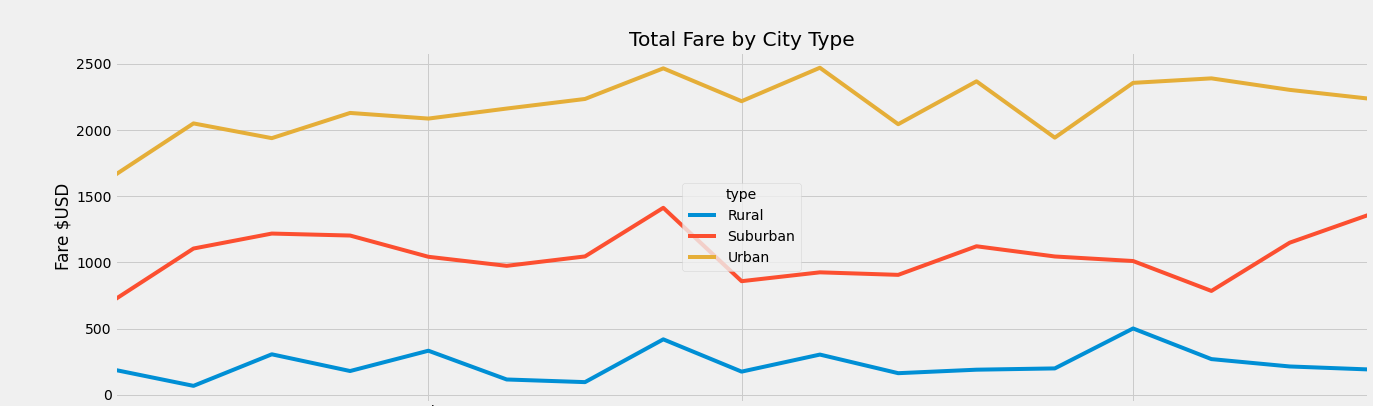
According to the chart;
- The urban cities fares were reported highest from around $1,600 to $2,300 during January to May 2019 period.
- The Suburban cities fares were around $700 to $1300 during this time and fall in between urban and rural cities.
- The rural cities fares were around $300 to $500 during January to May 2019 period.
Based on the analysis mojority of PyBer's revenue is from the urban cities because more usage of PyBer rides in the urban cities. Data for rural cities shows that the average fare per ride and average fare per driver is much higher than Suburban and urban cities. This indicate that rural area based riders are taking trips over a longer distance. Or may be urban cities have more population and people like taking rides instead of driving.