Excited about using Cytoscape.js for visualization #14

Replies: 3 comments

|
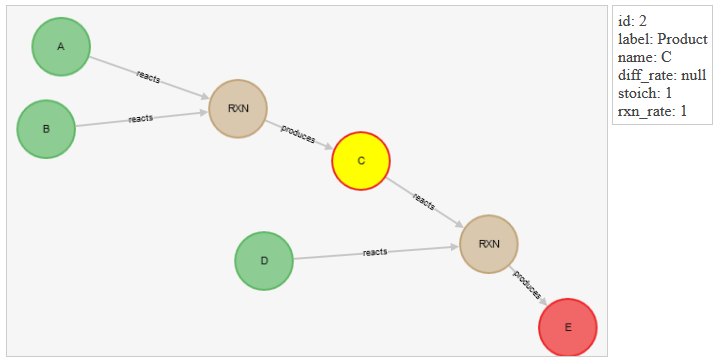
I'm pleased to report that the just-released v. 1 Beta10 version contains a "Vue component" (visualization module) to display networks of reactions. For details, please see the expanded Visualization page The above diagram originates from this experiment about the dynamics of two coupled reactions |

|
I was looking recently at a graph extension for Postgres DB called Age: https://github.com/apache/age and I saw they also offer a viewer for it https://github.com/apache/age-viewer, but I haven't tried to play with it yet. Might prove useful for large graphs. |
|
More recent versions of the
|


Uh oh!
There was an error while loading. Please reload this page.
After investigating numerous software packages to provide visualization for networks of reactions ("graphs" with nodes and edges), Cytoscape.js seems like a winner... and I started using it.
The next code release will include a Vue component to utilize these capabilities! As well as support for it in the Reactions python library, to allow convenient use from the Jupyterlab notebooks.
All reactions