4. Projects
A project includes a set of patients or cell line experiments. The project views provide the statistics for the whole cohort and help users identify important events with integrated user interface.
The summary tab shows the meta data statistics. Oncogenomics automatically determines if the data types is categorical or numeric and shows bar chart or pie chart respectively. If the project has diagnoses >= 10, a sortable table will be displayed.
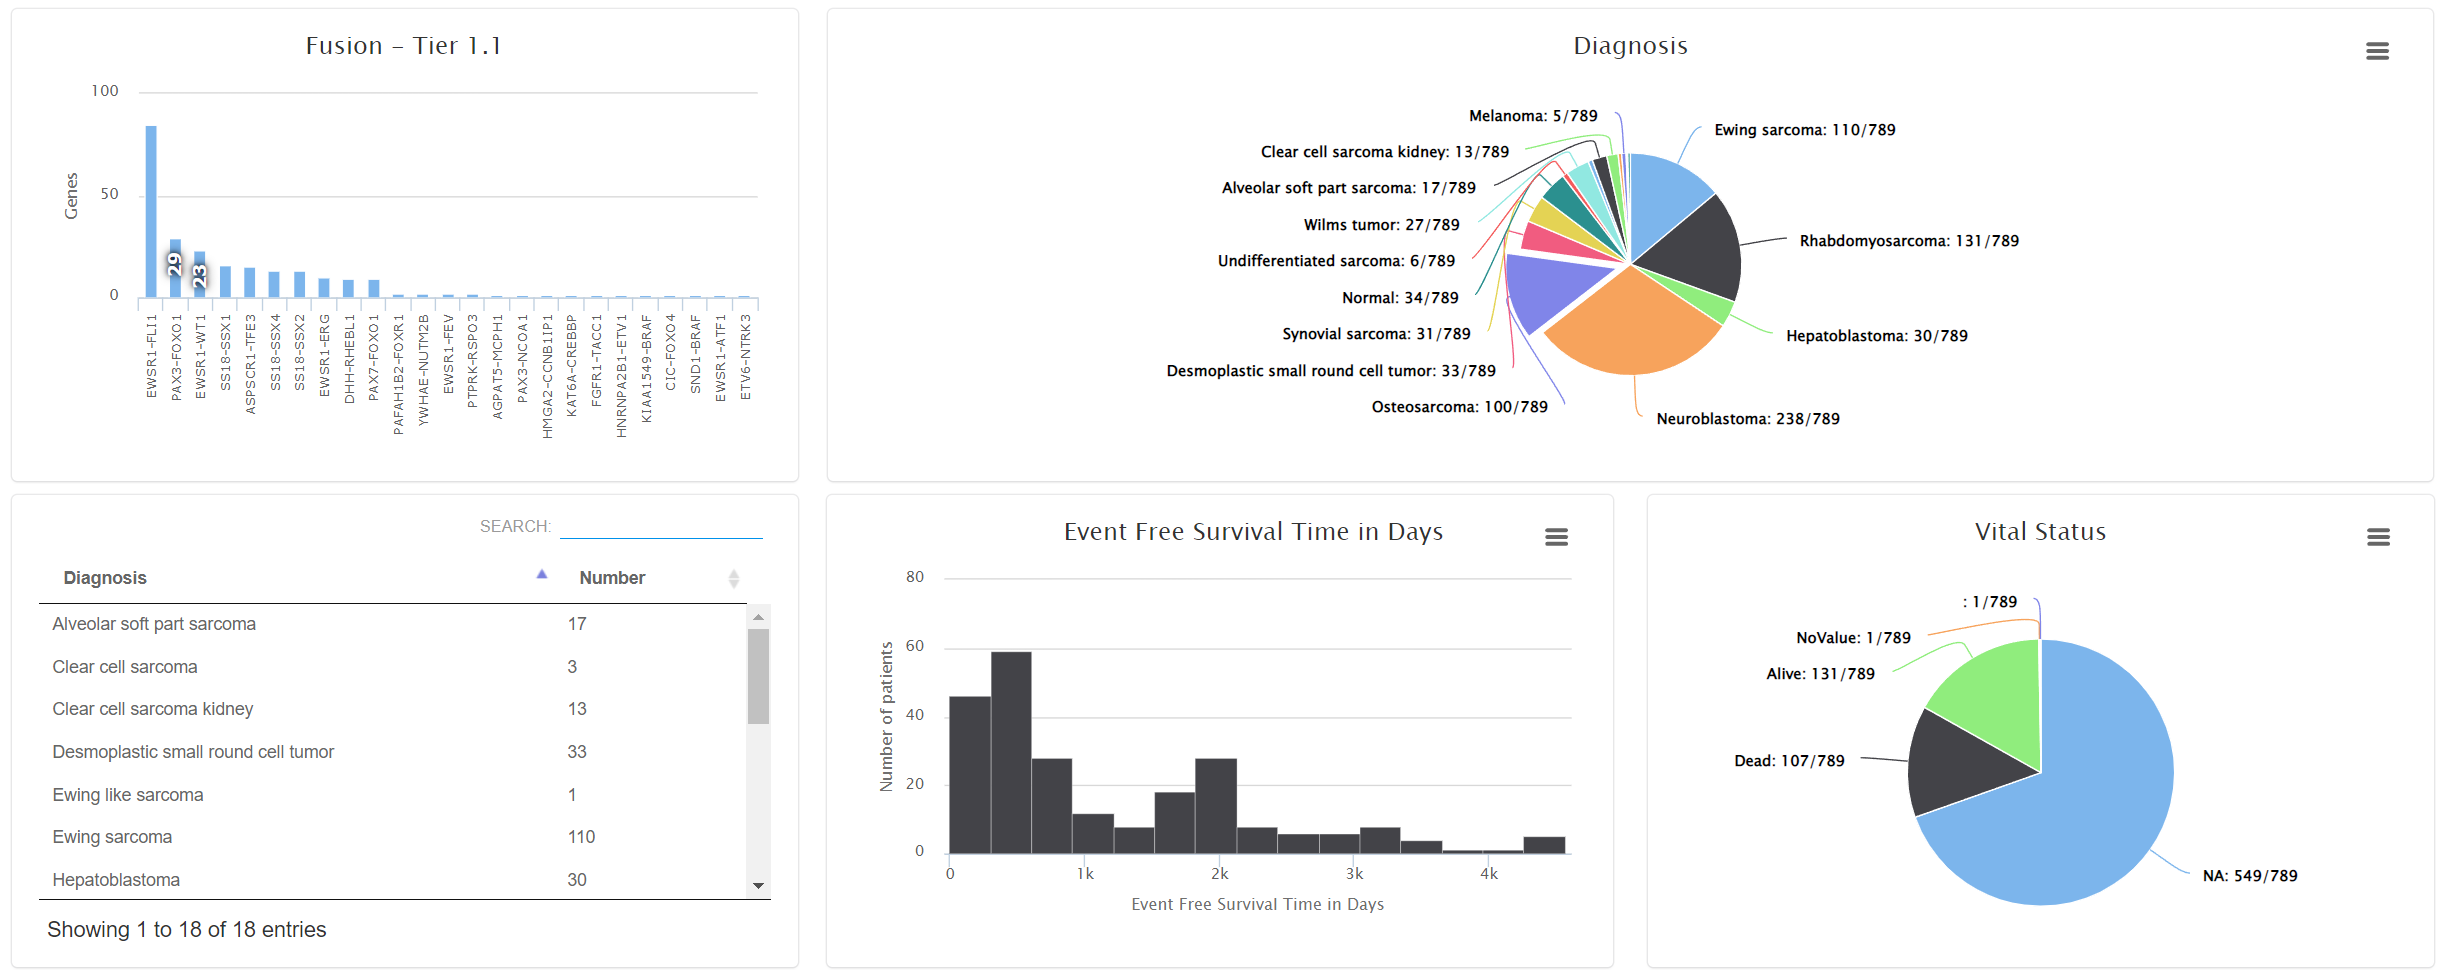
Users can move the mouse over the bar/pie area to see the detailed patient count. By clicking them, a patient table will show up. Users can view the patient pages by selecting the links.
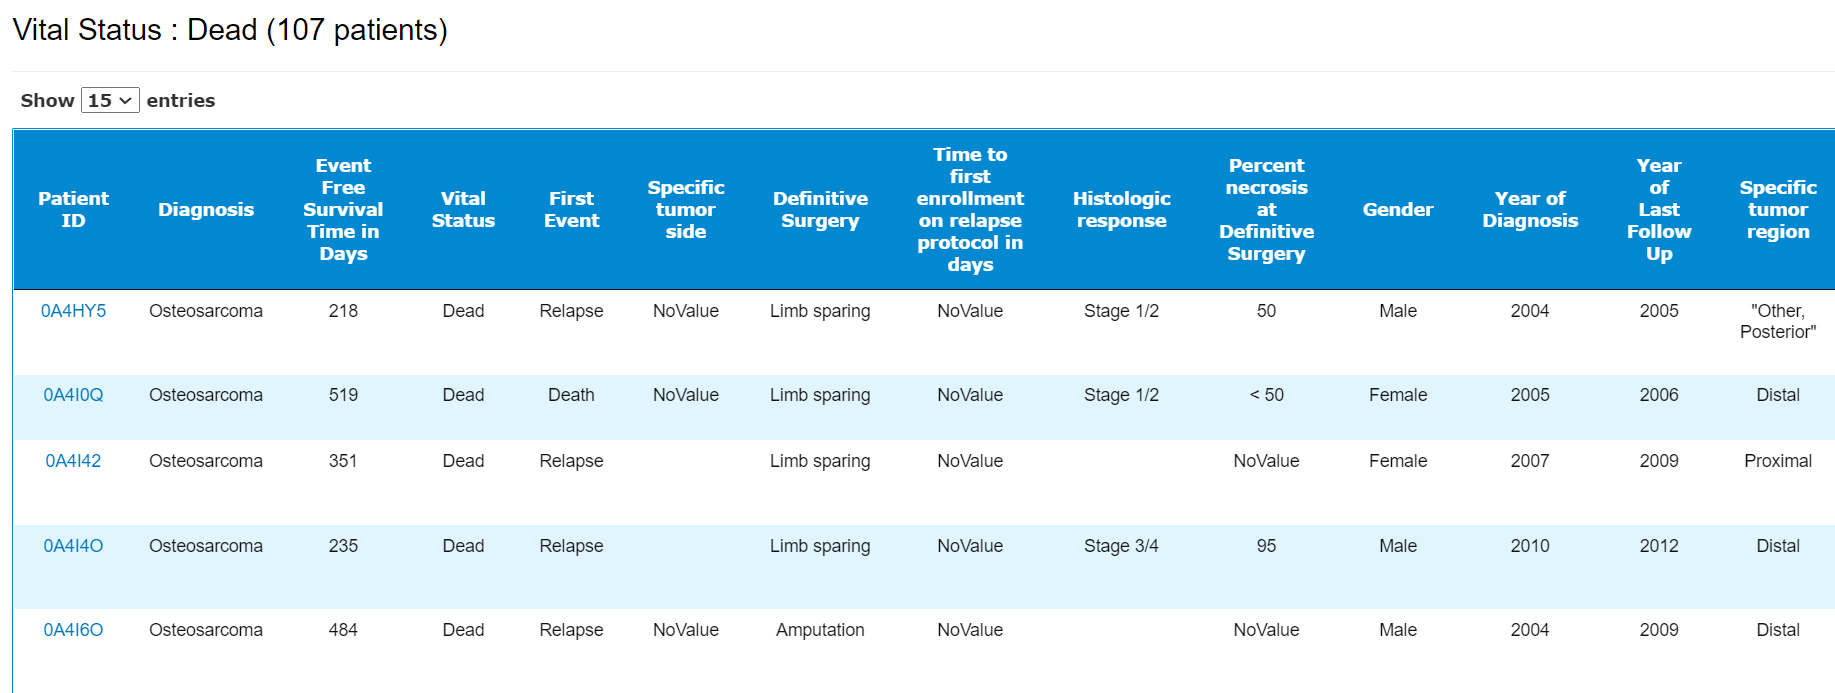
A patient table including all the meta data. By clicking 
The mutations tab shows the summary of the mutations called in the project categorized into the following types:
- Germline: for paired tumor/normal DNA-seq, the variants specific to normal sample.
- Somatic: for paired tumor/normal DNA-seq, the variants specific to tumor sample.
- Tumor: the variants for tumor only DNA-seq samples.
- RNAseq: the RNAseq variants.
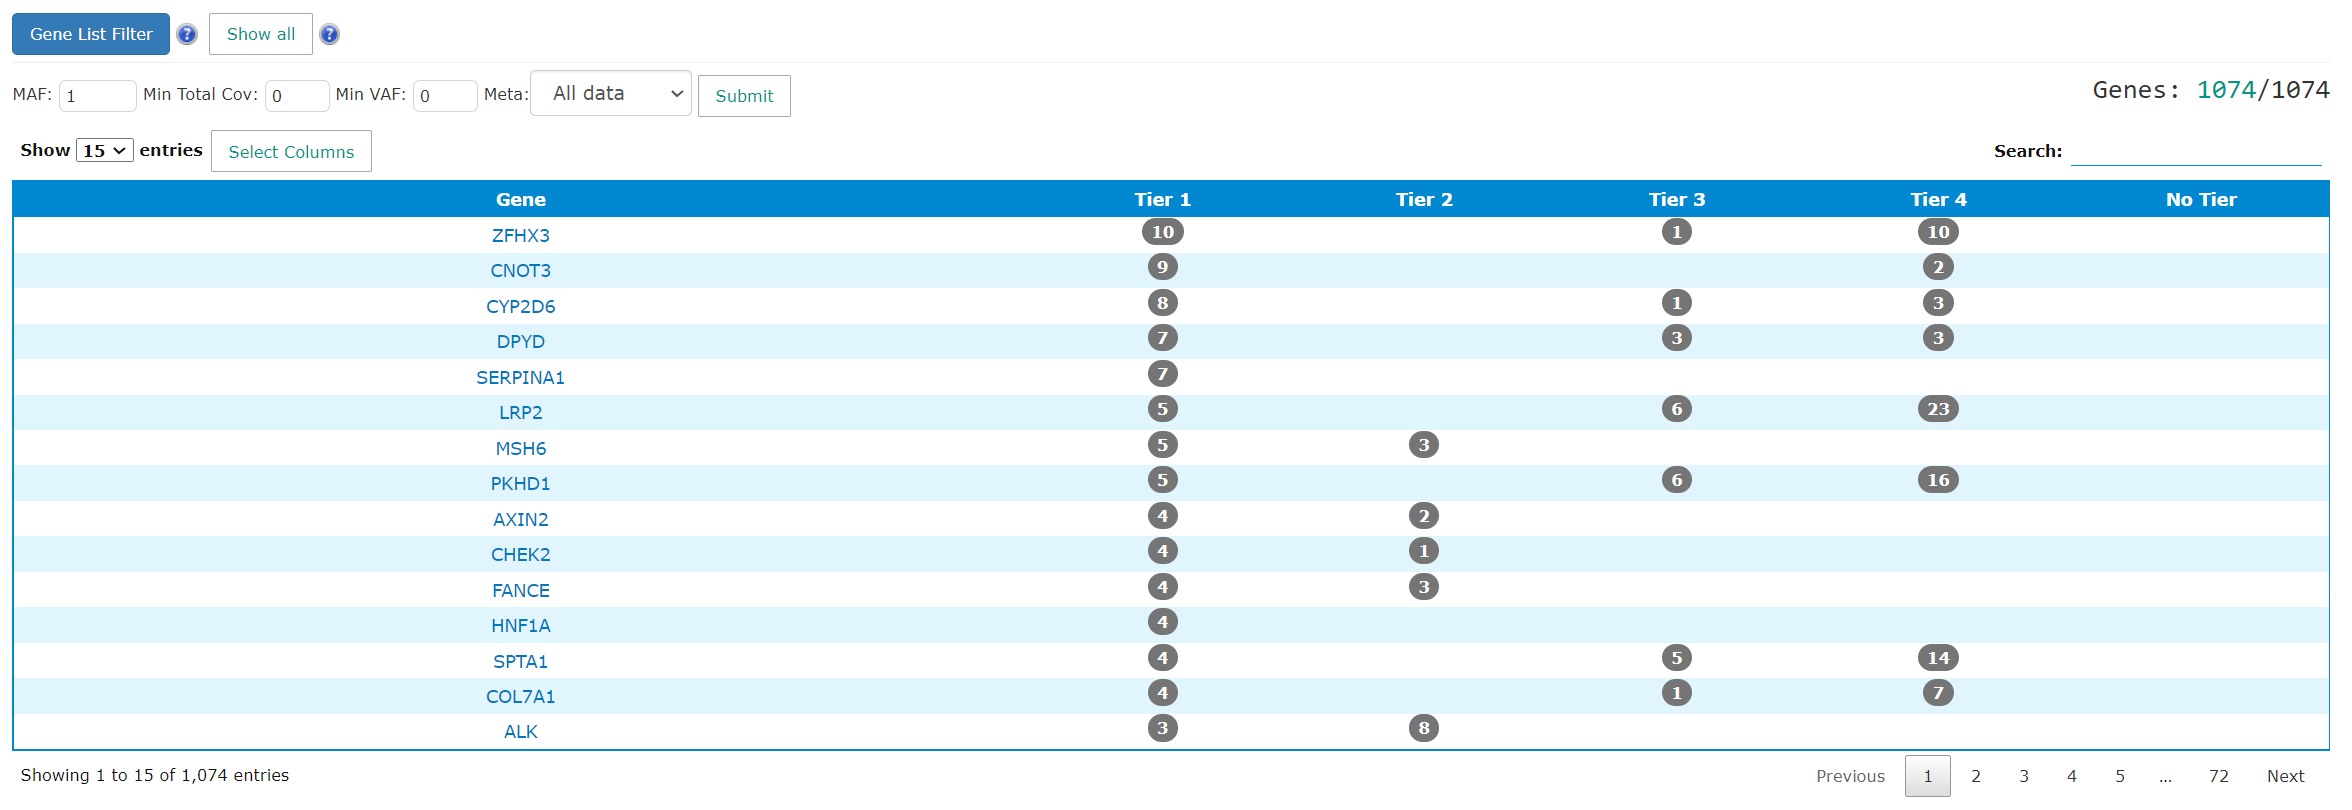
The summary table includes the gene name and the patient count for each tier. The gene name links will direct users to gene summary page. The number in the tiering columns refer to how many patients have mutations in the genes. The link takes users to the gene level mutation pages. The results can be filtered by MAF, coverage, VAF and meta data.
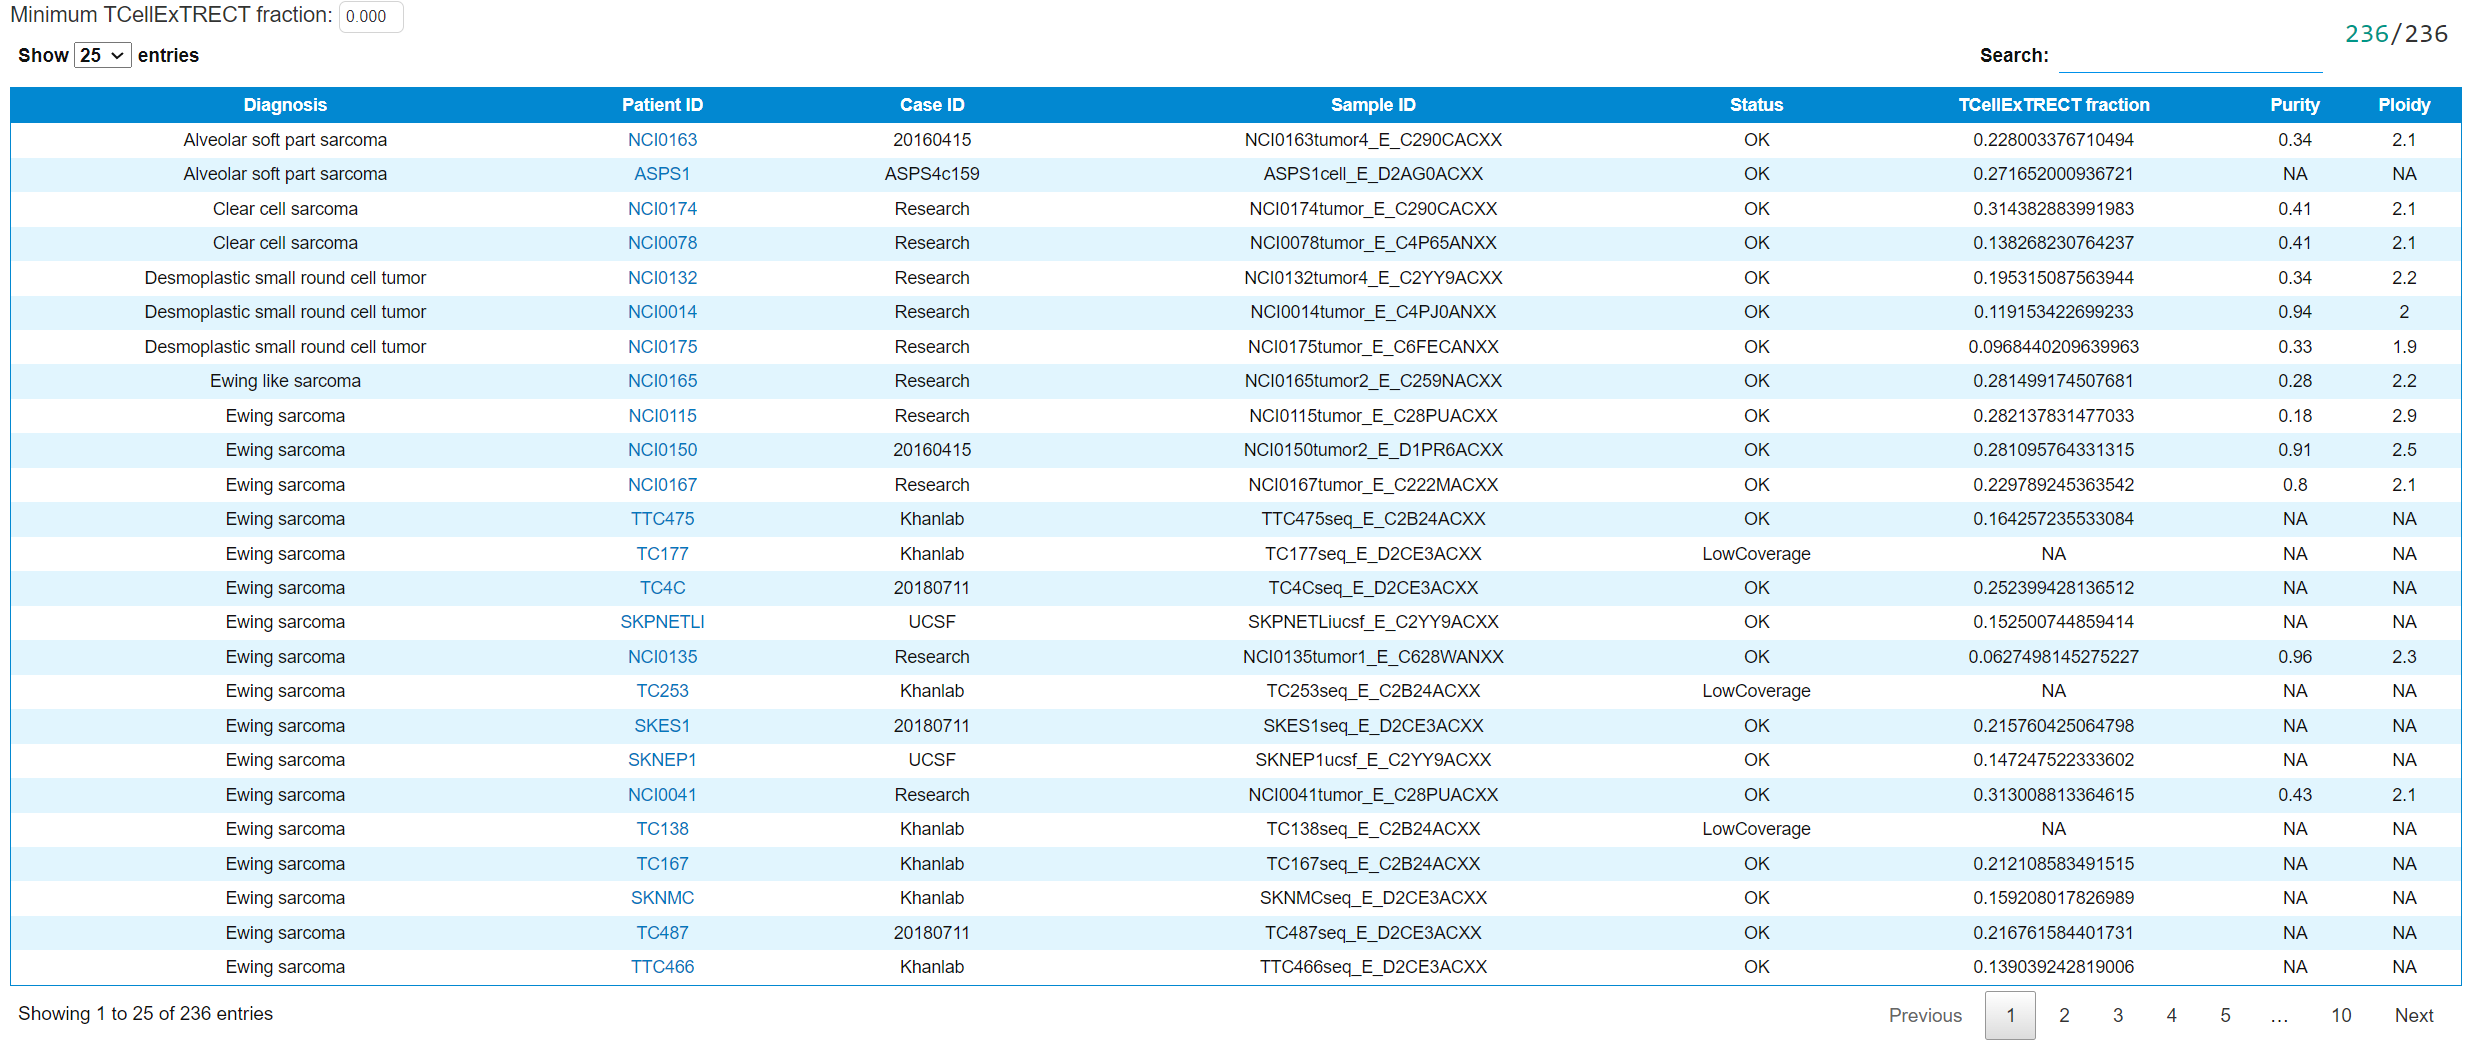
This tab shows the table summary of the T-cell infiltration using TcellExTRECT. The content is explained in the case tab.