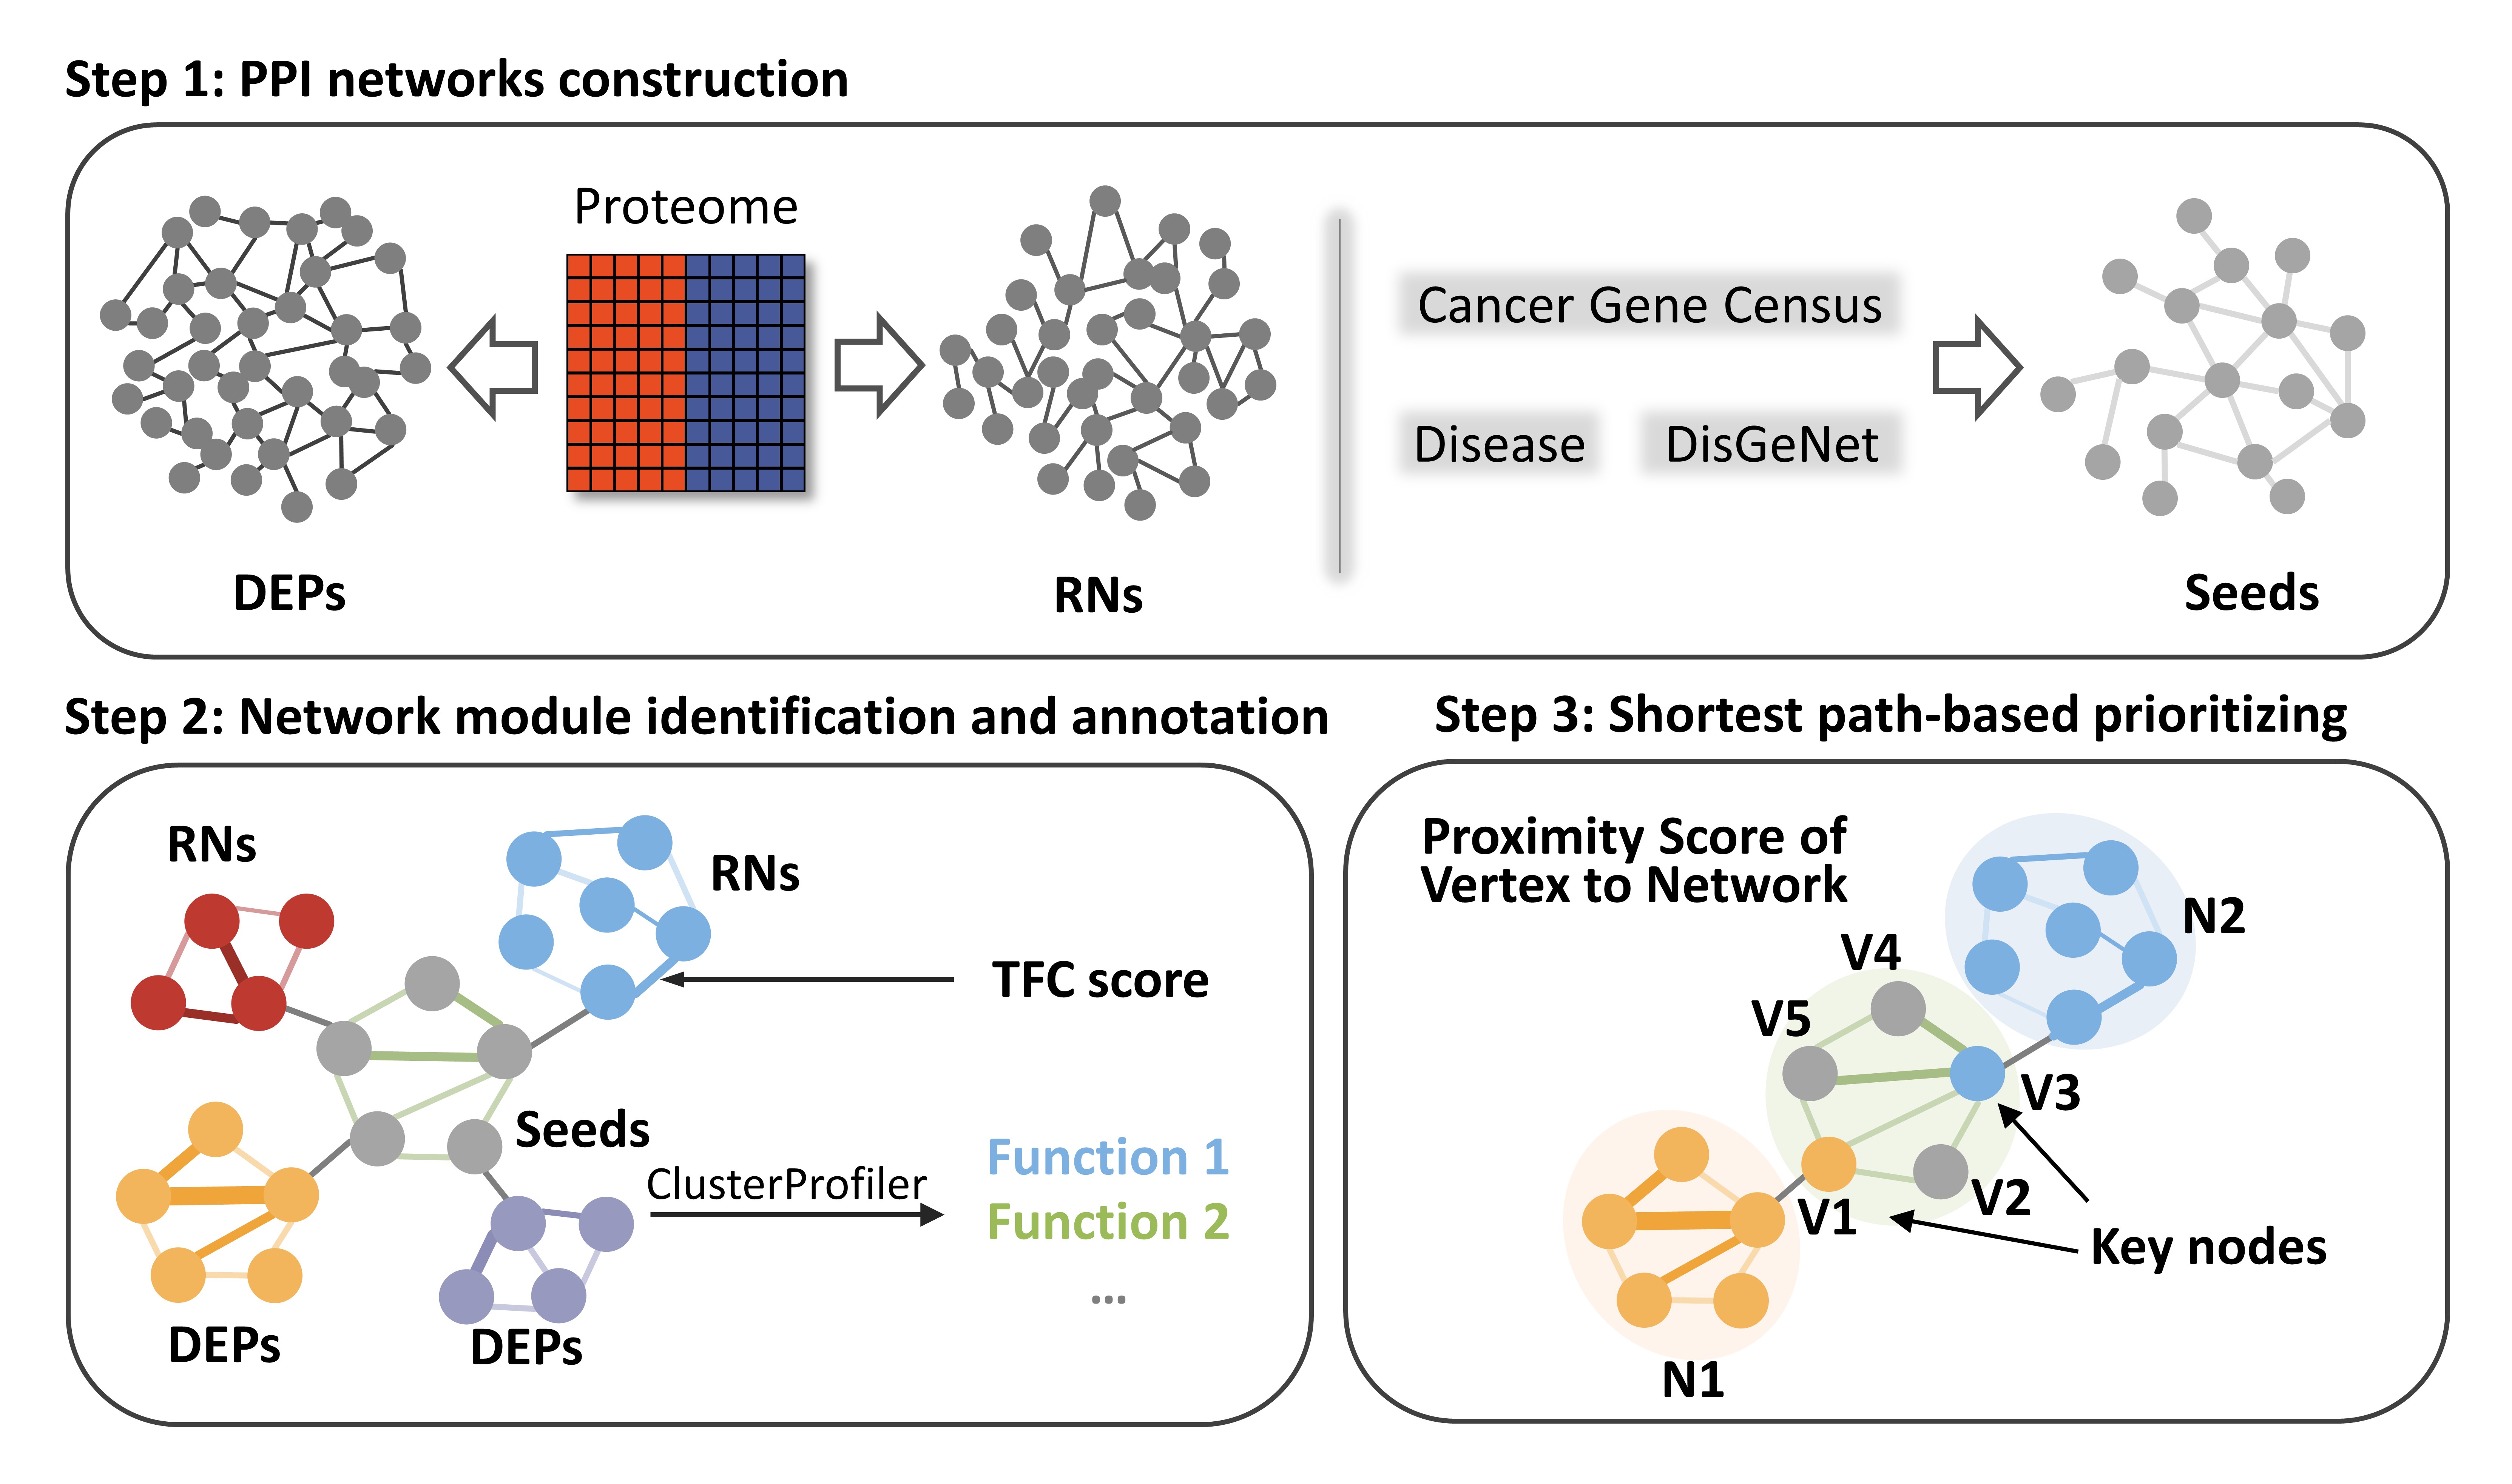
An Integrative Network Analysis to quantify proteomic signatures of cancer, including PPIN construction, network module detection and annotation, and a shortest path-based algorithm.
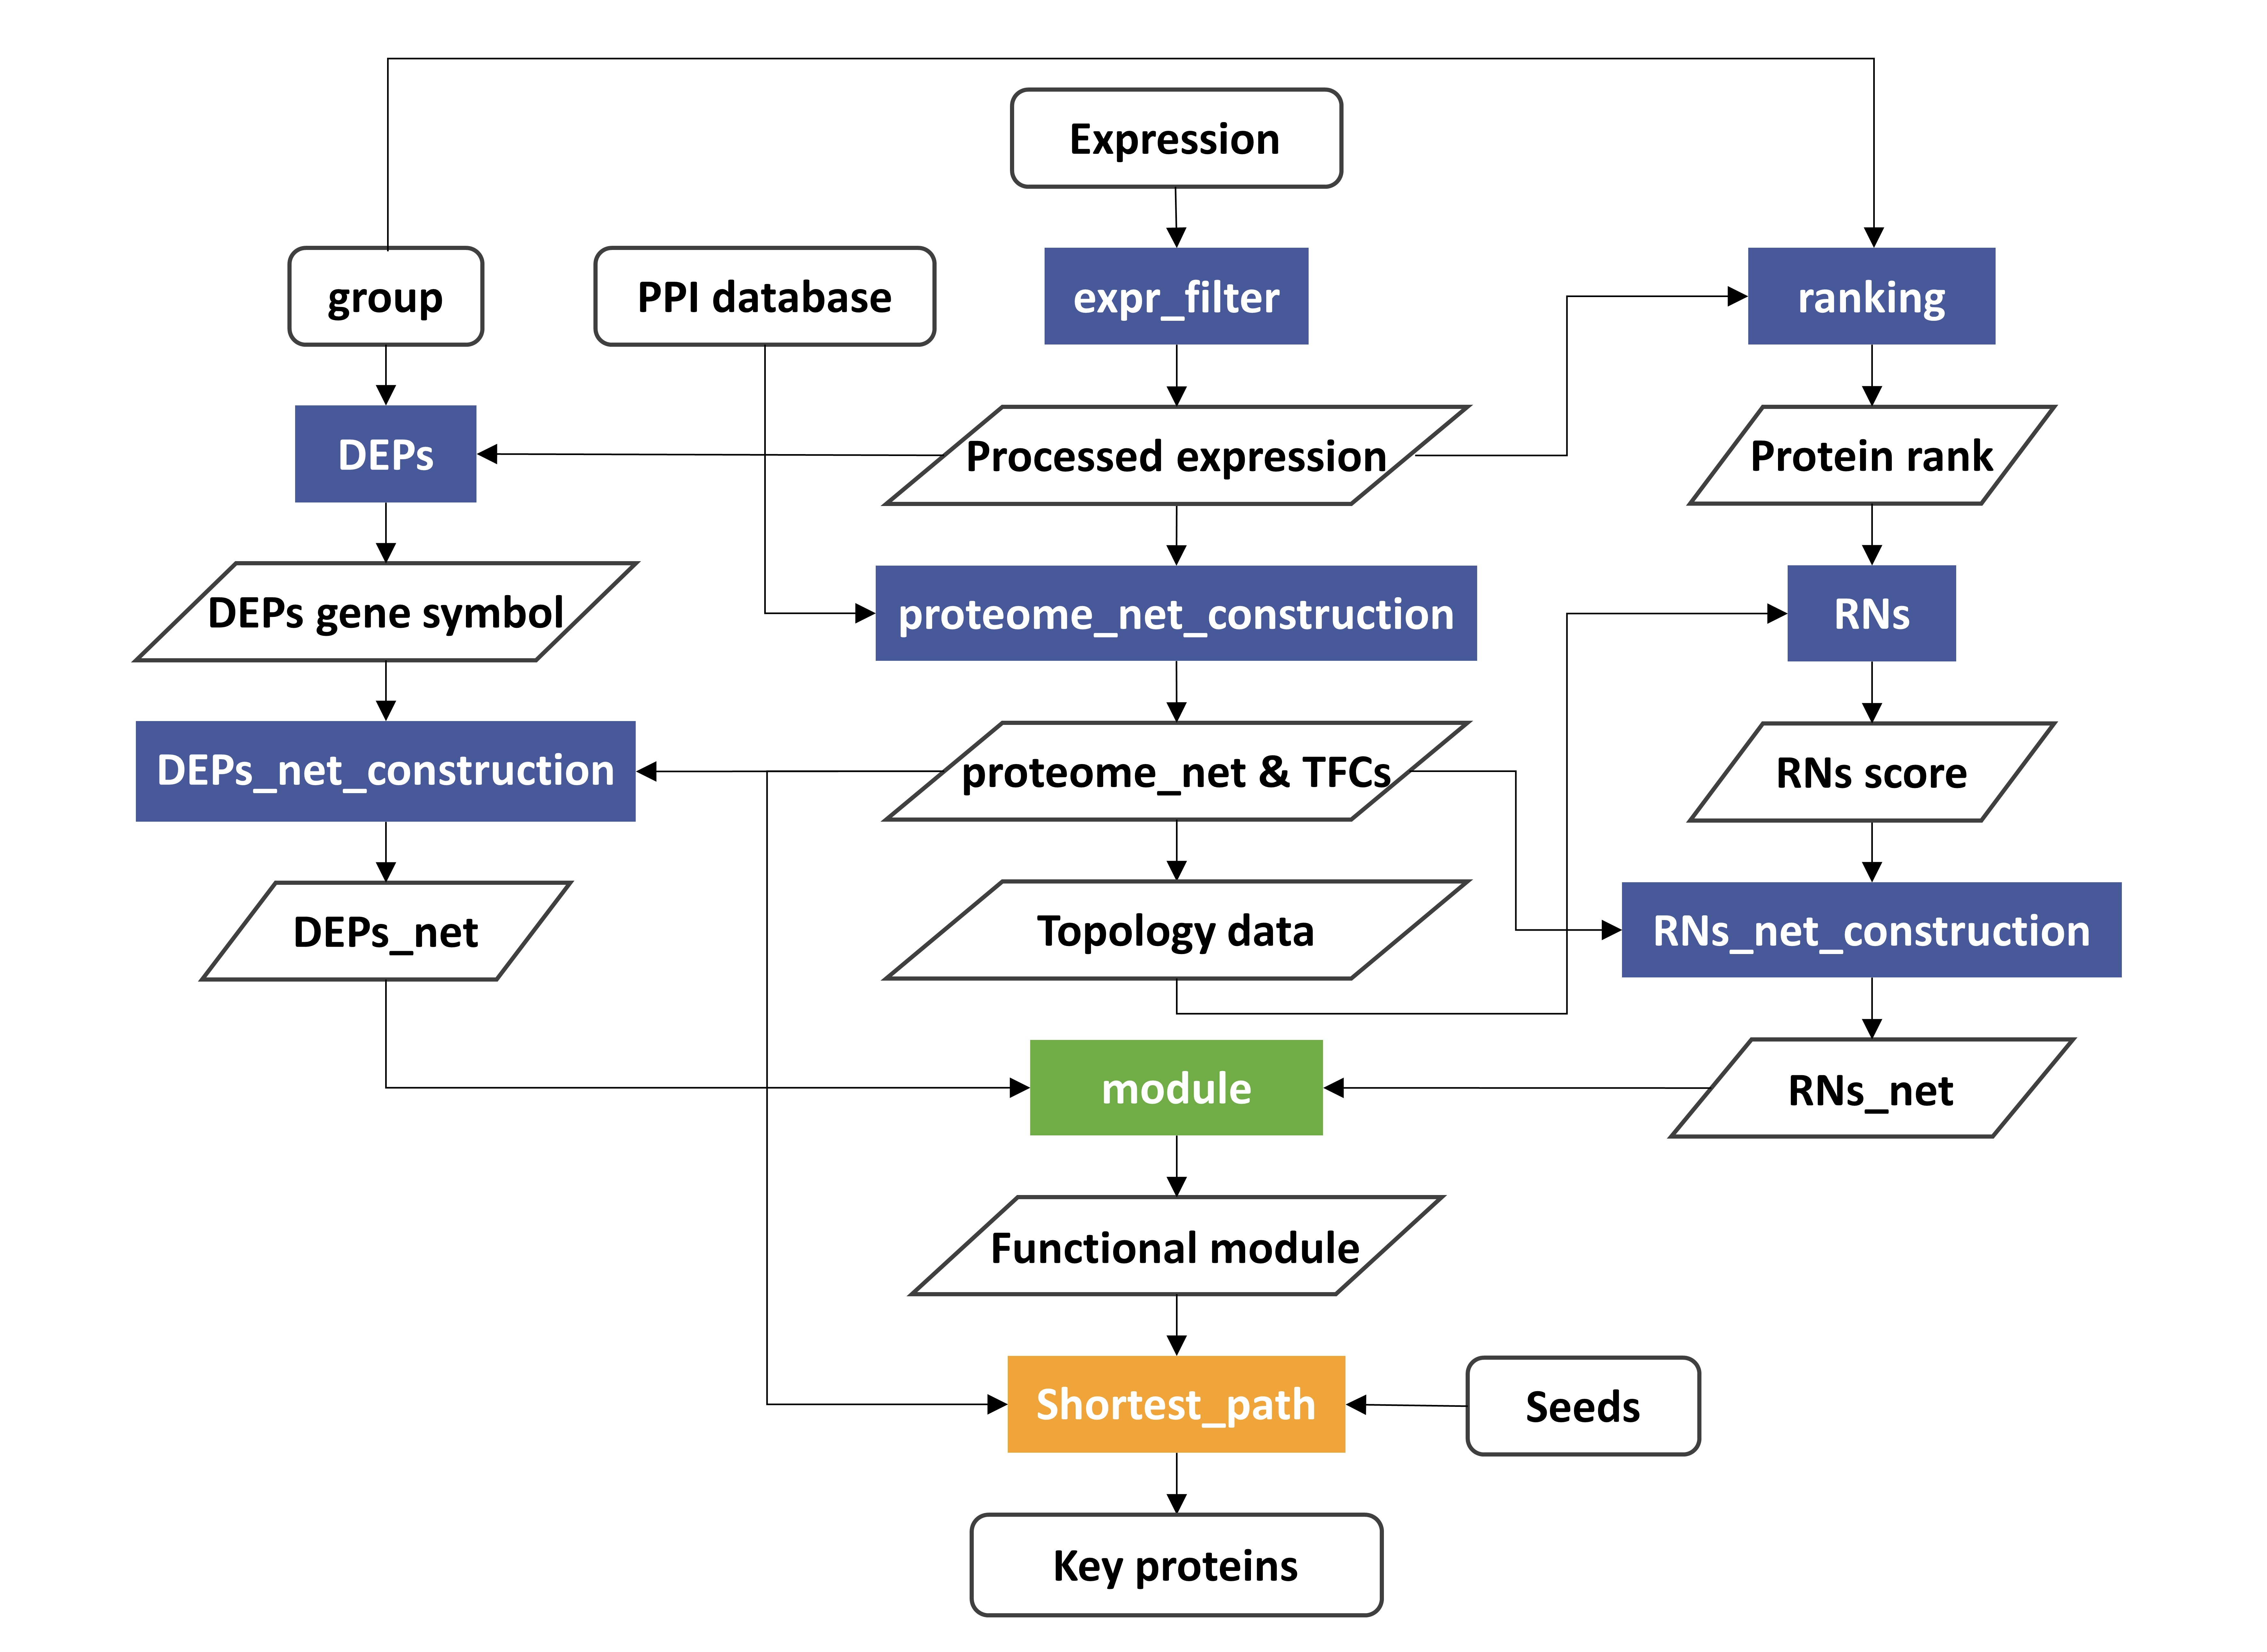
library(INA)
library(openxlsx)
data("ppi_database")
expression <- read.xlsx("./Data/proteome.xlsx", colNames = T)
group <- read.table("./Data/group.txt", header = T)
expression <- expr_filter(expression, filter = 0.5)
proteome_net <- proteome_net_construction(expression, ppi_database, pcc_cut = 0.3)
DEPs_protein <- DEPs(expression, group, fc_cutoff = 1.5, p_cutoff = 0.05)
DEPs_net <- DEPs_net_construction(DEPs_protein, proteome_net)
ranki <- ranking(expression, group)

# Import the whole network into cytoscape to calculate the shortest path and degree
topology_data <- read.csv("./Data/Sheet 1 default node.csv", header = T, stringsAsFactors = F)
RN_score <- RNs(topology_data, ranki)
RNs_net <- RNs_net_construction(RN_score, proteome_net, top_cut = 50)
DEPs_module <- module(DEPs_net, module_cut = 9)
# example: select module 3 to calculate psv2n scores
select_vertex <- read.xlsx('./Data/vertex.xlsx', colNames = T)
seed2DEPs <- Shortest_path(select_vertex, proteome_net)
For requirement of more data and code, please contact zhouziyun1900@hotmail.com