I attempted to deploy 1.0.33 to prod over the weekend while traffic was minimal, but as soon as it finished deploying, new relic reported incidents because of long transaction times and high error rates. I also tried deploying 1.0.35 and 1.0.31, same issue, so it looks like whatever is causing this was introduced in 1.0.31.
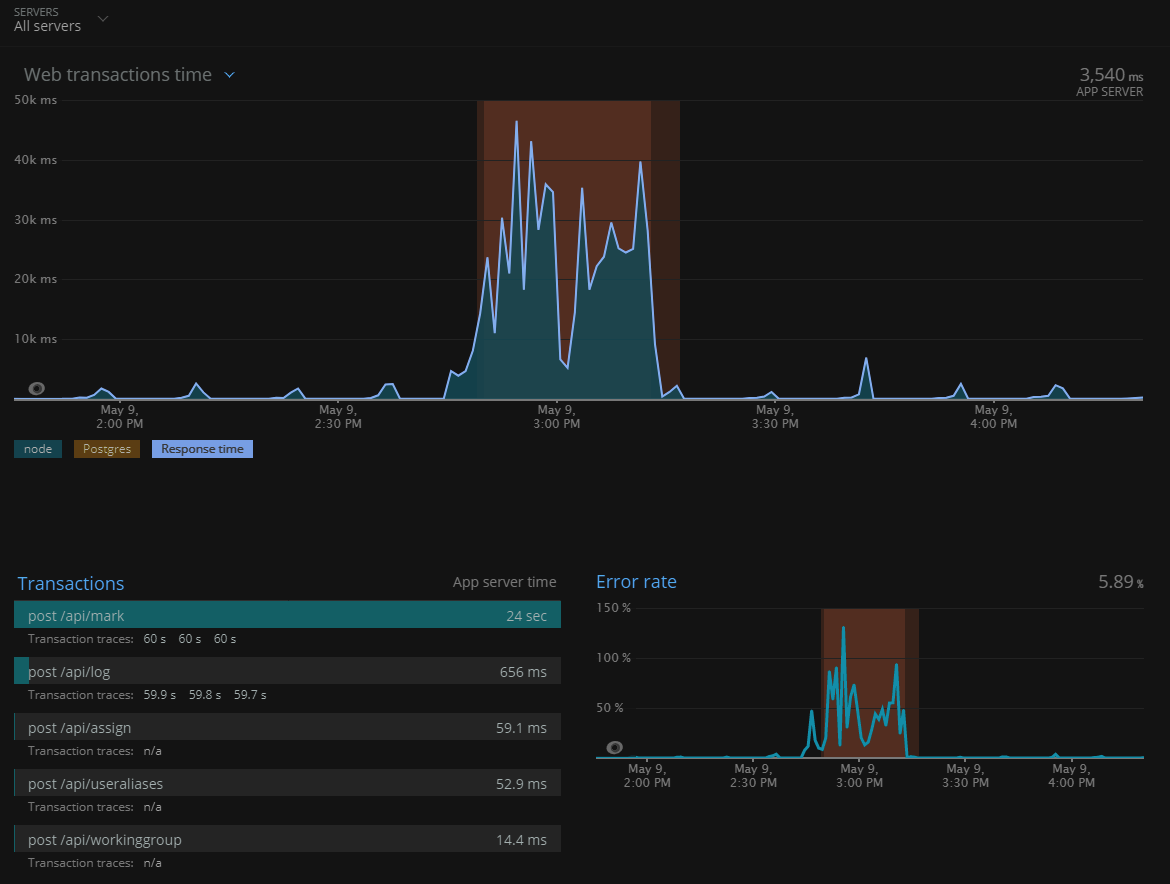
The transaction that was causing the issue is a POST to /api/mark. This operation typically executes in under 20ms, but during the incident it was at 52 seconds.
The error rate averaged about 30%, but I did not see any errors that aren't already occurring on 1.0.30, so I suspect that the issue lies with the POST I mentioned above.
But in case it happens to be relevant, the error during the incident was:
Unknown Error: QueryFailedError: null value in column "type" violates not-null constraint
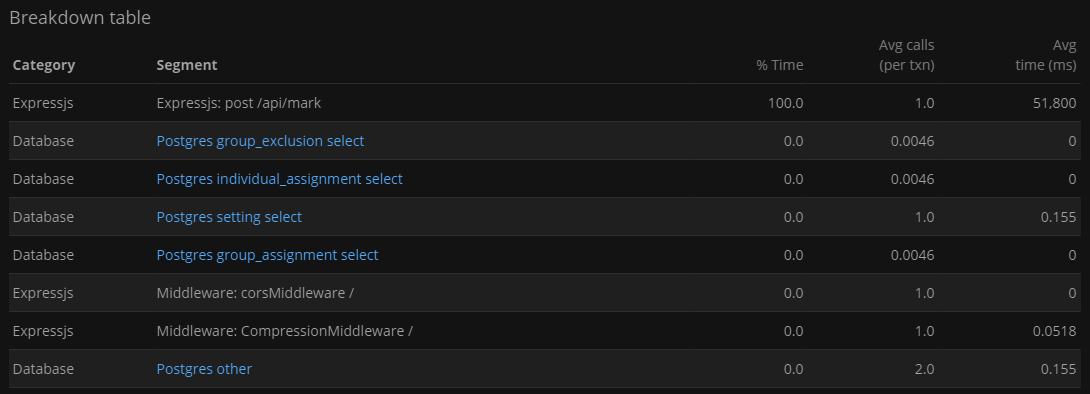
Here is the breakdown from new relic for the /api/mark call. Looks like an issue in the code and not a database call
Here's what the new relic graphs looked like. Transaction time and error rate both spiked immediately when I deployed the new backend version
I attempted to deploy 1.0.33 to prod over the weekend while traffic was minimal, but as soon as it finished deploying, new relic reported incidents because of long transaction times and high error rates. I also tried deploying 1.0.35 and 1.0.31, same issue, so it looks like whatever is causing this was introduced in 1.0.31.
The transaction that was causing the issue is a POST to /api/mark. This operation typically executes in under 20ms, but during the incident it was at 52 seconds.
The error rate averaged about 30%, but I did not see any errors that aren't already occurring on 1.0.30, so I suspect that the issue lies with the POST I mentioned above.
But in case it happens to be relevant, the error during the incident was:
Unknown Error: QueryFailedError: null value in column "type" violates not-null constraintHere is the breakdown from new relic for the /api/mark call. Looks like an issue in the code and not a database call
Here's what the new relic graphs looked like. Transaction time and error rate both spiked immediately when I deployed the new backend version
