Mandelbrot set visualization
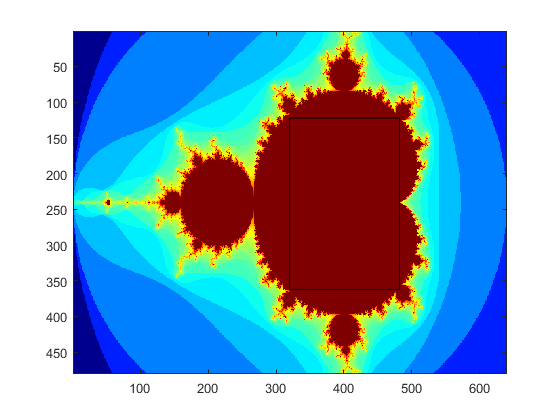
I will try make Cornell University ECE 5760: Laboratory 3 Mandelbrot set visualization. http://people.ece.cornell.edu/land/courses/ece5760/LABS/s2019/lab3_mandelbrot.html
Lectures:
Calculations are performed using floating point
| Sign | Exponent | Mantissa |
| 1bit | 8bits | 18bits |
2^0 => Exponent = 'd127 = 'h7f
Mantissa = [ ( 1-2^(-126) ) ; 0.5 ]