During Reseach and Development, projects quickly go through multiple iterations and need to compare alternatives. Current data visualization techniques do not enable managers to track the cost impacts of design decisions.
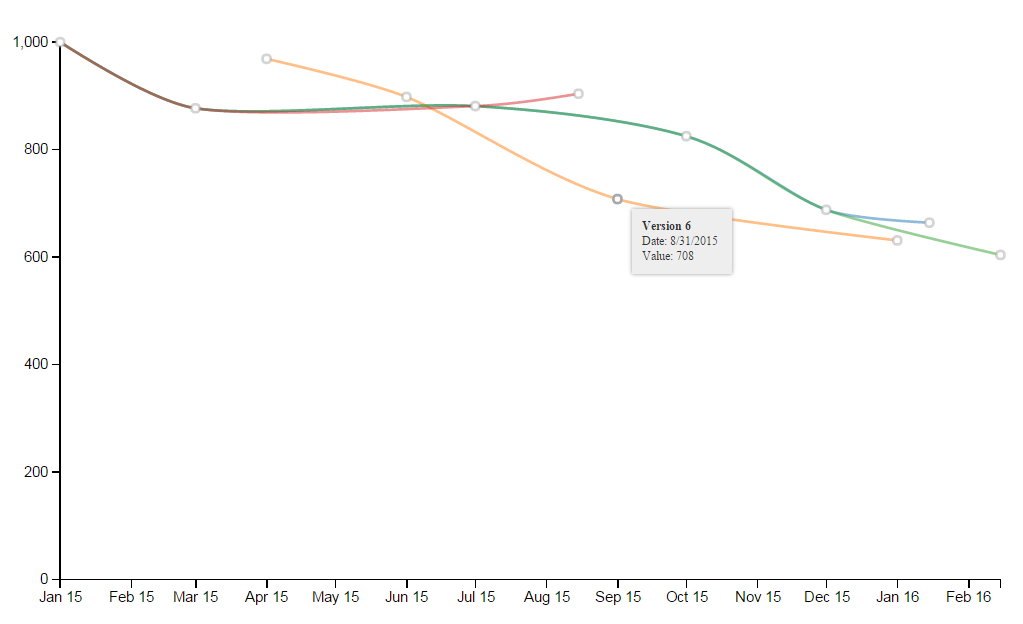
By combining the time analysis of a line chart with the parent / child dependency overview of a network graph, managers would be supported in their decisions.