This is my first project while working at my previous job place. I analyzed a dataset from kaggle about unicorn companies around the world. A unicorn company, or unicorn startup, is a private company with a valuation of over $1 billion. As of June 2022, there are over 1,000 unicorns around the world. Popular former unicorns include Airbnb, Meta, and Google. Variants include a decacorn, valued at over $10 billion, and a hectocorn, valued at over $100 billion. The dataset contained 1061 unicorns and 10 columns which included information about company, valuation, date joined, country, city, industry, select founder, year founded, funding and financial stage.
Excel, Power Query and Power BI
After importing my data into power query, I checked for duplicates(found none),the validity of my data using column distribution, quality and profiling and removed columns not neccessary for my analysis. I also made sure my columns were in the right data type.
I noticed the select investors column contained many investors together so i split them using the "split by delimiter function"(since i needed the each investor).

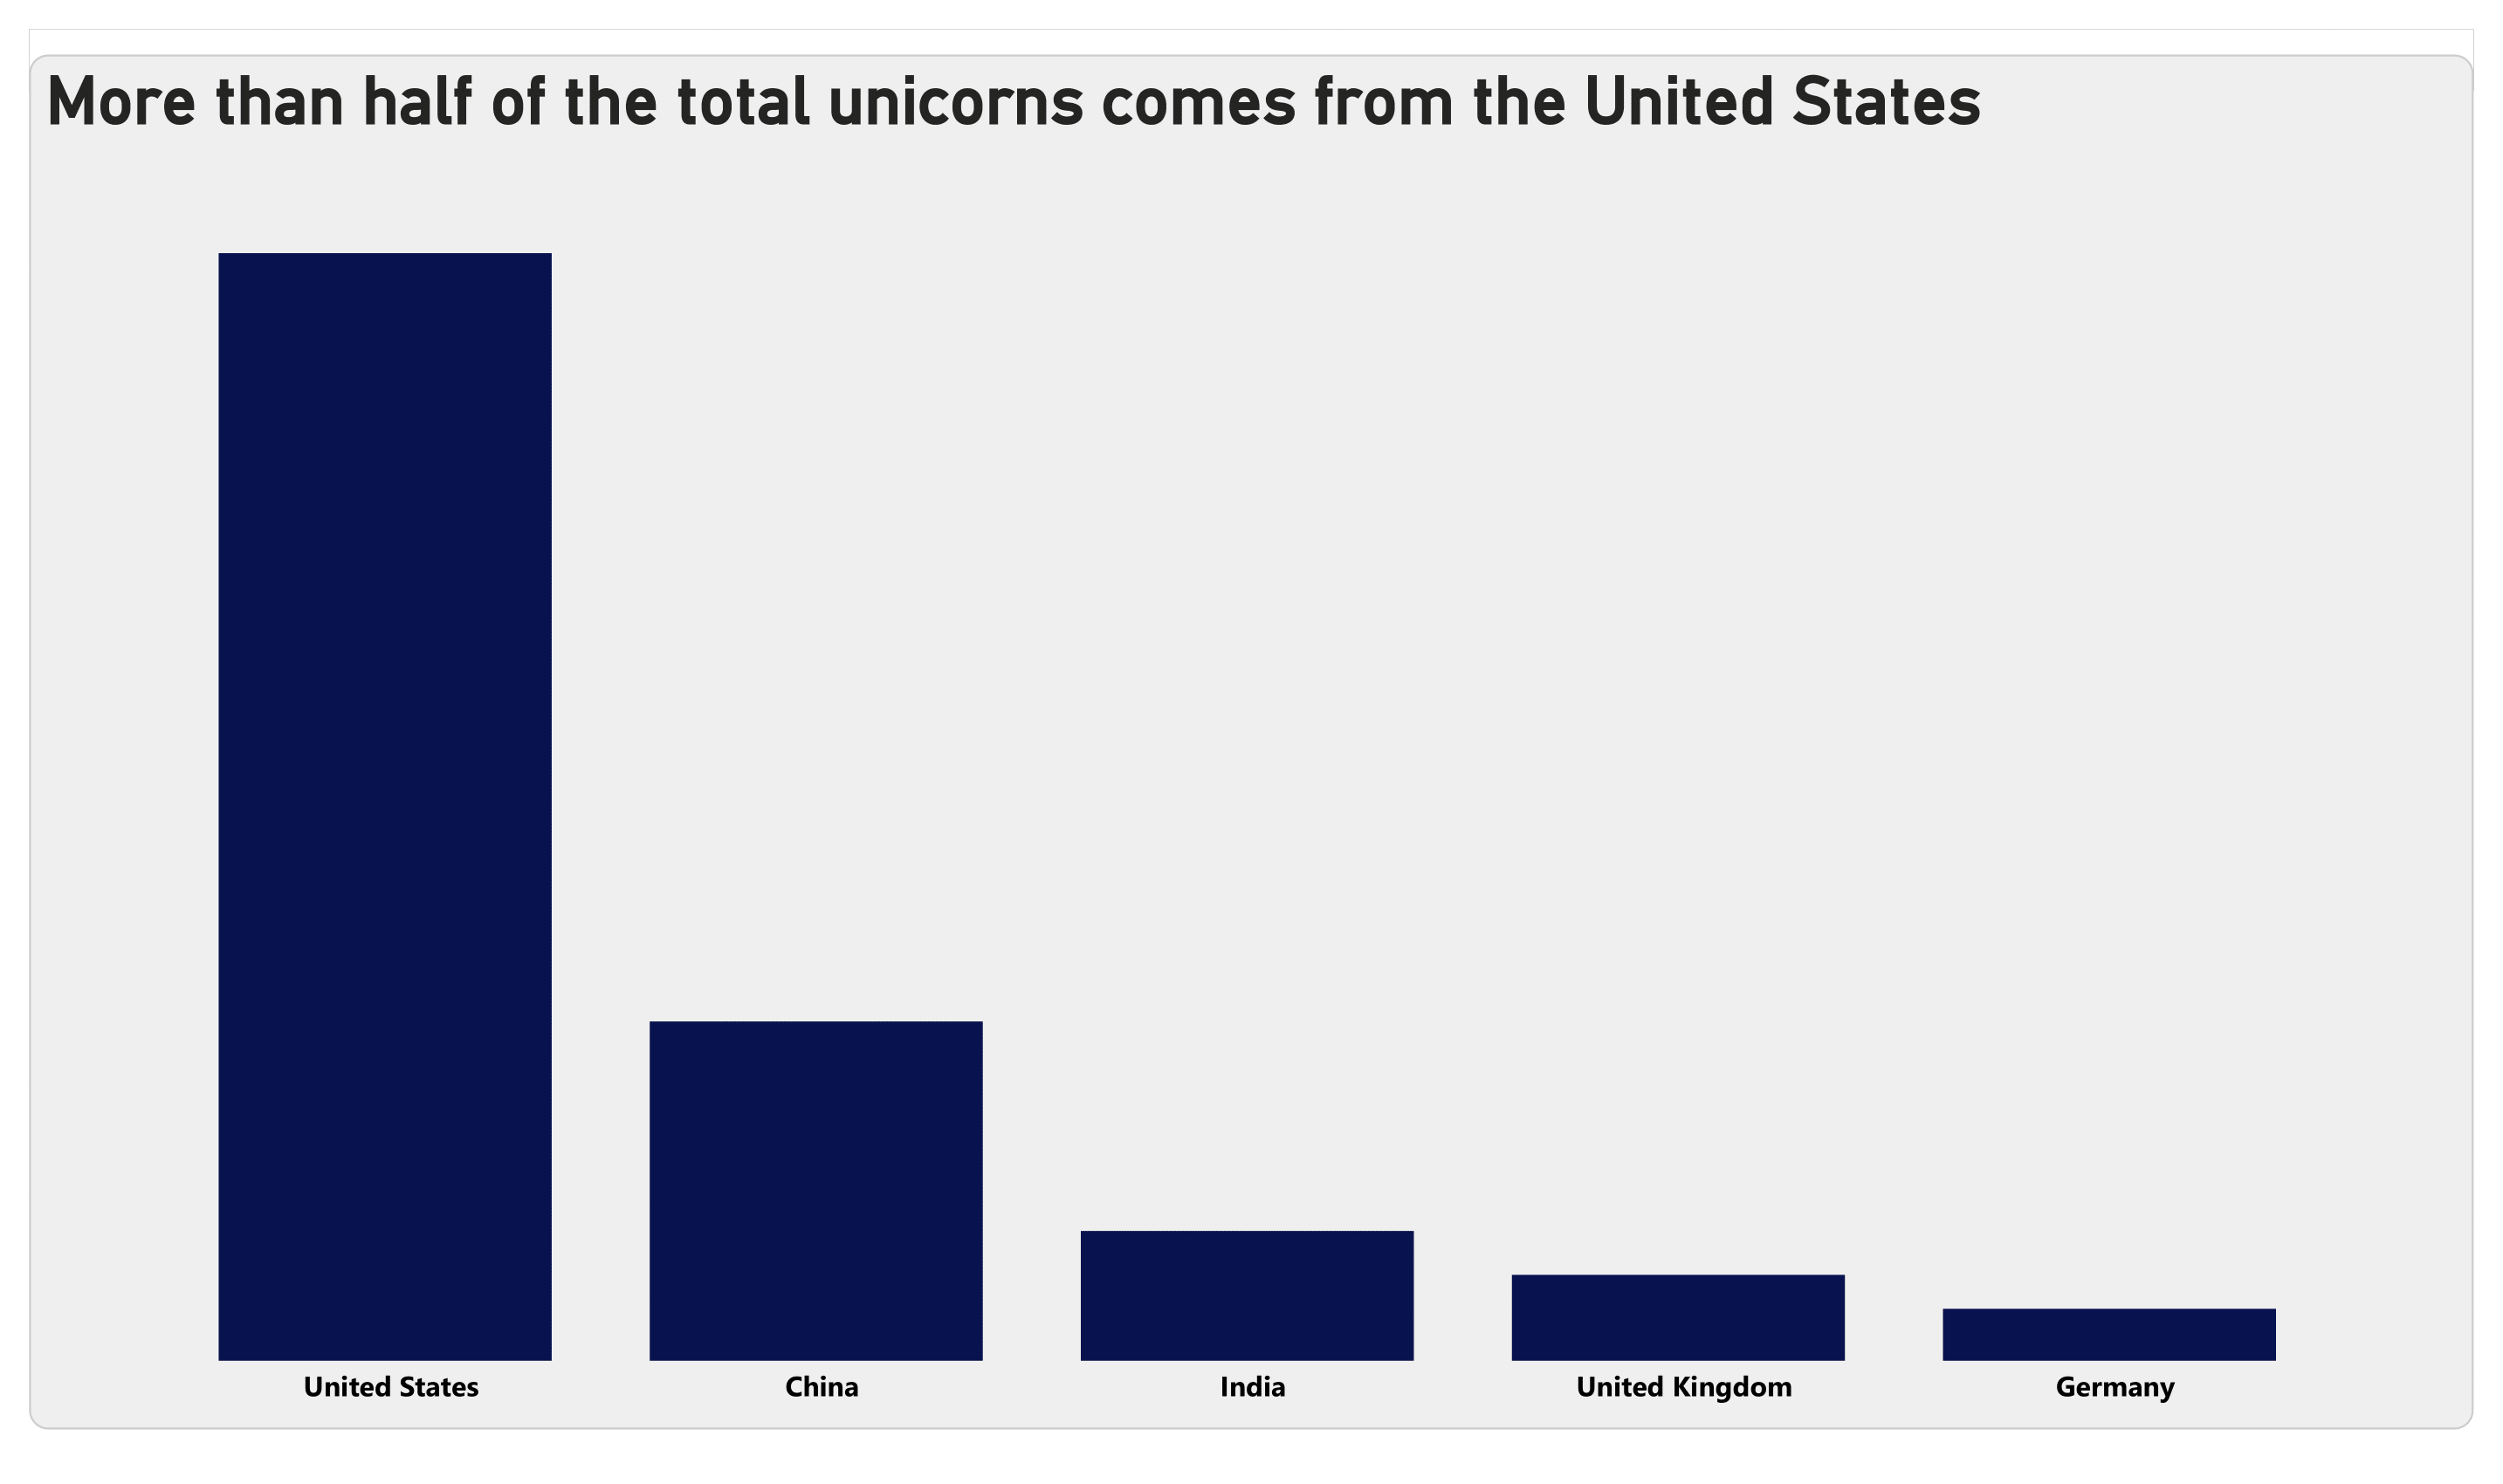
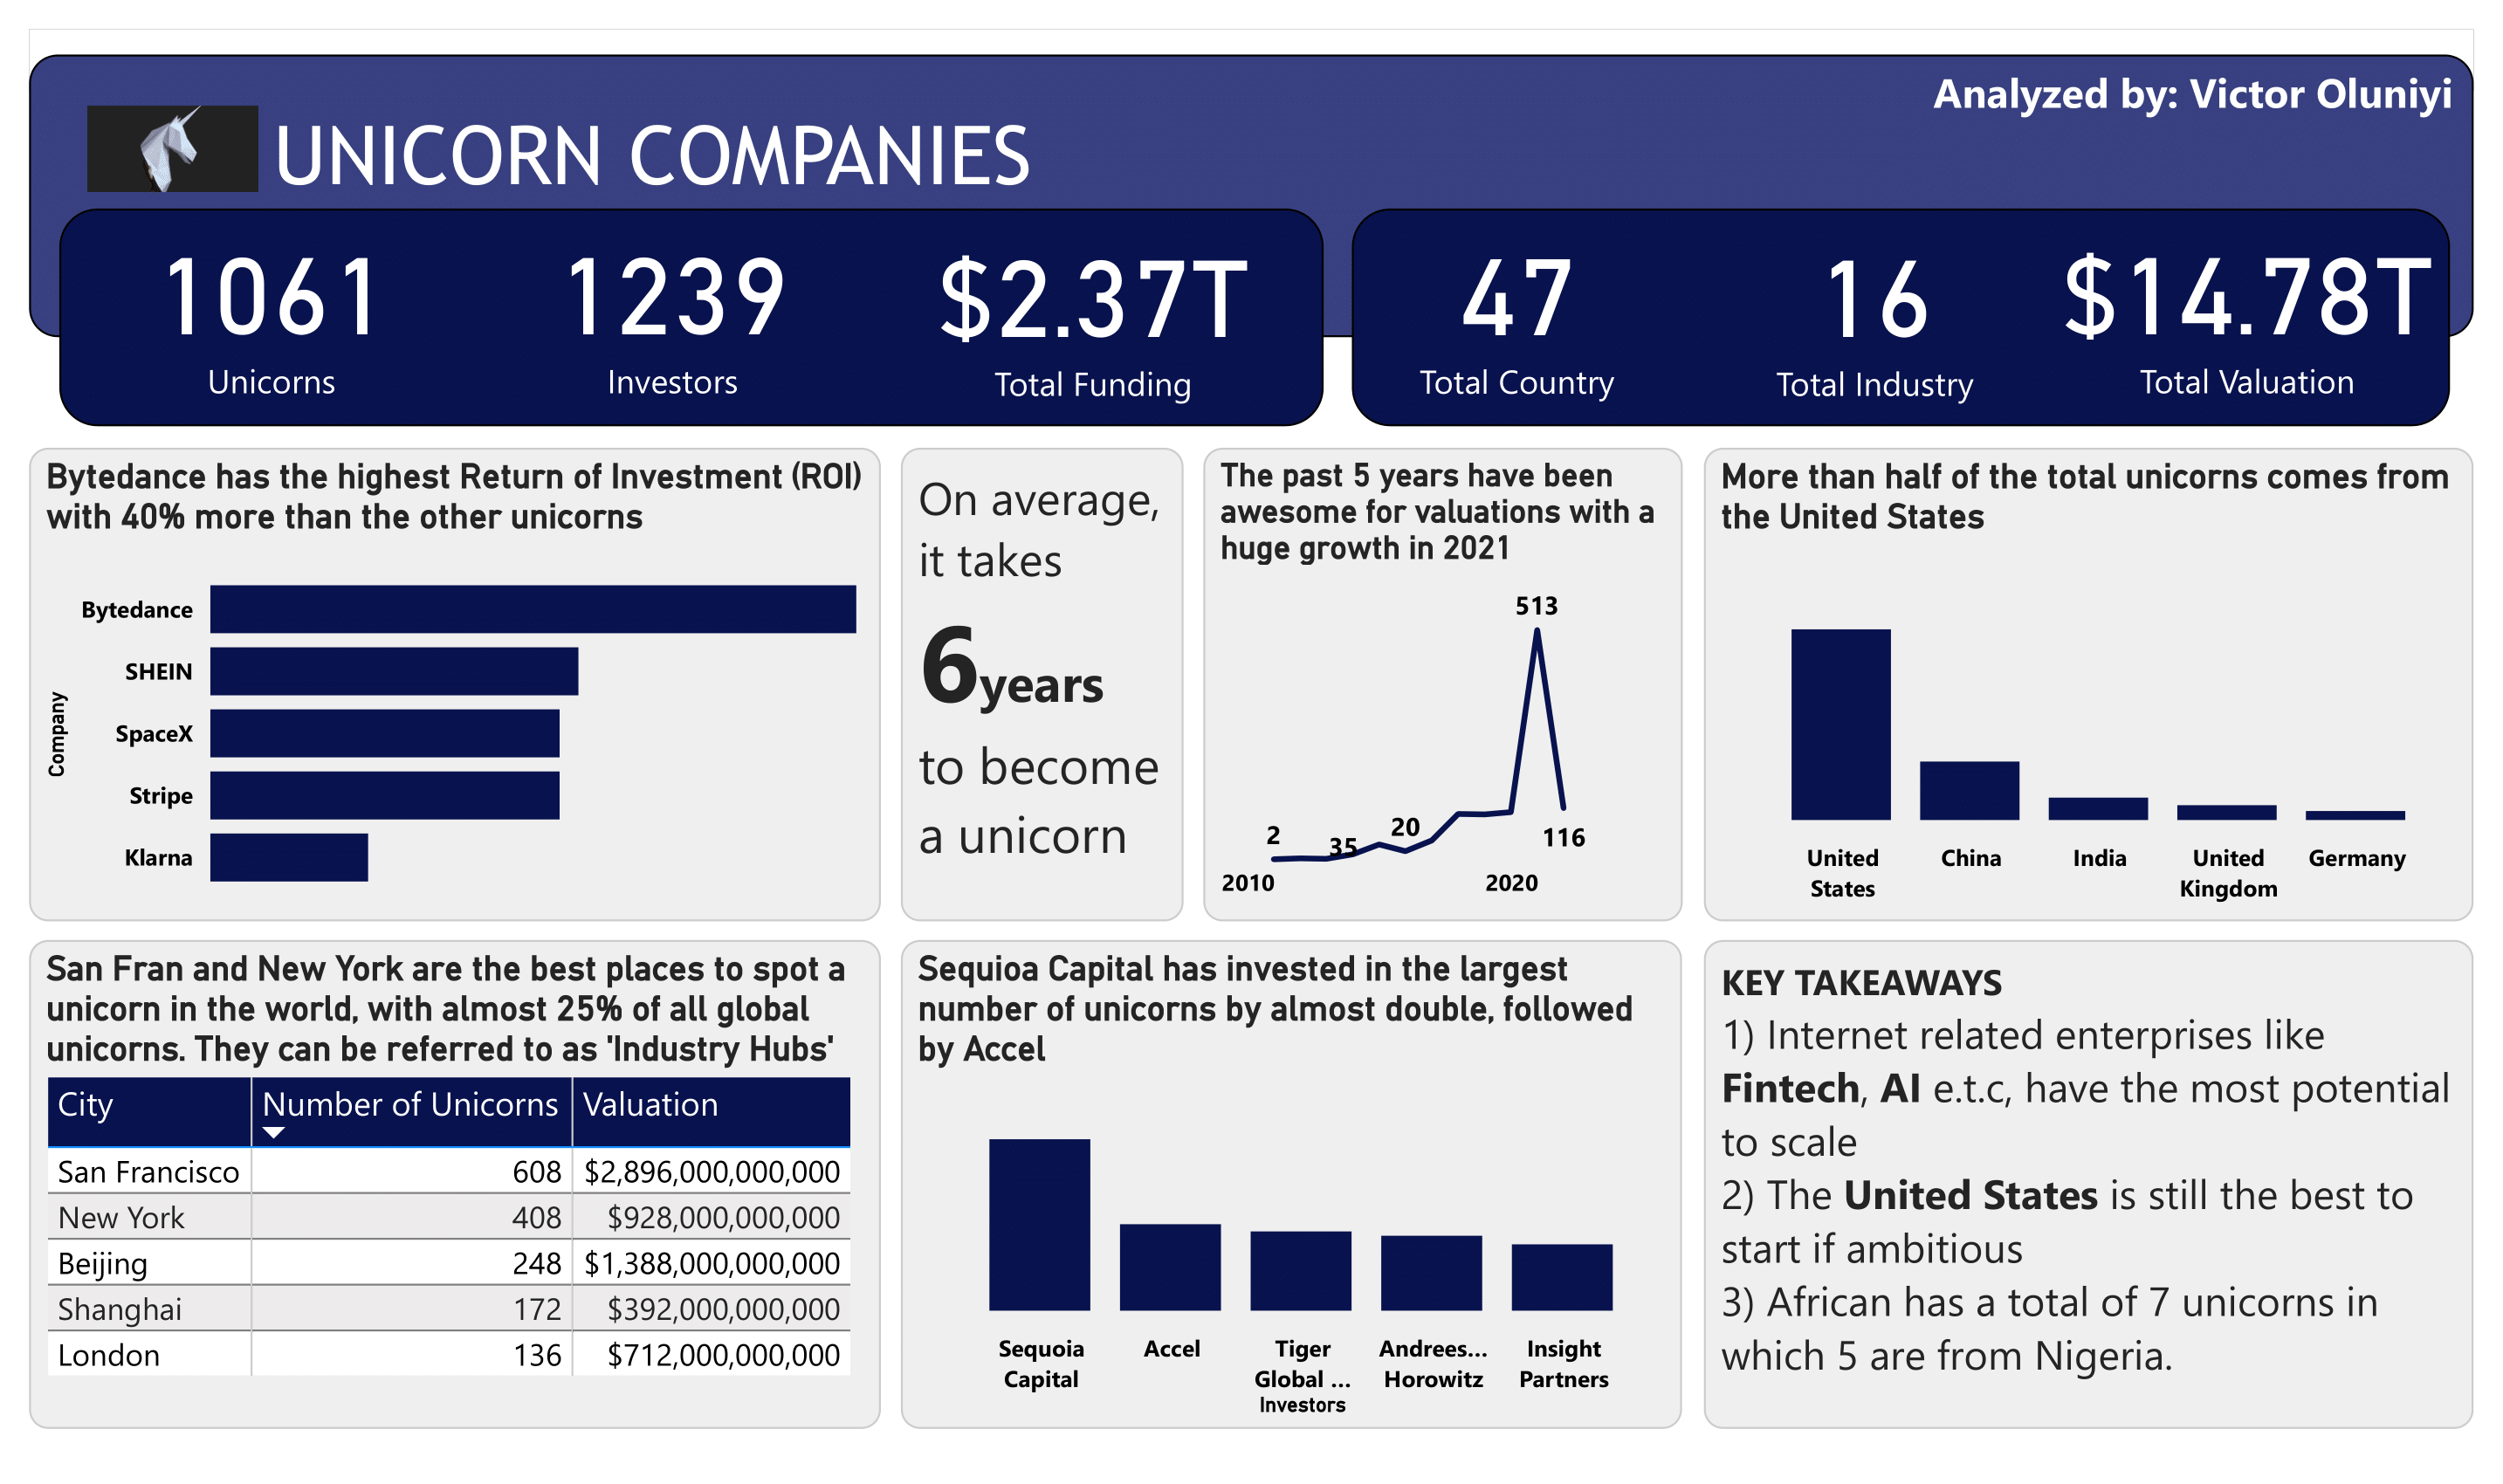
- More than half of the unicorns come from United States. The United States is the best to start if ambitious
 2. BYTEDANCE has the highest return on investment (ROI) with 40% more than the other unicorns followed by SHEIN company.
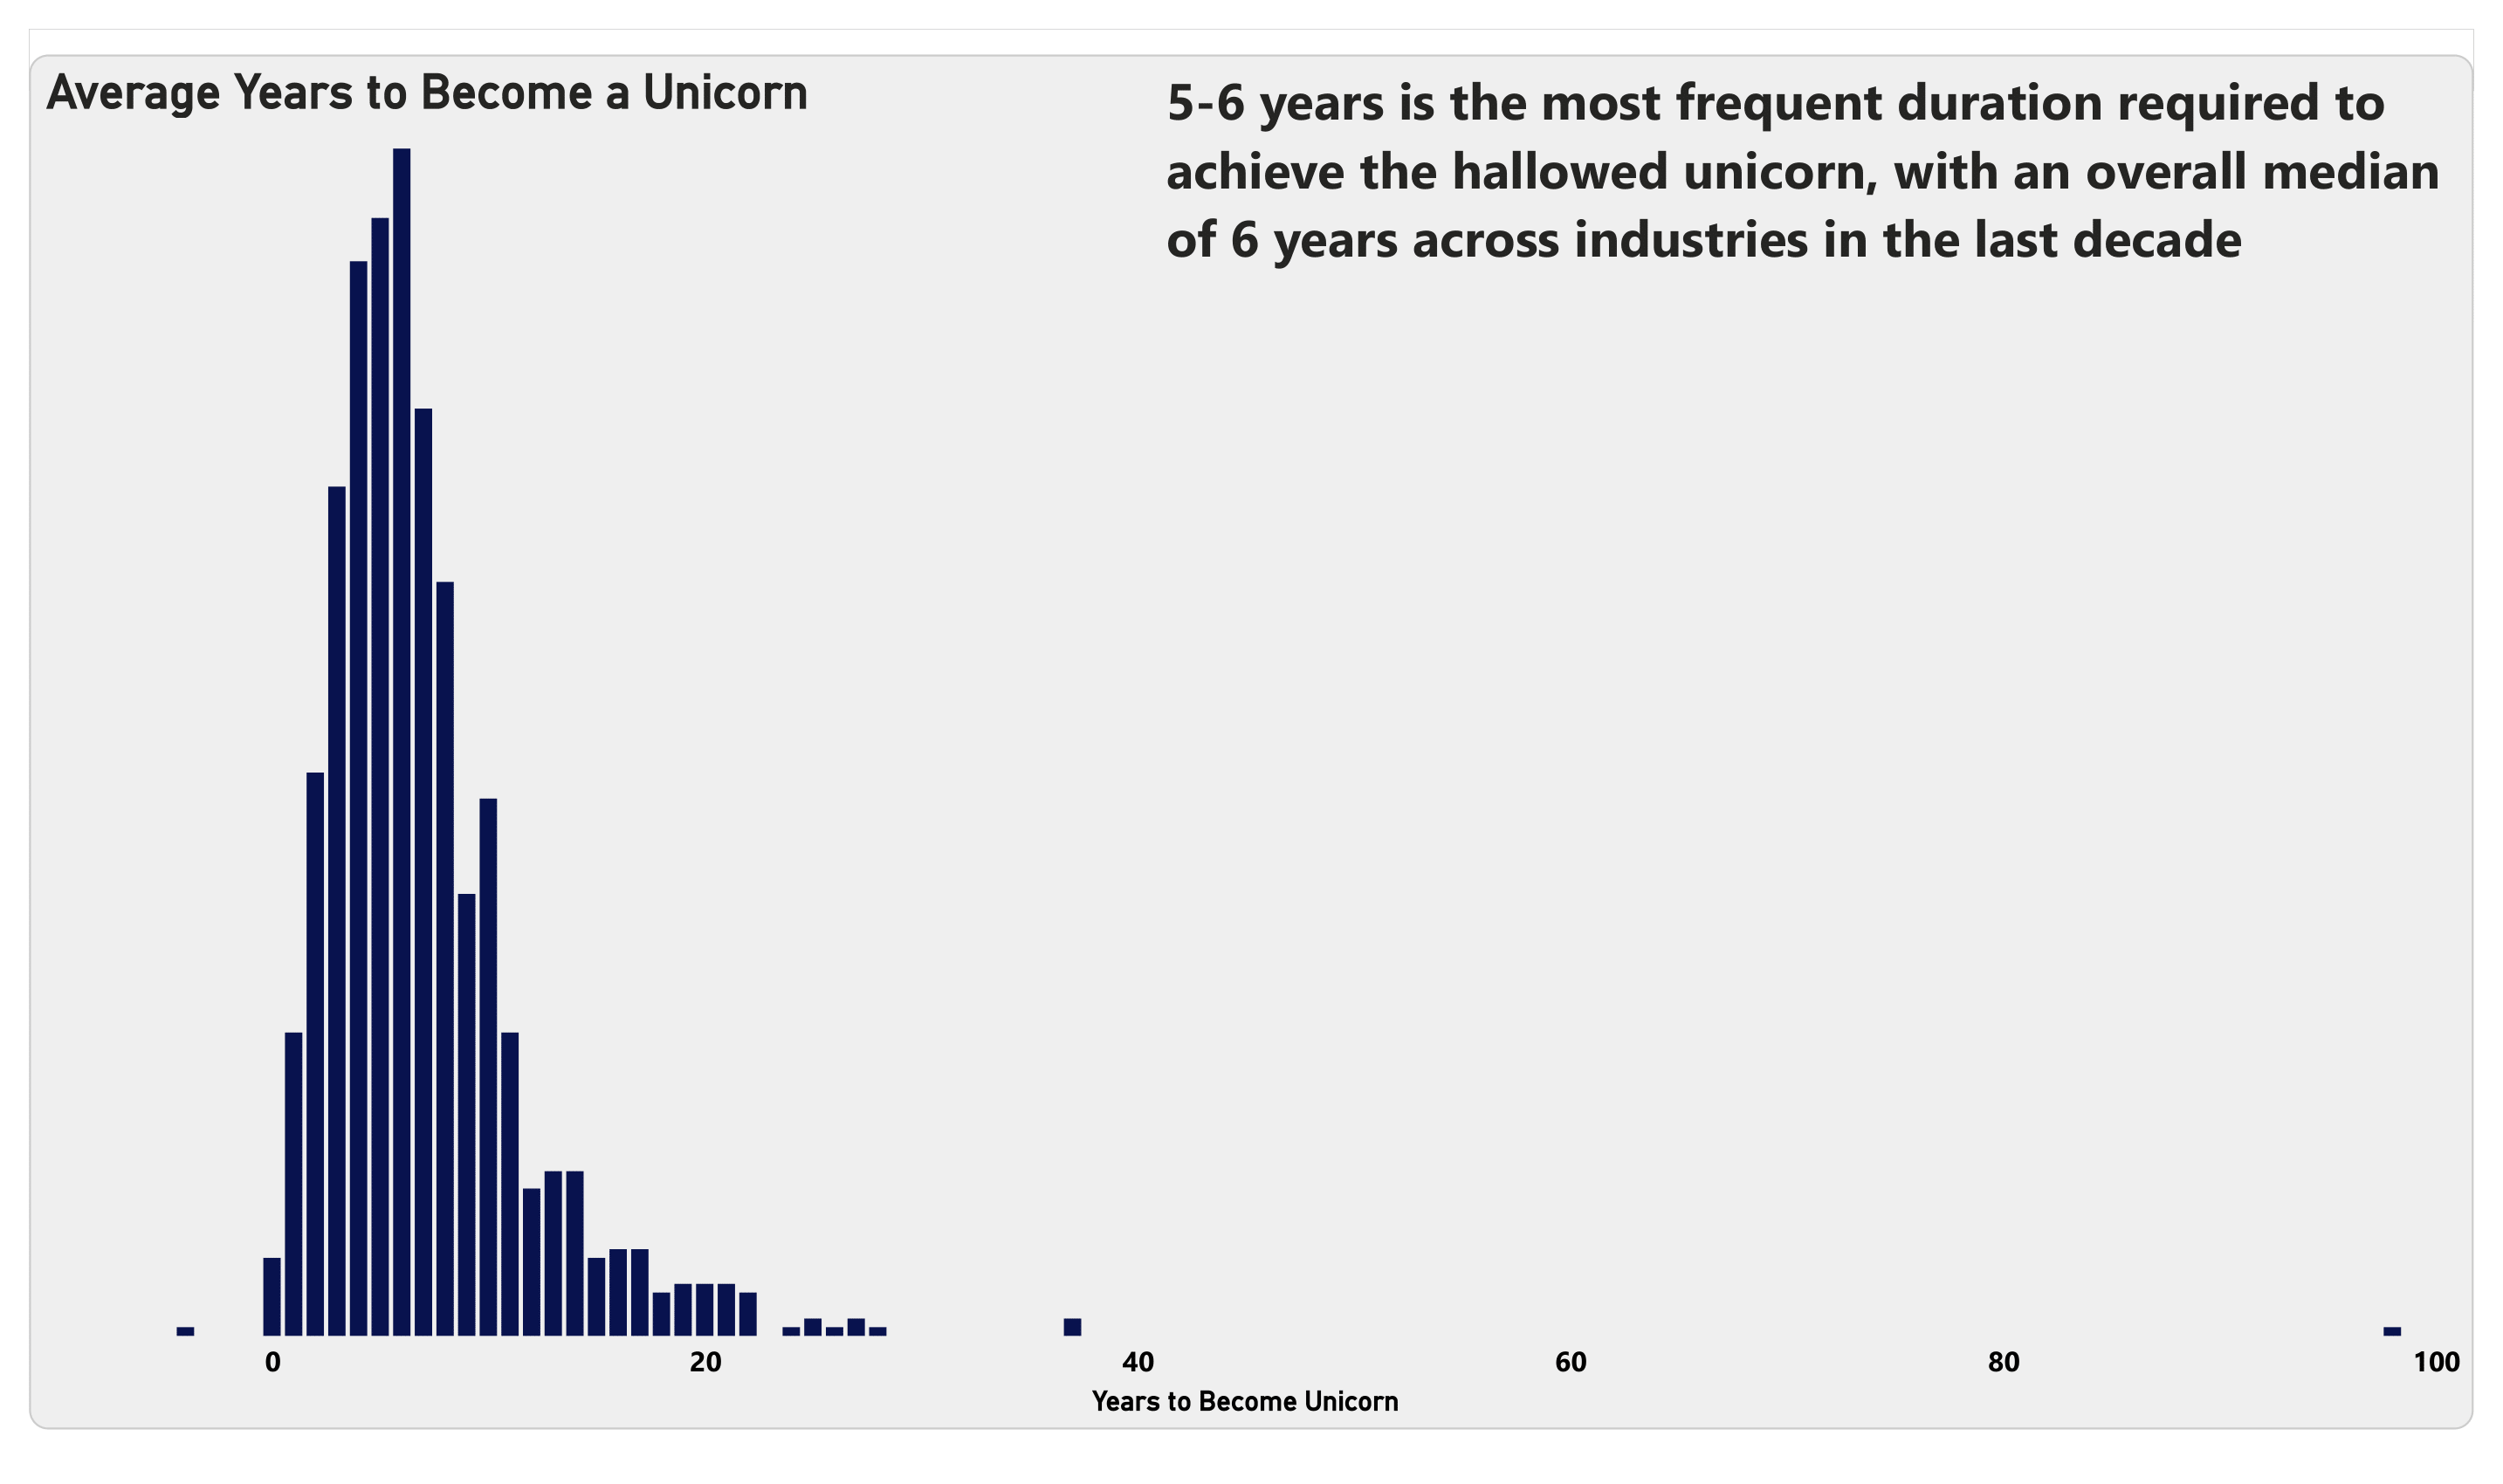
 4. 5-6 years is the most frequent duration required to achieve the hallowed unicorn, with an overall meedian of 6 years across industries in the last decade.
 6. Internet related industries like Fintech, AI e.t.c, have the most potential to scale
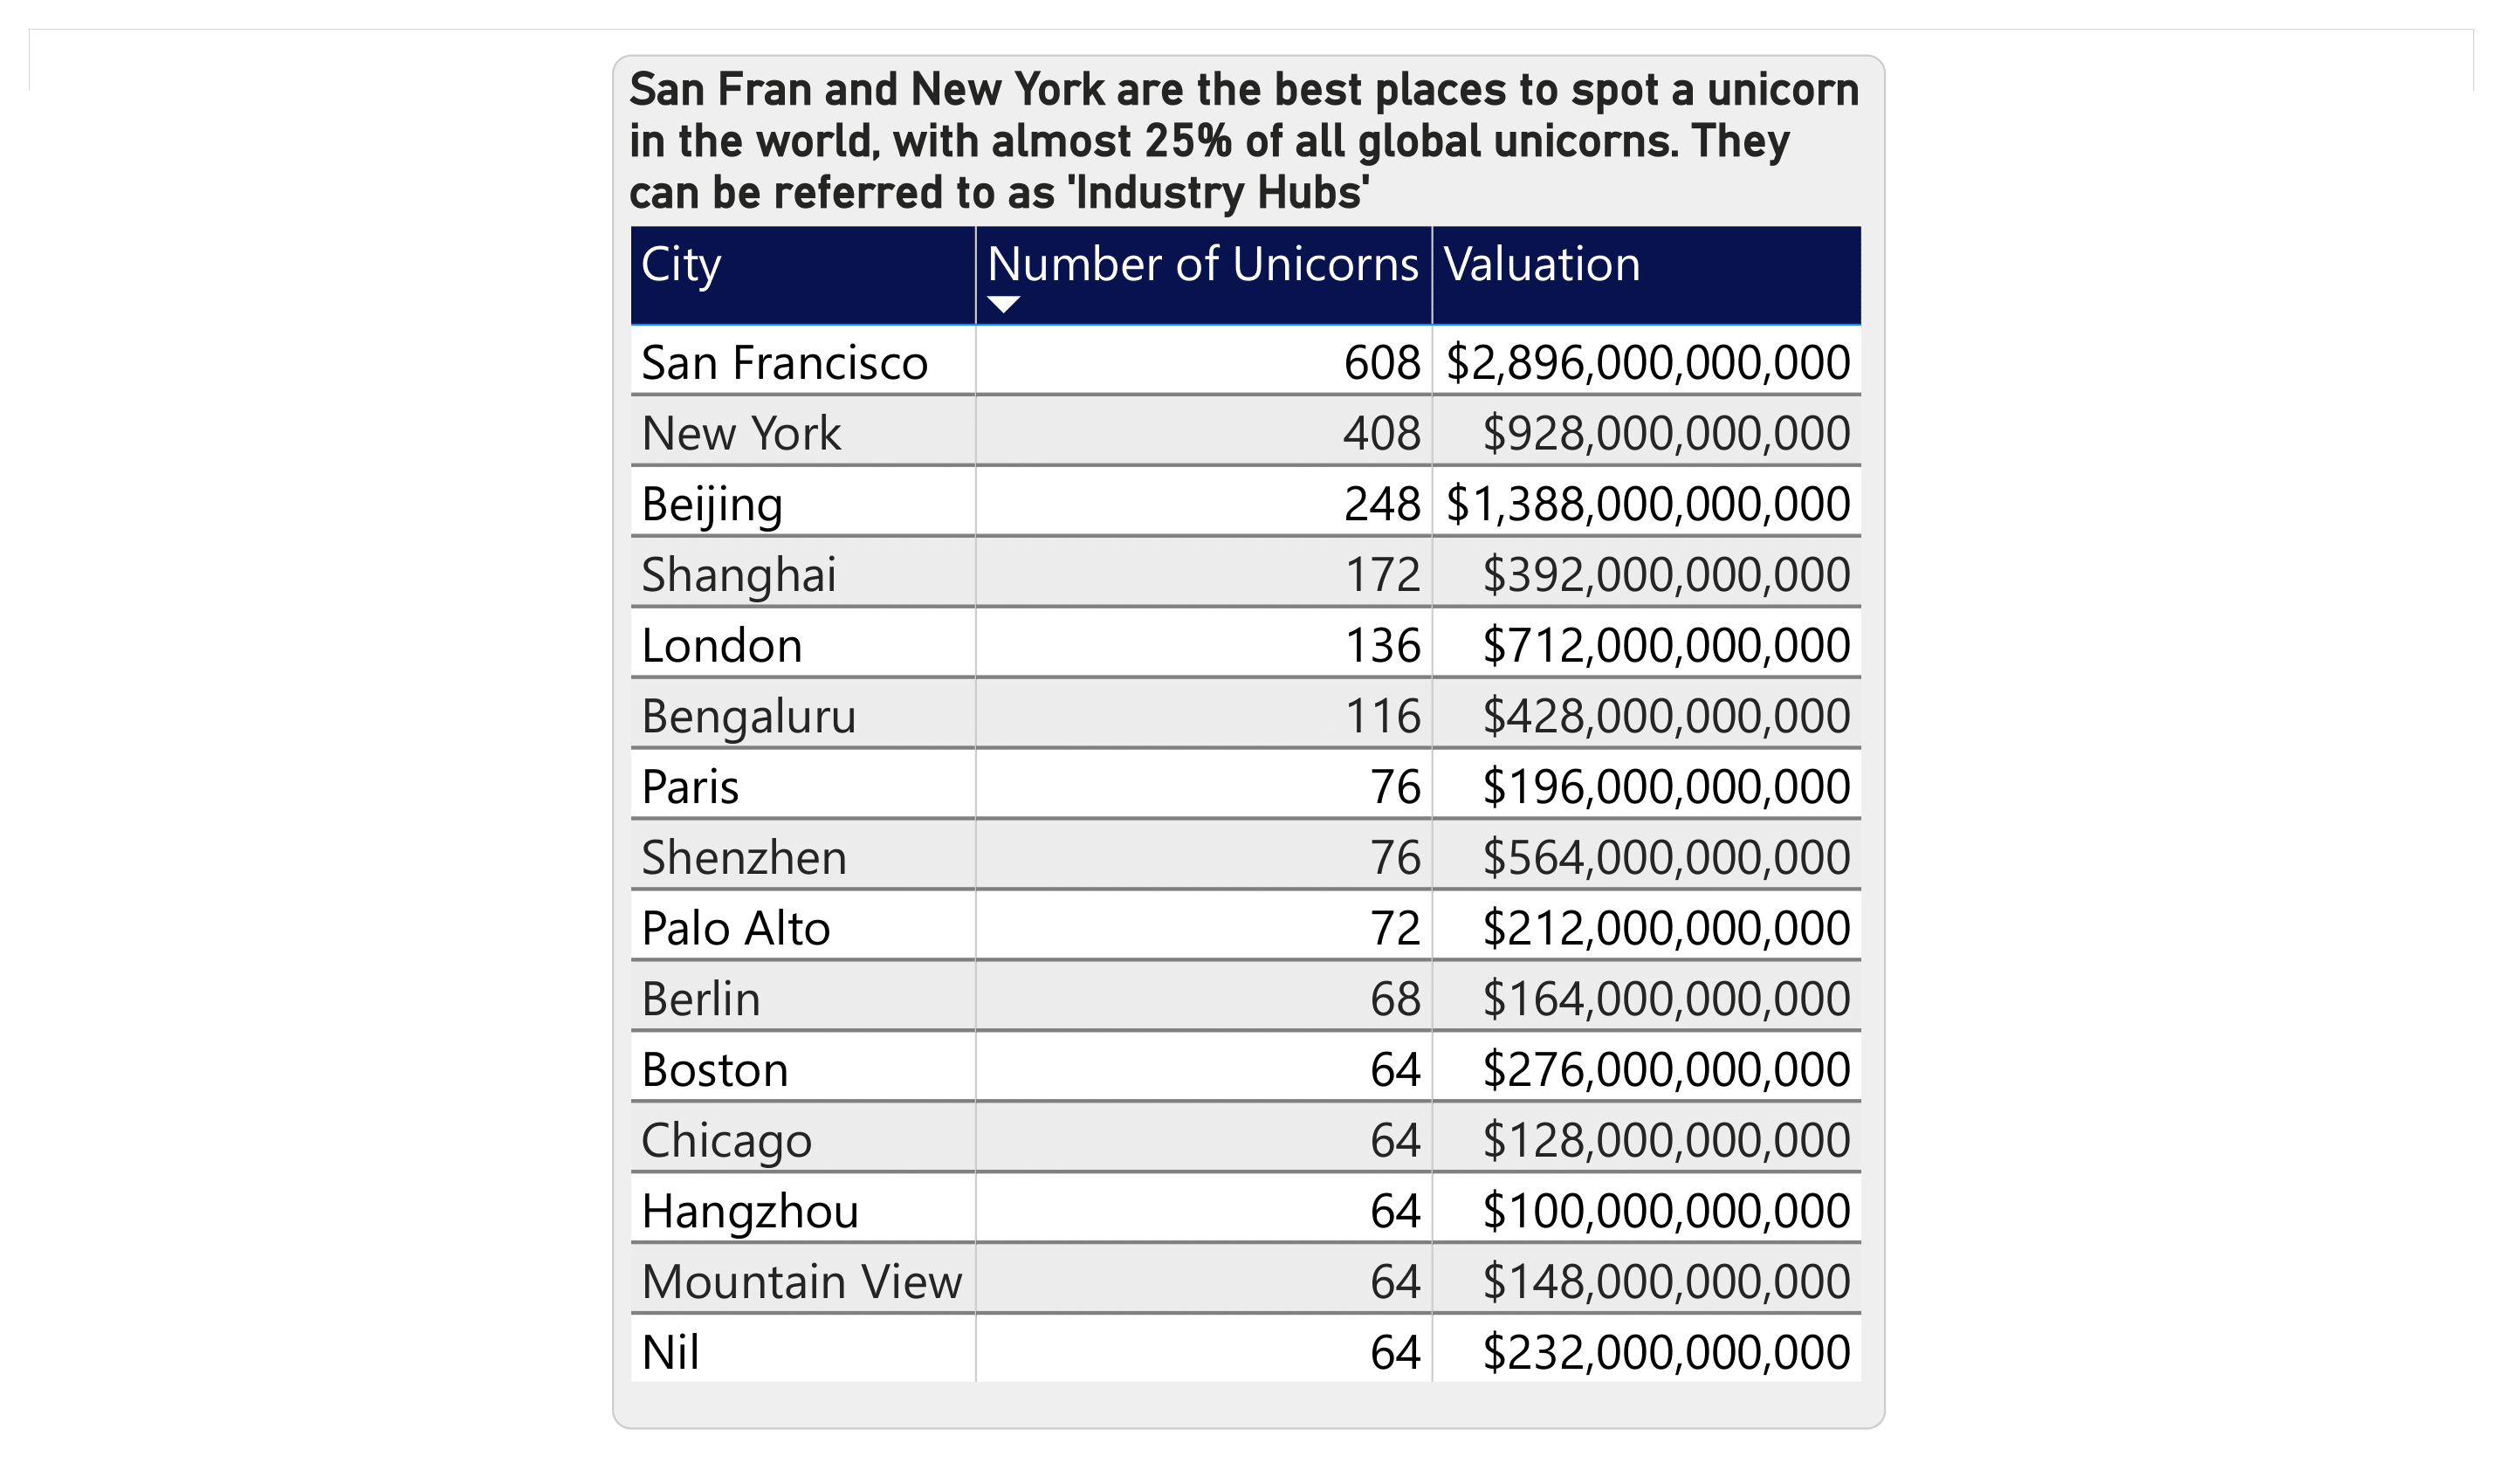
 8. San Francisco and New York are gthe best places to spot a unicorn in the world, with almost 25%of all the global unicorns. They can be regarded to as Industry Hubs
 10. The Past 5 years have been awesome for valuations with a huge growth in 2021
