DIGH 3814 static website
This page should be thought of as a navigator for my progress in the course.
For weeks 1 and 2, my journal and notes are in the same file -- I didn't really know what I was doing.
- Week 1 doesn't have a tree view since it wasn't checked-into a folder
- Full Journal
-
In an example of offering a more inclusive account of digital history, the only mention of digital work done by a woman, was of Kathryn Kish Scalar, who with Thomas Dublin developed Women in Social Movements in the United States, 1775-2000
-
The history of digital history paints a picture of a field that is "devoid" of women
-
When it comes to understanding why women are hidden in accounts of digital history -- similar to any other form of social injustice -- it is important to question the environment under which such accounts had been written as a way of uncovering the systems and conditions that enabled them
-
Women tend to be cited less, in general, and this contributes to the decreased visibility of women in the history of digital history
-
The driving force of this phenomenon is likely also what causes women to achieve senior status in history departments at slower rates than men
-
In history, women are employed in primarily non-tenured positions, and their eagerness to work leads to exploitation
-
-
It is important to look at the contributors to a work of digital history as well as the principal investigators. When we do, women's work on digital history projects can be uncovered
-
Teams should strive to document every facet of their work and particularly it's scholarly implications
- This will help work "get recognized in the organs that perform the authorizing work for the field."
-
Part of the reason Wikipedia didn't last is because of its "anarchic editing process and uneven reliability have repelled academics"
- Wikipedia is probably the most democratic resource on the internet
-
Disruption != democratization. A premise that many modern technological pioneers have overlooked, with prime example being Facebook's Mark Zuckerburg.
-
University press' maintain their position as the standard of academic publishing
-
In universities, academics are salaried and as a result, their work is measured not based on profit but on an "internal economy driven by readership and impact"
-
However, the majority of scholars don't receive proper compensation for their work
- "In their pursuit of new projects and new grants, for instance, scholars have long been content to dump information online and call it “democracy.”"
-
-
American Yawp - A very interesting use of open-publishing by Standford
-
Was struck by a particular citation "Bethany Nowviskie—“What Do Girls Dig?”" . Went down a rabbit hole comparing the usage of "girl" as a reference to either a female child or a female young-adult, vs the usage of "boy" as a reference to a male child, and "guy" as both a reference to a male young-adult as well as a gender-neutral reference to a young-adult.
-
Makes you think, where did the word "guy" come from and why had it become so interchangable?
-
Also, why has it become a disfavoured term?
-
Food for thought. I will say that as a guy, I can't help but understand how the word "guys" reflects a society that is so male-focused. However, I also understand that language is flexible; it is communication. So, from all of what I know -- which isn't that much, I'll say: use it or don't use it, what matters is whom you're talking to.
-
A method of computational linguistics that aims to create clusters of words that often appear together in a text.
An old-english diary belonging to Martha Ballard who was a midwife. The diary covers entrie over 27 years!
A format used to describe the positioning of words on a page.
- I'm getting pretty good at Markdown! Such a useful and easy language.
I've usually only heard this term being used to describe converting video/audio to text but now I see it used to describe converting hand-written text into digital text.
-
Turns out, Zotero doesn't work if you open a PDF while you have hypothes.is enabled. The hypothesis extension switches the regular PDF file into a custom HTML page so that it can overlay the annotations bar. The page it generates lives in the hypothes.is extension file domain so zotero is unable to access it.
- How to fix: disable hypothes.is and open the PDF. Save it to zotero, then reenable hypothes.is

-
Annotations don't work when hypothes.is is enabled on a PDF file (wow so many bugs with hypothes.is). The url of the html page that is generated includes a random ID that identifes the extension in Chrome. The ID isn't global and so, you won't be able to see annotations on the page.
- Yet to figure out how to fix this
-
Using wget was buggy for me. I ran
wget http://activehistory.ca/papers/and got a debug log saying it had downloaded a file (or some files) but when I ranlsor looked in the file explorer, I saw nothing.-
I went to http://activehistory.ca/papers/ in my broser and saw that it was actually just a webpage
-
So I added
-OutFile website.htmland it worked! I could then view the page in my browser. (I knew it was html due to the<!DOCTYPE html>at the start of the file.)
-
One thing I noticed that I think poses a problem for archiving is that despite me downloading the webpage, my browser still had to fetch a lot of resources, for example the css file had to be fetched
Request URL: http://activehistory.ca/wp-content/themes/rubbersoul-pro/style.css?ver=2.6.4 Request Method: GET -
This loosley relates to an article I read recently on how Microsoft said they were wrong about open-source. In the past, the company had been famous for strongly opposing open-source (which might explain why wget is a little harder to user on my Windows laptop).
-
-
The second wget command didn't work because of a type error with
-w 1where Windows was expecting a WebRequestSession for some reason. So I put it up to Windows and it's lack of compatability with linux-ey commands and spun up git-bash (basically bash w/ git features). This time both wget commands worked! -
I couldn't get data to show up in
output.txtafter running my R script. Turns out the file just didn't show text when viewed in RStudio but if I viewed the file in Notepad, I could see the output.-
I tried reopening the file but that didn't do anything
-
I added a print line to the script and things were printing just fine
-
This is a bug I'm yet to understand but I'll keep researching and will probably fallback to the Discord community if I can't figure it out
-


-
I didn't really get much from this piece. Much of what was talked about wasn't too different from what I already knew. As a Computer Science major, topics like machine learning and statistics are talked about relatively freqeuently.
-
What I did like though, was the process by which the author sought out data. It seemed that they were focused on retrieving trends concerning some specific topics, rather than attempting to obtain the general themes of MARTHA BALLARD’S DIARY.
-
I can't help but see this as a manifestation of key differences between human analysis and general computational analysis. Where a human would attempt to use heuristics to analyse the semantics of a piece of text, a computer would simply oberveve it's syntax and look for patterns.
-
I feel like, in machine learning, this is a slow way to understand things but I also beleive it might be a more robust method because once several processes are complete, you'll have a wealth of knowledge to draw upon.
-
It was good to see this at work, when the author stated that "one would think the household responsibilities for an aging grandmother with a large family would decrease over time", it really examplified how an algorithm may actually see things clearer than we do.
-
-
It's pretty cool but also weird to see what written English looked like in the 18th and early 19th centuries.
-
I don't understand the point of this article. And that is not to say that it is stupid, I just feel that the author is arguing something distinct from what the title implies.
-
To me it seems that the author is focused on highlighting that many uses of the term
dataare incorrectly using it. IT seems that the author is simply trying to remind us that 'data' (or as they claim in this case is actually,capta) has qualitative attributes to it, it has meaning that is hidden behind the item itself.-
To this I say that the piece is weak. I don't disagree with the author's statement about data as capta but I see data as instrinsicly having qualitative attributes to it. Our mind works by forming and using associations, hence, it is impossible for us to think about something in a purely quantitative way.
-
Perhaps I missed something in the article -- to be honest I didn't read the whole thing, it was very long.
-
-
Excited to see that the cloud is as pervasive as I imagined it to be
-
The 'cloud' provides so much value as utility to pretty much every kind of professional and seeing it used by the National Library of Scotland really makes me want to utilise it more.
-
Minecraft hehe
‘Making such bargain’:TranscribeBenthamand the quality andcost-effectiveness of crowdsourcedtranscription
-
Transcription seems like such a trivial task at first but then you realise us humans mess up on reading handwriting all the time, so how would a computer, the staple method for perfoming well-defined repetative tasks, be able to understand something as unpredictable as handwriting.
-
I appreciate the strides we've taken with Machine Learning more now. Look at those volunteers who transcribed over 1.6 million words in a year and 3 quaters, what if we could make the task more straghtforward? What if we could define a small set of rules a network could follow, what would those rules be?
- Maybe I should master in neural networks. This course is really revealing my true interests in technology. Thanks Dr. Graham!
- Git Tree View
- [Full Journal](https://github.com/DeveloperRic/HIST-3814-O-S2020/blob/master/week3/README.m(
- Notes
What on earth does this mean? I saw this term used describe both "soft" and "hard" digital history. Initially, I assumed the hH represented the softness of "soft" digital history but after seeing it immediately used to describe "hard" history, now, I'm not so sure. I searched in Google for: "[hH]istory", "\[hH\]istory", and "soft" Digital "[hH]istory" and got nothing.
I had previously know about regular expressions and had even used it sometimes. But it never occured to me the use of numbering groups. Seeing the example you provided with (dogs)( and )(cats) as \1\2\3, I realised wait, you can really do a whole lot with regex. For example, fixing syntactical mistakes in huge files (I bet Grammarly does this at least to some extent).
I just figured out you can use tables in markdown! What can this language not do? You just draw a table with |s [pipes] and -s [hyphens]!
| No way... | Is this... |
|---|---|
| a table! |
(They probably use regex groups for this too.)
The process of converting a bimodal network (or as I know it, a bipartite network) into a unimodal network.

Anaconda PowerShell again refused to cooperate. The terminal showed that it performed and completed the web request and created the file for writing but nothing showed up in the file -- curl didn't actually write anything! I executed the command again, this time in Git Bash and curl worked flawlessley! I might have to forgo Anaconda PowerShell for this class.
Turns out, writing out huge blocks of text is harder than I thought. I'm yet to figure this out, doesn't help that I get a "Ran out of stack space trying to match the regular expression" error.
While trying to use the ConnectTheDots tool, I kept receiving 'Internal Server Error's from the website. I tried modifying my correspondence file to exactly have source,target on the first line and only contain 2 columns but to no luck.

But... lucky for me Paladio worked!

For steps 16 and 17:
-
Going back to the Overview pane, you can visualize this centrality by changing the size of each correspondent’s node based on its PageRank. Do this in the “Ranking” tab on the left side of the Overview pane.
-
Make sure “Nodes” is selected, press the icon of a little red diamond, and select PageRank from the drop-down menu.
I couldn't find the "icon of a little red diamond" that was mentioned. I was behind on the weeks because of my work and didn't have time to discuss the problem on Discord. Eventually, I figured out that, on my installation (which was the latest one), the icon was actually a set of conccentric black circles titled 'size'.
- The author mentions how he had an "instinct" to remove 'stationers' from his data so that he could observe patterns. Perhaps this shows that too much data can be just as unhelpful as too little data -- maybe even more.
-
Similar to my reflection from the 'soft' history text, this reading again highlights the importance of presenting concise, selective data in visualisations.
-
The author really recommends using Networks to quantitatively analyse literature or 'corpus'
-
There is a resounding notion of tailoring digital history to the audience that will consume it. Which is an interesting thing to talk about because my knowledge of digital history is keeping records of and/or analysing the details of the past.
- Perhaps, by trying to avoid having too much data, digital historians tend to use audience perspective as heuristics for deciding what to focus on and what to ignore.
- I feel like I'd seen the concept of unimodal networks in a Shopify overview of machine learning.
I noticed this word in the instructions for R and realised that I had seen it before but I didn't really know what it meant. For my own reference, corpus is a language resource consisting of a large and structured set of texts.
This definitely is a gateway drug. I don't fully understand it yet but so far, in my interactions with it, it seems like a very powerful and useful tool.
Building my own corpus and visualising it was quite the fun experience. Defintiely, using regex to parse the newspapers was no fun! But I was really happy with my results.

For some reason, AntConc served a very refreshing look with its UI (even though it was pretty blurry). I guess it was just nice to see an interface that actually does what it needs to do properly
Anyway, working with AntConc was insightful. Despite the fact that I had to suffer through 100% CPU usage (I know!). When I searched for the, I didn't really understand what I was looking at but the tutorial suggested searching for wom?n and m?n and I noticed the usefulness of sorting. To avoid articles I sorted further away from the noun and I got richer data.
When working with the collocate tool, the author expected to see 'beautiful' or 'pregnant' or 'sophisticated' as collocates for wom[ae]n but it was very different for me (possibly because of different data), I got 'old', 'poor' and 'young' as the top 3 non-article collocates. For men, it was 'young', 'poor' and 'good'.
Probably properly spelt 'digital simulacra'. Based on my quick search, it's a digital representation or imitation of a person or thing.
a short form of this is also in my notes
Voyant failed to load the content from the url that was provided to us (https://craftingdh.netlify.app/data/cnd.xlsx).
I searched up the problem in Discord and someone else had the same problem as me. I tried the solution that worked for them -- using https://voyant-tools.org/?corpus=1b1176715ac6efbcc762f127d7ff37d2 instead of the provided url. That link didn't work either, so I tried another solution (uploading the Excel sheet, not depending on Voyant to download the file), and that worked! Thank God for community forums! Definitely a good idea Dr. Graham, especially since I like working through things myself, unlike a classroom or email, we can all just collaborate without the stress. I'll definitely be posting more!
I was really struggling to use AntConc, and also TopicModelTool because anaconda decided to take a whopping 10+ GBs of space on my computer. I had no choice but to uninstall as many anaconda tools as I could. The tools I uninstalled were:
- CMD.exe prompt
- JupyterLab
- Jupyter Notebook
- Powershell prompt
-
Missing
tmpackage.- installed the package 😁
-
LDA function not found
- installed
topicmodelspackage 😉
- installed
-
Hidsight 20/20.
-
I think this is a very good way of illustrating how we like to inject meaning to things that don't have any, or that mean something completely different
-
I also think this literary experiment is in fact actually touching on confirmation bias
-
When you have such a complex world, I assume it would be very easy to real history with perceived history (I just invented that)
- Perhaps because our mental models are formed largely based on our own experiences, it is difficult to conceptualise the reality of an historical event.
- Git Tree View
- [Full Journal](https://github.com/DeveloperRic/HIST-3814-O-S2020/blob/master/week5/README.m(
- Notes
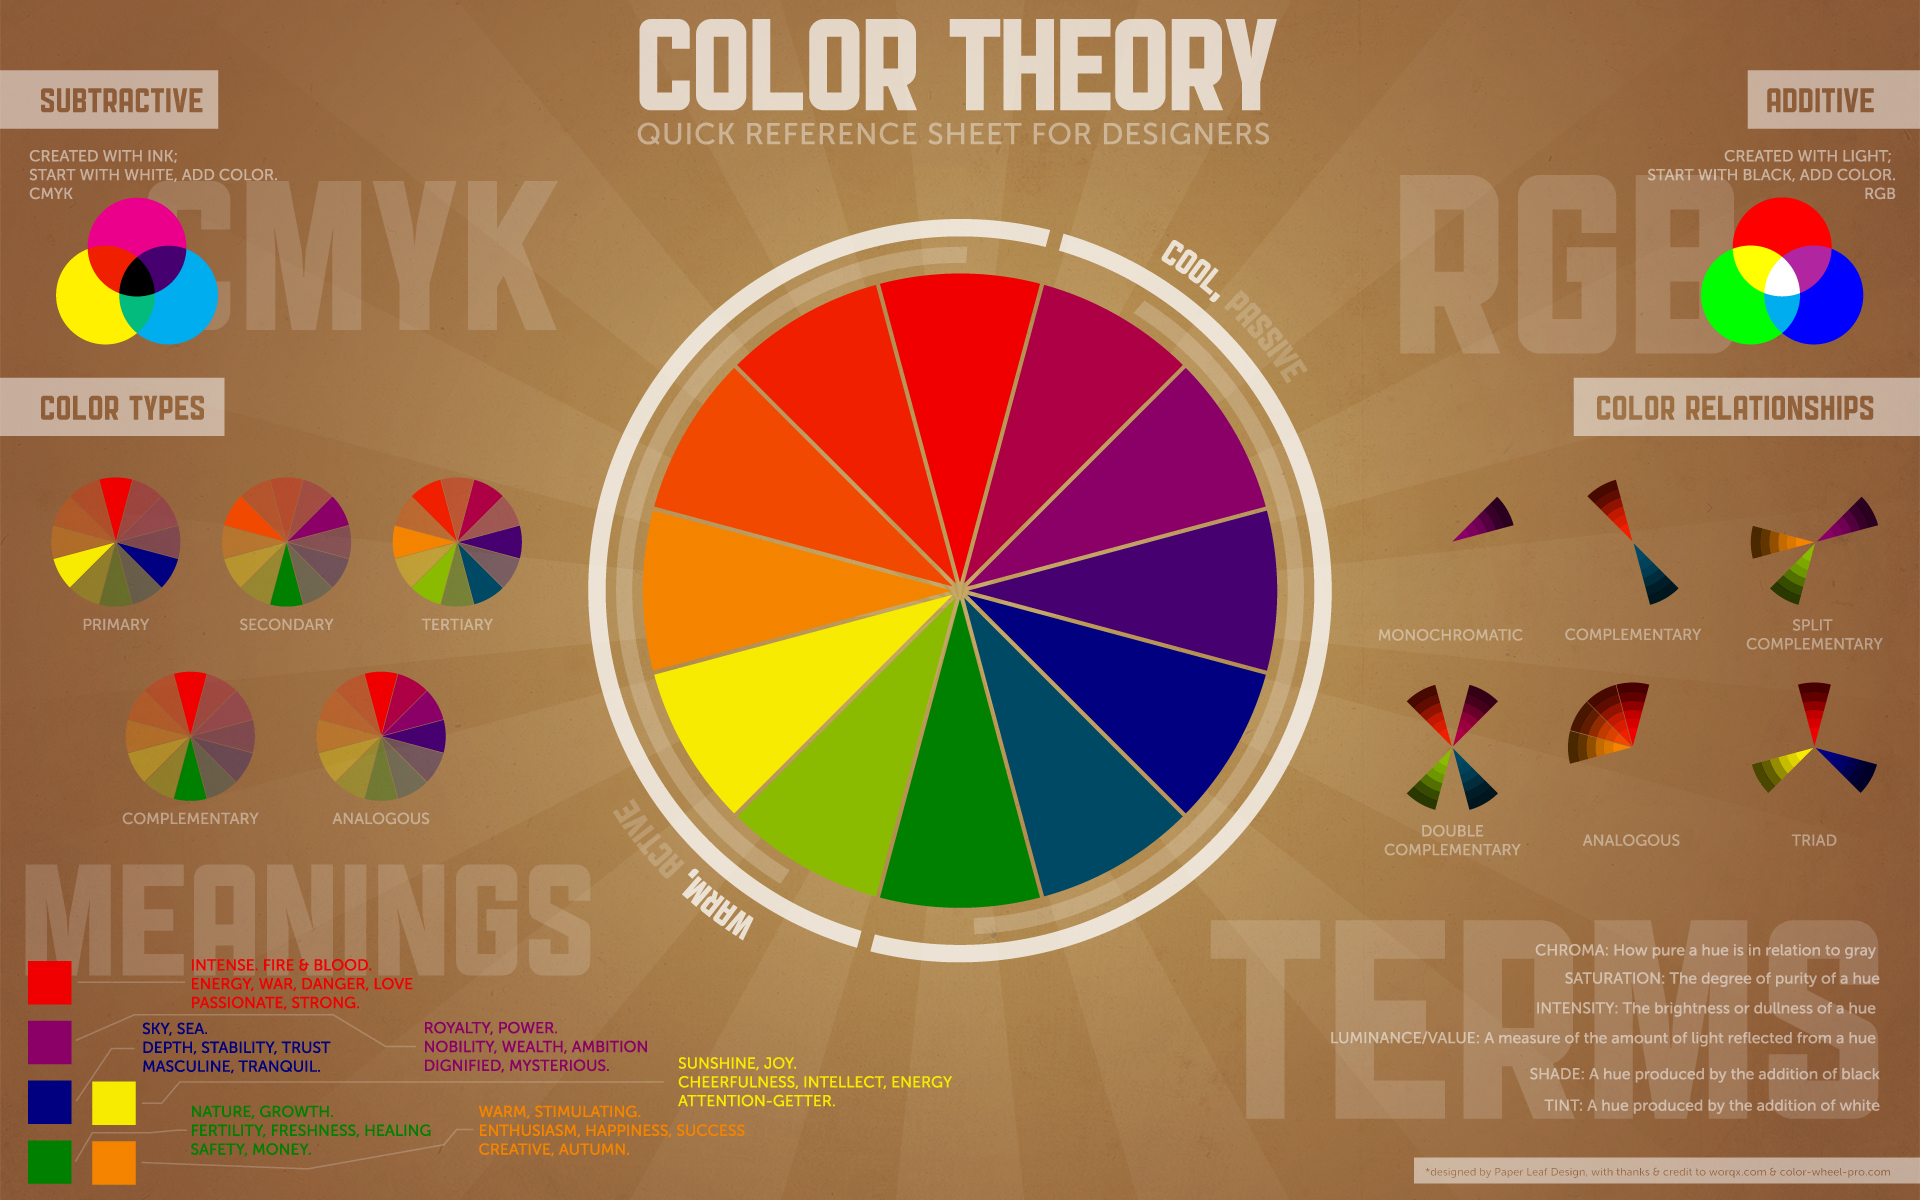
In the past, I never knew what CMYK stood for in the real of colours (and frankly, I didn't care enough to check). But I think the chart you included was really informative, I'll defintely be refering to it when next I pick a colour scheme.
For reference: ColorBrewer
A font whose design is primarily based on geometry. The hidden shapes in the type create a structured effect.
When I ran the command the server said it was running but I was unable to view the page.

So I checked Discord and... apparently I'm supposed to use http://localhost:8000/ instead of http://0.0.0.0:8000/. Another case the Discord group rescued!
This is more of a rant than anything. If I'm to be completely honest this week's work was really stressful. I had my computer run out of disk space twice. Working with Inkscape slowed my computer down so much that I could only type 1 character each second and this was compounded ontop of my laptop potentially having a virus. The challenges I faced this week I think are pretty evident in my work but hopefully I can bring things back up next week (edit: I think I did 😁).
Making Nerdstep Music as Archaeological Enchantment, or, How do you Connect with People Who Lived 3000 Years Ago?
-
I really liked when the author mentioned that if a song -- composed based on the posessions of those who lived in the plateau, in the tufa landscape of southern Etruria -- were to be performed in a club, the dancers would effectively be embodying our archaeological knowledge of Poggio in their movements.
-
Makes you think, what are the roots of our mainstream, popular music today?
-
The instruments that we use -- the piano, violin, flute, drums, etc. -- were invented many, many years ago. What were they used for back then?
-
I can't help but feel that the same energy of the composers who first invented these instruments has left a lasting impact on our music now by virtue of the instrument itself.
-
-
This is honestly one of the most well-presented DH websites I've seen.
-
I really like her "On the Water" sonification. The combination of the 3 boats 'sounds' really made for a more cohesive track. To be honest, I was a little skeptical when I listend to "song of the Ottawa" but when I read that the tracks were actually composed by muxing several monotonic tracks, it made so much sense!
I made a list of all the new visualisations I discovered through the text so that I can refer back later
-
(sideways) Stacked Bar Chart: Great for showing qualitative<->quantitative data without clutter
-
Choropleth: Bounded regions on a map are coloured/shaded to represent a statistical variable
-
Dot Density Map: Provides increased granularity over the Choropleth
-
Proportional Symbol Map: For representing absolute values on maps. Doesn't lend much for detailed interpretation.
-
Isopleth/Isarithmic/Contour Maps: Represent gradual geographic change. Best for data that contains smooth transitions.
-
Cartograms: Distort the known reference system of latitude and longitude to represent a statistical value
-
Vertical/Horizontal Trees: Best for showing relationships in hierarchical data. Emphasises change over time.
-
Radial Tree: Visalises a set of highly-relational data. Emphasises centrality instead of time.
-
Treemap: Hierarchies that represent a quantitative value. Rectangles can be coloured to represent different dimensions of data -- categorical or quantitative.
-
Small Multiples: Use of multiple, small, adjacent visualisations for the purpose of comparison
-
Sparklines: Tiny line charts with no axis or legend used to show change of a single item
- Git Tree View
- [Full Journal](https://github.com/DeveloperRic/HIST-3814-O-S2020/blob/master/week6/README.m(
- Notes
It seems like Virgina Woolf was a very passionate Englishwoman. By investivating the conexts in which Woolf used the word 'England' and reading the surrounding diary entries, I could see that Woolf felt very invovled in the growth of England, so much so that she felt it was important for her to celebrate the voices of those who built the nation. Specifically, in a diary entry where Woolf described feeling sentimental, she mentions that she want's to "gather material for the Lives of the Obscure" -- a book written to recount the history of England through 'obscure' lives.
contexts of 'England':
<iframe style='width: 638px; height: 183px;' src='https://voyant-tools.org/tool/Contexts/?query=england*&context=10&corpus=26eb9c0774002fa1ad8725fabf31ae6d'></iframe>Taking a hint from this exercise in week 4, I searched for the trend graph of 'wom*' and 'men*|man to see how Virginia Woolf's use of both words changed over time, and what came up was quite interesting. At 5 document segments, Woolf mentioned men significantly more than she did women and at 1 document segment she did the same but for women. This didn't mean much to me but I used that information as a heuristic for what to look for when topic modelling and using Antconc.
By running the TopicModeling tool, I discovered 7 general themes of Virginia Woolf's diary, which I named:
- expressing emotions about country/location
- life & economics
- writing
- home, colour & femininity
- movement & masculinity
- darkness, work & creativity
- clothing & joy
The fact that 'writing' surfaced up as a topic proved my assumption that Woolf was a lover of books, particularly those about patriotism and class. It seems like a lot of what Woolf wrote in her diary expressed her highly emotive perspective on life which perhaps, was needed in the "Roaring Twenties", the age right after the first world war.
I plan to use the diary entries that heavily featured topics 1 and 3 as a possible measure for sonification.
I tried to really utilise my coding expertise as a Computer Science major in this weeks work. Hence, I made a Python script (prepare_to_sonify.py) to parse the output of the TopicModeling tool into a single tsv that I can use for sonification.
After listening to the track, I could see that Virginia Woolf wrote a lot about clothing & joy in the earlier entires of her diary but not so much in the later ones. Woolf also seems to write a whole lot about writing, itself. Perhaps writing in her diary was more than just record keeping for her, it may have been an beloved hobby. However, when it comes to the instruments of the other topics, their notes are fleeting but consistent and loud. It could be possible that those other topics weren't discussed as frequently but more heavily than clothing & joy and writing.
As I was about to begin work on developing my corpus of work for this week. I encountered a paywall barring me from being able to access the data relating to the "understanding of literature, focusing particularly on the part women have played in its development".
With me already being behind schedule this issue threw a real monkey wrench into the gears of my workflow.
In response, I pivoted -- whilst still focusing on the same theme of feminism -- to the diaraies of Viginia Woolf. Woolf is accreddited as the main source of inspiration for Orlando and as such I have chosen her diaries as the focus of my analysis. (Talk about turning an L into a W)
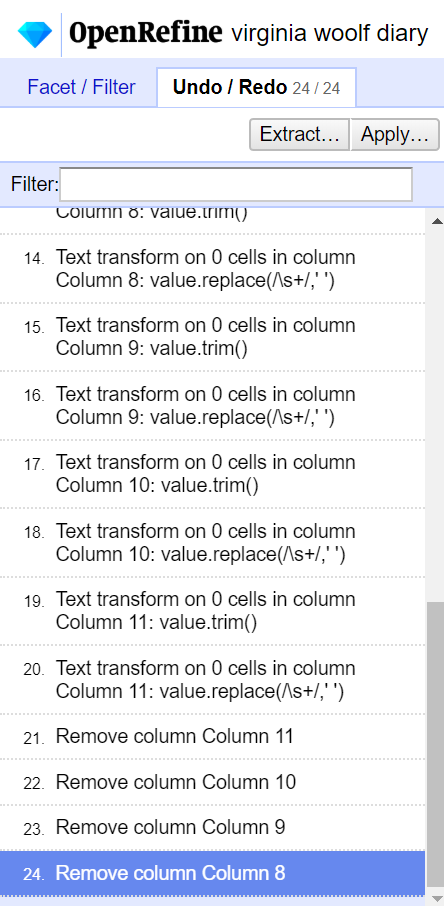
It was kind of funny trying to use OpenRefine for my data. Because each row was an entry and each entry was a diary log, the columns (exluding the date column) were all cluttered with arbitrary amounts of text.
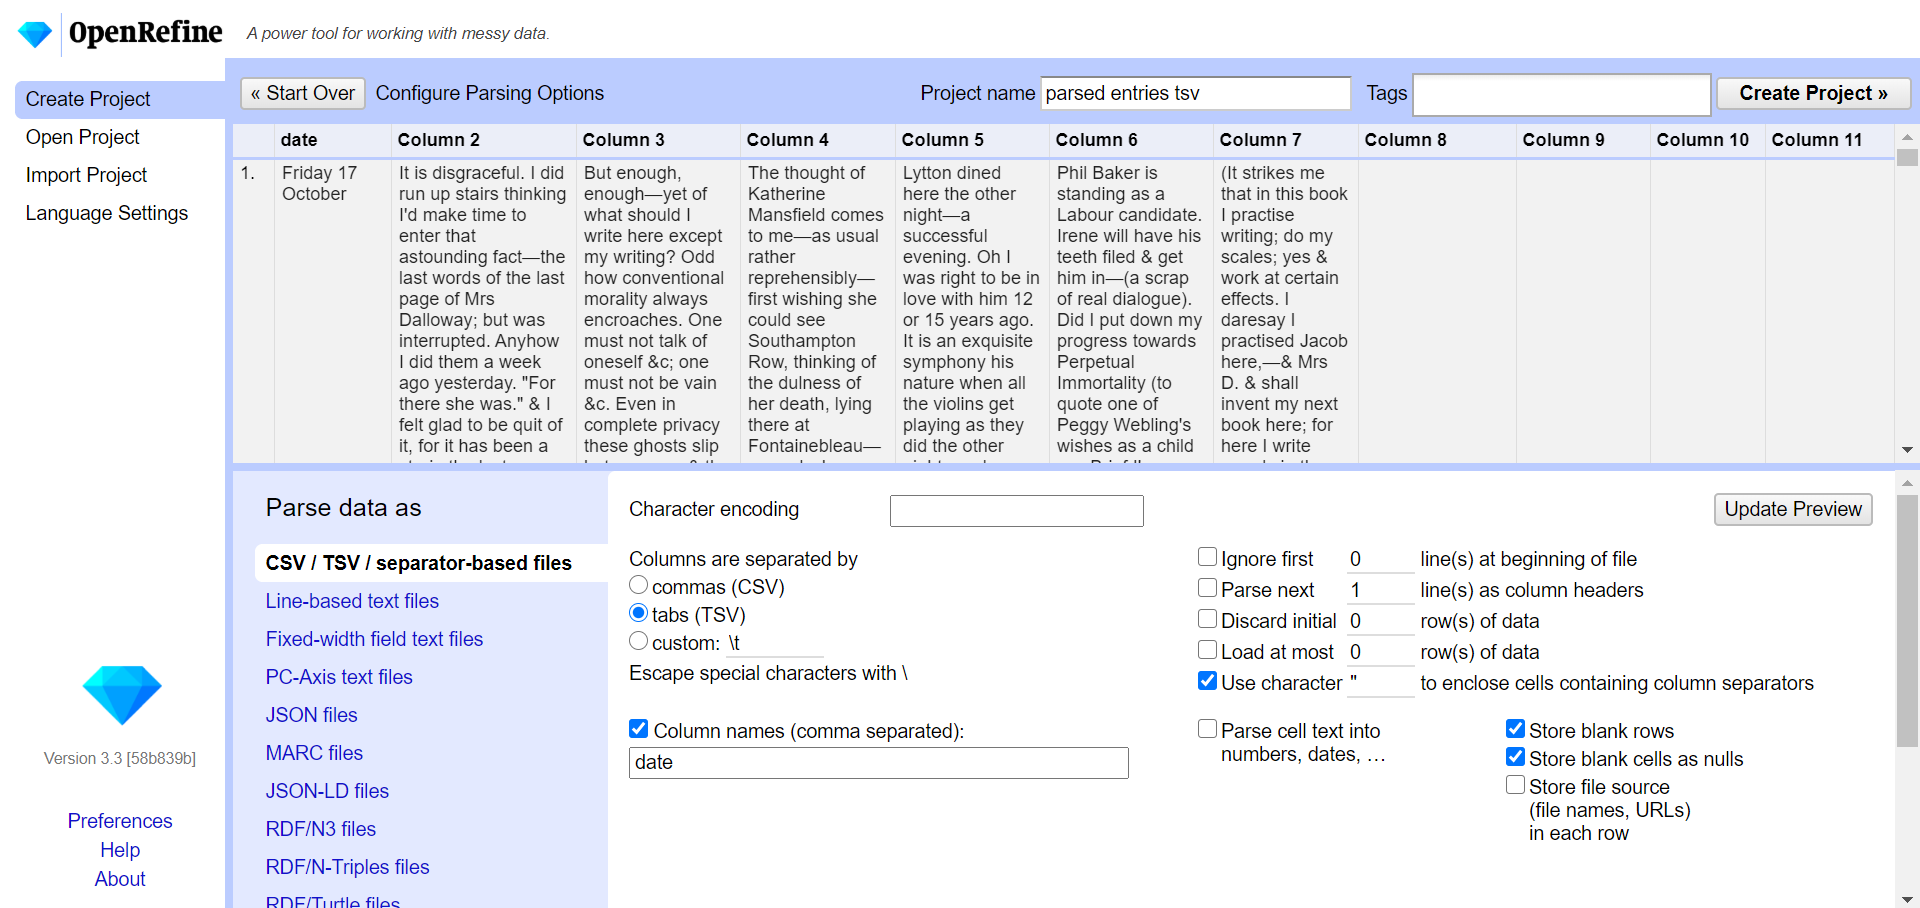
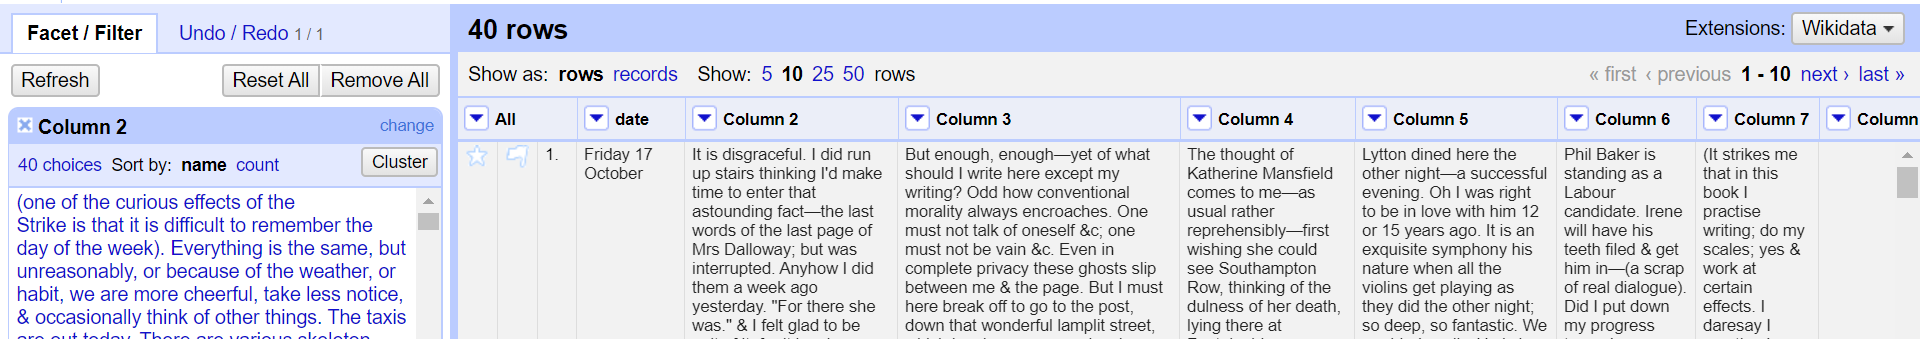
The columns proved to be too diverse for me to use OpenRefine on them and so I decided to just perform some basic operations on the entires -- trimming & colapsing whitespace and removing empty columns.
Writing the Python script prepare_to_sonify.py was difficult because I found it hard to visualise what sort of trend I actually wanted to surface through sonification.
Initially, my plan was to build 2 tracks corresponding to the diary entires of 2 different topics. But this was difficult because, I soon realised that by using words instead of numbers, I would be creating a qualitative description of my corpus, which wouldn't be so useful for sonification.
To fix this, I decided that I would build a number of tracks where each track corresponded to the lines when a topic was mentioned. The tsv table of data would be built with 7 columns;
- each column would belong to a topic
- each row would belong to a line
- each cell would contain the count of how many topic-words were used in that line.
The resulting script, I called prepare_to_sonify_2.py