There are several sections to every Python traceback, that are important. The diagram below is an attempt to help you see those different parts.
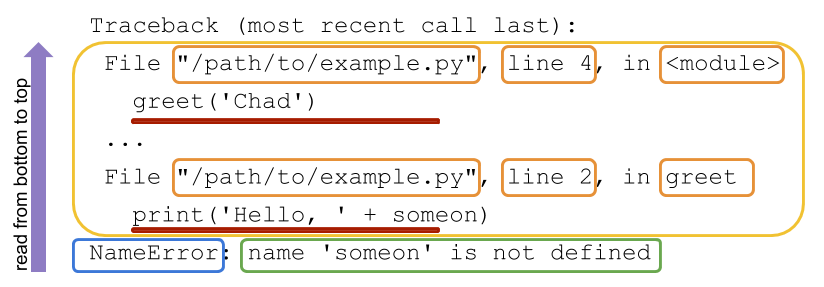
In python it is best to read the traceback from the bottom moving up. The last line of the traceback is what I call the error message line and it contains the exception name which was raised (outlined in blue). After, the exception name is the error message (outlined in yellow). This message, usually contains helpful information for understanding the reason the exception was being raised. Moving up the traceback (out-lined in green) is the different function calls moving from bottom to top, most recent to least recent. These calls are represented by two line entries for each call. The first line of each call contains information like: the file name, line number and module name all specifying where the code can be found. The second line for these calls contains the actual code that was executed (underline in red).
There are few differences between traceback output when executing your code in the command-line and running code in the REPL, below is the same code from the previous section executed in an REPL and the resulting traceback output.
```Python
def greet( someone ) :
... print('Hello, ' +someon) ...
greet("chad")
Traceback (most recent call last): File "", line 1, in File "", line 2, in greet NameError: name 'someon' is not defined