Description of the problem
Axis labels lost when use '-RgXmin/Xmax/Ymin/Ymax' to indicate a limited geographic domain.
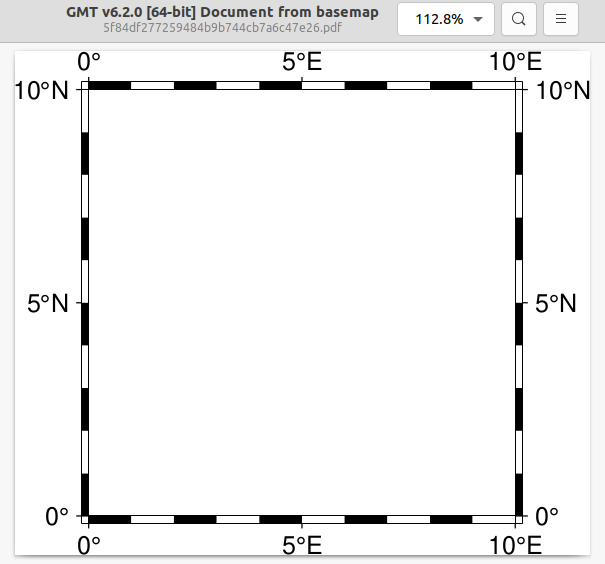
Full code that generated the error
import pygmt

fig = pygmt.Figure()
region = "g0/10/0/10"
fig.basemap(
    region=region, projection="X5c", frame=["WSNE", "xaf+llon/deg", "yaf+llat/deg"]
    )
fig.show()
Full error message
System information
Please paste the output of python -c "import pygmt; pygmt.show_versions()":
PyGMT information:
  version: v0.4.1
System information:
  python: 3.9.7 | packaged by conda-forge | (default, Sep 29 2021, 19:20:46)  [GCC 9.4.0]
  executable: /home/wxz/Program/miniconda3/envs/seismic/bin/python
  machine: Linux-5.11.0-38-generic-x86_64-with-glibc2.31
Dependency information:
  numpy: 1.21.2
  pandas: 1.3.3
  xarray: 0.19.0
  netCDF4: 1.5.7
  packaging: 21.0
  ghostscript: 9.54.0
  gmt: 6.2.0
GMT library information:
  binary dir: /home/wxz/Program/miniconda3/envs/seismic/bin
  cores: 16
  grid layout: rows
  library path: /home/wxz/Program/miniconda3/envs/seismic/lib/libgmt.so
  padding: 2
  plugin dir: /home/wxz/Program/miniconda3/envs/seismic/lib/gmt/plugins
  share dir: /home/wxz/Program/miniconda3/envs/seismic/share/gmt
  version: 6.2.0
Description of the problem
Axis labels lost when use '-RgXmin/Xmax/Ymin/Ymax' to indicate a limited geographic domain.
Full code that generated the error
Full error message
System information
Please paste the output of
python -c "import pygmt; pygmt.show_versions()":