- Introduction
- Business Task
- Stakeholders
- Data
- Processing and Cleaning
- Analysis
- Summary
- Recommendations
Cyclistic is a bike-share company that features more than 5,800 bicycles and 600 docking stations in Chicago. The company has two types of users: those with individual passes called "casual" riders and those with annual subscriptions called "member" riders.
The director of marketing believes the company’s future success depends on maximizing the number of annual memberships. The insights and recommendations of this analysis will help design the new marketing strategy.
-
How do casual riders and members differ?
-
How can the Cylistic marketing team target casual members using digital media to convert them into annual members?
The director of marketing and my manager
A team of data analysts who are responsible for collecting, analyzing, and reporting data that helps guide Cyclistic marketing strategy.
The notoriously detail-oriented executive team will decide whether to approve the recommended marketing program.
- Public data from Motivate International Inc. made available under this license.
- Data from January 2022 to December 2022 downloaded in .csv format from here.
- The data is from a credible source and is accessible to public for use.
Imported the .csv files to SQL Server.
Using UNION to combine data into a new table "yearly_rides" as all the column names and data types are same.
SELECT *
INTO yearly_rides
FROM dbo.t1
UNION
SELECT *
FROM dbo.t2
UNION
SELECT *
FROM dbo.t3
UNION
SELECT *
FROM dbo.t4
UNION
SELECT *
FROM dbo.t5
UNION
SELECT *
FROM dbo.t6
UNION
SELECT *
FROM dbo.t7
UNION
SELECT *
FROM dbo.t8
UNION
SELECT *
FROM dbo.t9
UNION
SELECT *
FROM dbo.t10
UNION
SELECT *
FROM dbo.t11
UNION
SELECT *
FROM dbo.t12
Viewing data structure, the table contains 13 column, we will not delete any column.
SELECT TOP 100* FROM dbo.yearly_rides
Counting the total number of rows = 5667617
SELECT COUNT(*) FROM dbo.yearly_rides
Adding a new column "day_of_week" that represents daya of week as integers and where Sunday = 1.
ALTER TABLE yearly_rides
ADD day_of_week INT

UPDATE yearly_rides
SET day_of_week = DATEPART(dw, started_at)
Adding a new column "month" by extracting month from started_at column.
ALTER TABLE yearly_rides
ADD month varchar(20)

UPDATE yearly_rides
SET month = DATENAME(month, started_at)
Adding a new column "hour" by extracting hour from started_at column.
ALTER TABLE yearly_rides
ADD hour int

UPDATE yearly_rides
SET hour = DATEPART(hour, started_at)
Changing the datatype of "started_at" and "ended_at" columns to datetime2(0), this will remove milliseconds.
ALTER TABLE yearly_rides
ALTER COLUMN started_at DATETIME2(0)


ALTER TABLE yearly_rides
ALTER COLUMN ended_at DATETIME2(0)
Adding a new column "ride_length" which is represents time duration in HH:MM:SS format as required from us. ride_length is calculated by subtracting "started_at" column from "ended_at" column.
ALTER TABLE yearly_rides
ADD ride_length AS CAST(DATEADD(s, DATEDIFF(s, started_at, ended_at), 0) AS TIME(0))
Selecting rows where difference between 'ended_at' and 'started_at' is less than zero i.e. time is negative. Returns 100 rows.
SELECT *
FROM yearly_rides
WHERE DATEDIFF(s, started_at, ended_at) < 0
Deleting these 100 rows because negative ride duration means its bad data.
DELETE
FROM yearly_rides
WHERE DATEDIFF(s, started_at, ended_at) < 0
Following query gives 427,441 rows where start and end station ids and names are null. In ideal case we should confirm and fill the data if possible, but since its not possible, we will keep it as it is.
SELECT * FROM dbo.yearly_rides
WHERE start_station_name IS NULL AND start_station_id IS NULL AND end_station_id IS NULL AND end_station_name IS NULL
Following queries confirm if either one of station_id or station_name is missing, so that we can match the missing ids and names. Returns 0 rows so no action needed.
SELECT * FROM yearly_rides
WHERE start_station_name IS NULL AND start_station_id IS NOT NULL
OR start_station_id IS NULL AND start_station_name IS NOT NULL


SELECT * FROM yearly_rides
WHERE end_station_name IS NULL AND end_station_id IS NOT NULL
OR end_station_id IS NULL AND end_station_name IS NOT NULL
Looking for duplicates, ride_id should be unique for each ride. This query returns 0 rows.
SELECT ride_id, COUNT(*)
FROM dbo.yearly_rides
GROUP BY ride_id
HAVING COUNT(*) > 1
Docked bikes need to be returned to an end station. Following query deletes rows where end station name and id are missing for docked bikes as this is bad data. 2616 rows removed.
DELETE
FROM yearly_rides
WHERE rideable_type = 'docked_bike' AND end_station_id IS NULL AND end_station_name IS NULL
Using SQL server for analyzing the cleaned data to find useful information.
Following query returns minimum, maximum and average ride_length.
SELECT
       MIN(ride_length) AS min_ride_length,
	   MAX(ride_length) AS max_ride_length,
	   CONVERT(time(0), DATEADD(second, AVG(CAST(DATEDIFF(second, started_at, ended_at) AS bigint)), 0)) AS avg_ride_length
FROM yearly_rides
This single query will give us number of rides and average ride length in minutes for memebers and casuals by hour, day, month and rideable_type instead of writing multiple individual queries
SELECT month,
	   CASE day_of_week
			WHEN 1 THEN 'Sunday'
			WHEN 2 THEN 'Monday'
			WHEN 3 THEN 'Tuesday'
			WHEN 4 THEN 'Wednesday'
			WHEN 5 THEN 'Thursday'
			WHEN 6 THEN 'Friday'
			WHEN 7 THEN 'Saturday'
			ELSE 'Unknown'
		END AS week_day,
       hour,
	   member_casual,
	   rideable_type,
	   COUNT(*) AS num_of_rides,
	   AVG(DATEDIFF(MINUTE, started_at, ended_at)) AS avg_ride_length
FROM yearly_rides
GROUP BY month, day_of_week, hour, member_casual, rideable_type, MONTH(started_at)
Order BY MONTH(started_at), day_of_week, hour, member_casual, rideable_type
The results of this query were exported as an excel workbook. Instead of using the entire dataset I used this result for visualization.
Importing the result excel workbook into Power bi for visualizations. The result of the previous query contains all the data required for generating insights.
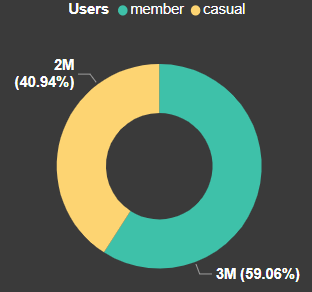
- 59.06% of total rides (a little more than 3M) were taken by members.
- 40.94% of total rides (a little more than 2M) were taken by casual riders.
- Members took more rides than casual riders and form the majority, the company should try to maximize the number of annual members.
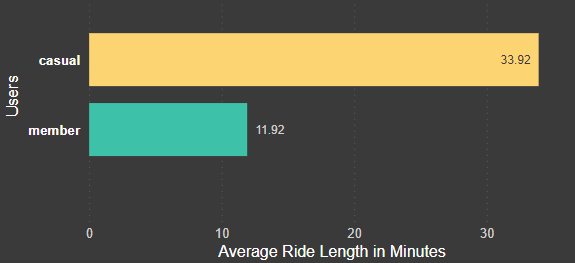
- Despite taking less number of rides, the average duration of ride by casual riders is almost 3 times that of members.
- This may be because members use it for daily commute, with a fixed distance, while casual riders use it for leisure purposes and ride greater distances.
- The average ride duration, including both user types, is 25.06 minutes.
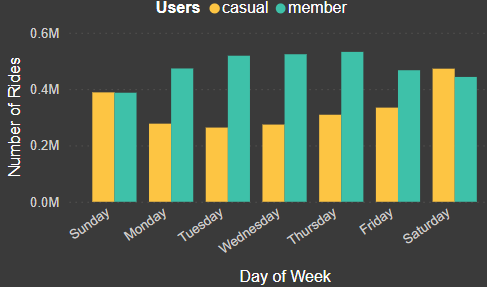
- Members use the service more during work days, while casual riders ride more during the weekends.
- This indicates that members commute for work while riders ride for leisure purposes.
- Casual riders ride about 50% less than members during work days.
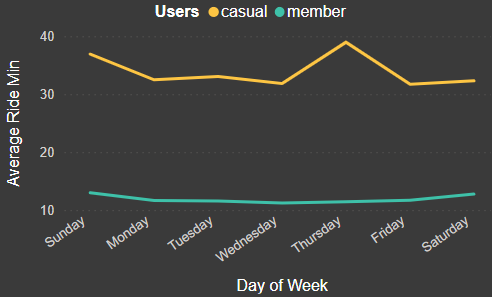
- The average ride duration of casual riders is three times more than members throughout the week.
- It peaks on thursday, which is an unsual insight as casual members ride more during the weekends.
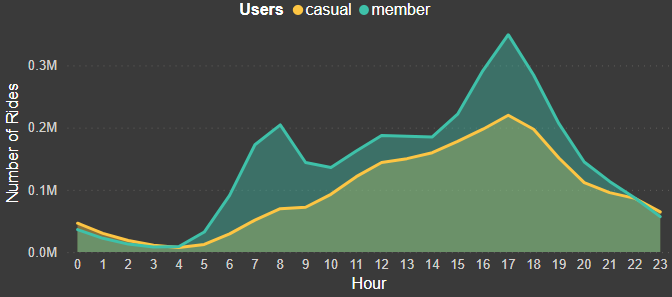
- Number of rides by members peak in morning and evening hours which corresponds to 9 to 5 work hours.
- Number of rides by casuals rises in afternoon and evening and peaks at around 5 pm.
- Overall, members take greater number of rides throughout the day.

- Both members and casual riders ride more in summer months compared to winter months.
- Casual members ride a lot more between May to September, with July being the peak month.
- Ride share by casual members fall drastically in December, January and February.
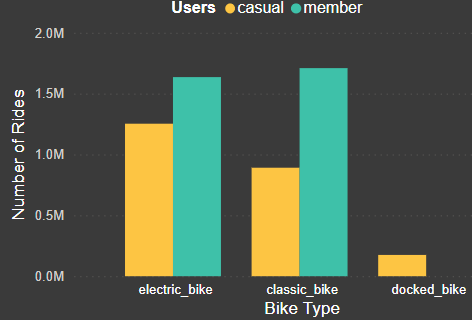
- Electric bike is most popular among casual riders while classic bike is most popular among members.
- Docked bike is the least popular bike, it is not used by members. This may be because it has to be docked in a station which is not practical when commuting to a work or another destination.
- Casual riders use the service for leisure purposes and ride more during weekends while members use it to to commute to work.
- Both members and casual riders use the service more in summer months. Casual riders decrease drastically in winters.
- Casual riders ride longer than members on average.
The data lacked financial data, like subscription charges, which was essential for complete analysis. However, following are my recommendations based on the available data.
- Increase ride charges for individual ride passes longer than a specific duration. Since casual riders tend to ride longer, increasing the charge after a specific duration (maybe after 20 minutes of riding), will make subscription more appealling to them as annual membership charges are fixed.
- Increase ride charges for individual ride passes longer during weekend and summers. As casual riders ride most during summer months and weekends, increased charges will drive them towards annual membership.
- Targeted marketing strategies in areas near places of leisure like parks, cinemas and restuarants, to target more casual riders.
- Discounted holiday packages during winters (around Christmas) should be introduced to attract more users during those months.