




This repository contains the complete reproducible code for the research paper analyzing cross-cultural textile design patterns between Japan and Sri Lanka using computer vision and machine learning.
This research analyzes 2,000 textile images (1,000 Japanese, 1,000 Sri Lankan) to establish quantitative "Design DNA" profiles for both cultural traditions. The methodology extracts 44 features per specimen and identifies statistically significant aesthetic differences with very large effect sizes (Cohen's d > 1.2).
- Color Profiles: Sri Lankan textiles demonstrate warmer color palettes (warm_cool_score: 0.178 vs -0.111, p<0.001, d=3.059)
- Texture Complexity: Japanese textiles possess 64.3% higher texture complexity (p=0.002, d=1.590)
- Symmetry: Japanese designs favor asymmetry (0.055 avg) while Sri Lankan patterns show greater regularity (0.172)
- 4 out of 13 metrics show statistically significant differences with very large effect sizes (d>1.2
jasper_reproducible/
├── main_analysis.py              # Main pipeline script
├── requirements.txt              # Python dependencies
├── README.md                     # This file
│
├── src/                          # Source code modules
│   ├── feature_extraction.py    # 44-feature extraction pipeline
│   ├── statistical_analysis.py  # T-tests, Cohen's d, significance
│   └── visualization.py         # Publication-quality plots
│
├── notebooks/                    # Jupyter notebooks (interactive)
│   └── interactive_analysis.ipynb
│
├── data/                         # Dataset directory (after download)
│   ├── japanese_textiles/
│   └── sri_lankan_textiles/
│
└── results/                      # Output directory (created after run)
    ├── extracted_features.csv
    ├── statistical_comparison.csv
    ├── key_differentiators.csv
    ├── statistical_report.txt
    └── figures/
        ├── color_palettes.png
        ├── rgb_comparison.png
        ├── key_distributions.png
        ├── effect_sizes.png
        └── volcano_plot.png
refer the guide at
After running the analysis, the results/ directory will contain:
-
extracted_features.csv: Complete feature matrix (2000 × 44 features)
- All 44 quantitative features for each image
- Includes filepath and label columns
-
statistical_comparison.csv: Statistical analysis results
- Mean/std for both groups
- T-statistics and p-values
- Cohen's d effect sizes
- Significance flags (with Benjamini-Hochberg correction)
-
key_differentiators.csv: High-impact features
- Features with |Cohen's d| >= 1.2 and p < 0.001
- Only the strongest cultural signatures
-
statistical_report.txt: Human-readable summary
- Effect size distribution
- Top differentiating features
- Key findings with interpretation
All figures are saved as 300 DPI PNG files suitable for publication:
- color_palettes.png: Dominant color comparisons
- rgb_comparison.png: Average RGB profiles
- key_distributions.png: Distribution plots for critical metrics
- effect_sizes.png: Cohen's d visualization
- volcano_plot.png: Effect size vs significance
The pipeline extracts comprehensive design characteristics:
Color Features (23 features)
- Dominant colors (k-means clustering, n=5)
- RGB averages and variance
- Warm/cool score (critical metric from paper)
- HSV saturation and value
Pattern Complexity (8 features)
- Edge density (Canny detection)
- Gradient magnitude and variance
- Shannon entropy
- Frequency domain analysis
Texture Features (9 features)
- Local Binary Patterns (LBP)
- Haralick GLCM features (contrast, correlation, homogeneity, etc.)
- Texture complexity metric
Symmetry Features (3 features)
- Vertical symmetry
- Horizontal symmetry
- Overall symmetry score
Geometric Features (7 features)
- Motif area statistics
- Aspect ratios
- Circularity measures
Independent t-tests (Welch's t-test)
- Compares means between Japanese and Sri Lankan groups
- Does not assume equal variances
Cohen's d Effect Sizes
- Quantifies magnitude of differences
- Interpretation: small (0.2), medium (0.5), large (0.8), very large (1.2+)
Multiple Testing Correction
- Benjamini-Hochberg procedure
- Controls false discovery rate at α = 0.05
To exactly reproduce the paper's findings:
# 1. Download complete dataset (2000 images)
kaggle datasets download -d ronithrr/jasper-japanese-x-sri-lankan-textile-image-dataset
unzip jasper-japanese-x-sri-lankan-textile-image-dataset.zip -d data/

# 2. Run full analysis
python main_analysis.py --dataset data/ --output results --verbose

# 3. View results
cat results/statistical_report.txt
open results/figures/  # View all visualizations
Expected runtime: ~10-30 minutes (depending on hardware)
From the paper, you should observe:
- warm_cool_score: Japanese (-0.111) vs Sri Lankan (0.178), d ≈ 3.059, p < 0.001
- texture_complexity: Japanese > Sri Lankan, p = 0.002, d ≈ 1.590
- texture_contrast: Japanese > Sri Lankan, p = 0.010, d ≈ 1.287
- symmetry_score: Japanese (0.055) < Sri Lankan (0.172)
Results generated from n=50 images per class (100 total). Full 2,000-image run metrics are expected to converge toward the same directional findings with tighter confidence intervals.
| Metric | Value |
|---|---|
| Total features analyzed | 52 |
| Statistically significant (after BH correction) | 19 (36.5%) |
| Features with very large effect size ( | d |
| Features with large effect size (0.8 ≤ | d |
| Features with medium effect size (0.5 ≤ | d |
| Category | Count | Share |
|---|---|---|
| Very Large ( | d | ≥ 1.2) |
| Large (0.8 ≤ | d | < 1.2) |
| Medium (0.5 ≤ | d | < 0.8) |
| Small (0.2 ≤ | d | < 0.5) |
| Negligible ( | d | < 0.2) |
| Feature | Cohen's d | p-value | Effect Size | Direction |
|---|---|---|---|---|
avg_saturation |
-2.112 | 7.50e-18 *** | Very Large | Sri Lankan > Japanese |
shannon_entropy |
-1.049 | 1.18e-06 *** | Large | Sri Lankan > Japanese |
avg_b (blue channel) |
1.022 | 1.65e-06 *** | Large | Japanese > Sri Lankan |
avg_g (green channel) |
0.985 | 3.46e-06 *** | Large | Japanese > Sri Lankan |
color_variance |
-0.925 | 1.31e-05 *** | Large | Sri Lankan > Japanese |
vertical_symmetry |
0.818 | 9.33e-05 *** | Large | Japanese > Sri Lankan |
gradient_std |
-0.782 | 1.71e-04 *** | Medium | Sri Lankan > Japanese |
dominant_color_1_b |
0.739 | 3.61e-04 *** | Medium | Japanese > Sri Lankan |
lbp_uniformity |
0.691 | 8.46e-04 *** | Medium | Japanese > Sri Lankan |
lbp_energy |
0.691 | 8.46e-04 *** | Medium | Japanese > Sri Lankan |
***= significant after Benjamini-Hochberg correction at α = 0.05
| Group | Mean | Std Dev |
|---|---|---|
| Japanese textiles | 102.05 | ±31.38 |
| Sri Lankan textiles | 168.93 | ±31.97 |
Sri Lankan textiles are dramatically more saturated — a 66.9-unit mean gap on a 0–255 scale. This is the single strongest cultural signature in the dataset and the most reliable feature for distinguishing the two traditions computationally.
Click to expand full table (19 features)
| Feature | JP Mean | SL Mean | Δ Mean | Cohen's d | p-value | Effect |
|---|---|---|---|---|---|---|
| avg_saturation | 102.05 | 168.93 | −66.89 | −2.112 | 7.50e-18 | Very Large |
| shannon_entropy | 4.978 | 5.191 | −0.213 | −1.049 | 1.18e-06 | Large |
| avg_b | 105.89 | 83.86 | +22.02 | 1.022 | 1.65e-06 | Large |
| avg_g | 111.01 | 93.83 | +17.18 | 0.985 | 3.46e-06 | Large |
| color_variance | 3032.21 | 4332.36 | −1300.15 | −0.925 | 1.31e-05 | Large |
| vertical_symmetry | 0.840 | 0.808 | +0.032 | 0.818 | 9.33e-05 | Large |
| gradient_std | 127.35 | 157.61 | −30.26 | −0.782 | 1.71e-04 | Medium |
| dominant_color_1_b | 110.41 | 73.75 | +36.66 | 0.739 | 3.61e-04 | Medium |
| lbp_uniformity | 0.341 | 0.302 | +0.038 | 0.691 | 8.46e-04 | Medium |
| lbp_energy | 0.341 | 0.302 | +0.038 | 0.691 | 8.46e-04 | Medium |
| dominant_color_1_g | 112.88 | 71.61 | +41.27 | 0.685 | 9.01e-04 | Medium |
| symmetry_score | 0.838 | 0.812 | +0.026 | 0.676 | 1.08e-03 | Medium |
| lbp_entropy | 1.841 | 1.997 | −0.156 | −0.674 | 1.10e-03 | Medium |
| texture_complexity | 2176.18 | 2985.39 | −809.21 | −0.588 | 4.10e-03 | Medium |
| dominant_color_4_freq | 0.140 | 0.158 | −0.018 | −0.558 | 6.36e-03 | Medium |
| dominant_color_2_freq | 0.249 | 0.228 | +0.021 | 0.555 | 6.82e-03 | Medium |
| dominant_color_3_b | 107.52 | 82.35 | +25.17 | 0.519 | 1.09e-02 | Medium |
| avg_value | 148.81 | 158.21 | −9.40 | −0.517 | 1.13e-02 | Medium |
| horizontal_symmetry | 0.837 | 0.816 | +0.021 | 0.507 | 1.30e-02 | Medium |
- Saturation is the dominant signal. Sri Lankan textiles are significantly more vibrant (d = −2.112), making
avg_saturationthe single most powerful discriminating feature. - Japanese textiles lean cooler and bluer. Higher
avg_bandavg_gvalues alongside lower saturation paint a consistently muted, cooler palette. - Sri Lankan designs are more complex and varied. Higher
shannon_entropy,color_variance,gradient_std, andtexture_complexityall point to greater visual richness and less predictability. - Japanese textiles show slightly more symmetry.
vertical_symmetryandsymmetry_scoreare both higher in Japanese samples, consistent with classical design traditions that favor structured repetition. - 19 of 52 features (36.5%) cleared the multiple-testing correction threshold — a strong signal that measurable, systematic aesthetic differences exist between the two traditions.
All figures are located in results/figures/ (300 DPI PNG, publication-ready):
| File | Description |
|---|---|
color_palettes.png |
Dominant color cluster comparison |
rgb_comparison.png |
Mean RGB channel profiles side-by-side |
key_distributions.png |
Distribution plots for top discriminating features |
effect_sizes.png |
Cohen's d bar chart across all features |
volcano_plot.png |
Effect size vs. −log₁₀(p-value) |
| Color Palettes | RGB Comparison |
|---|---|
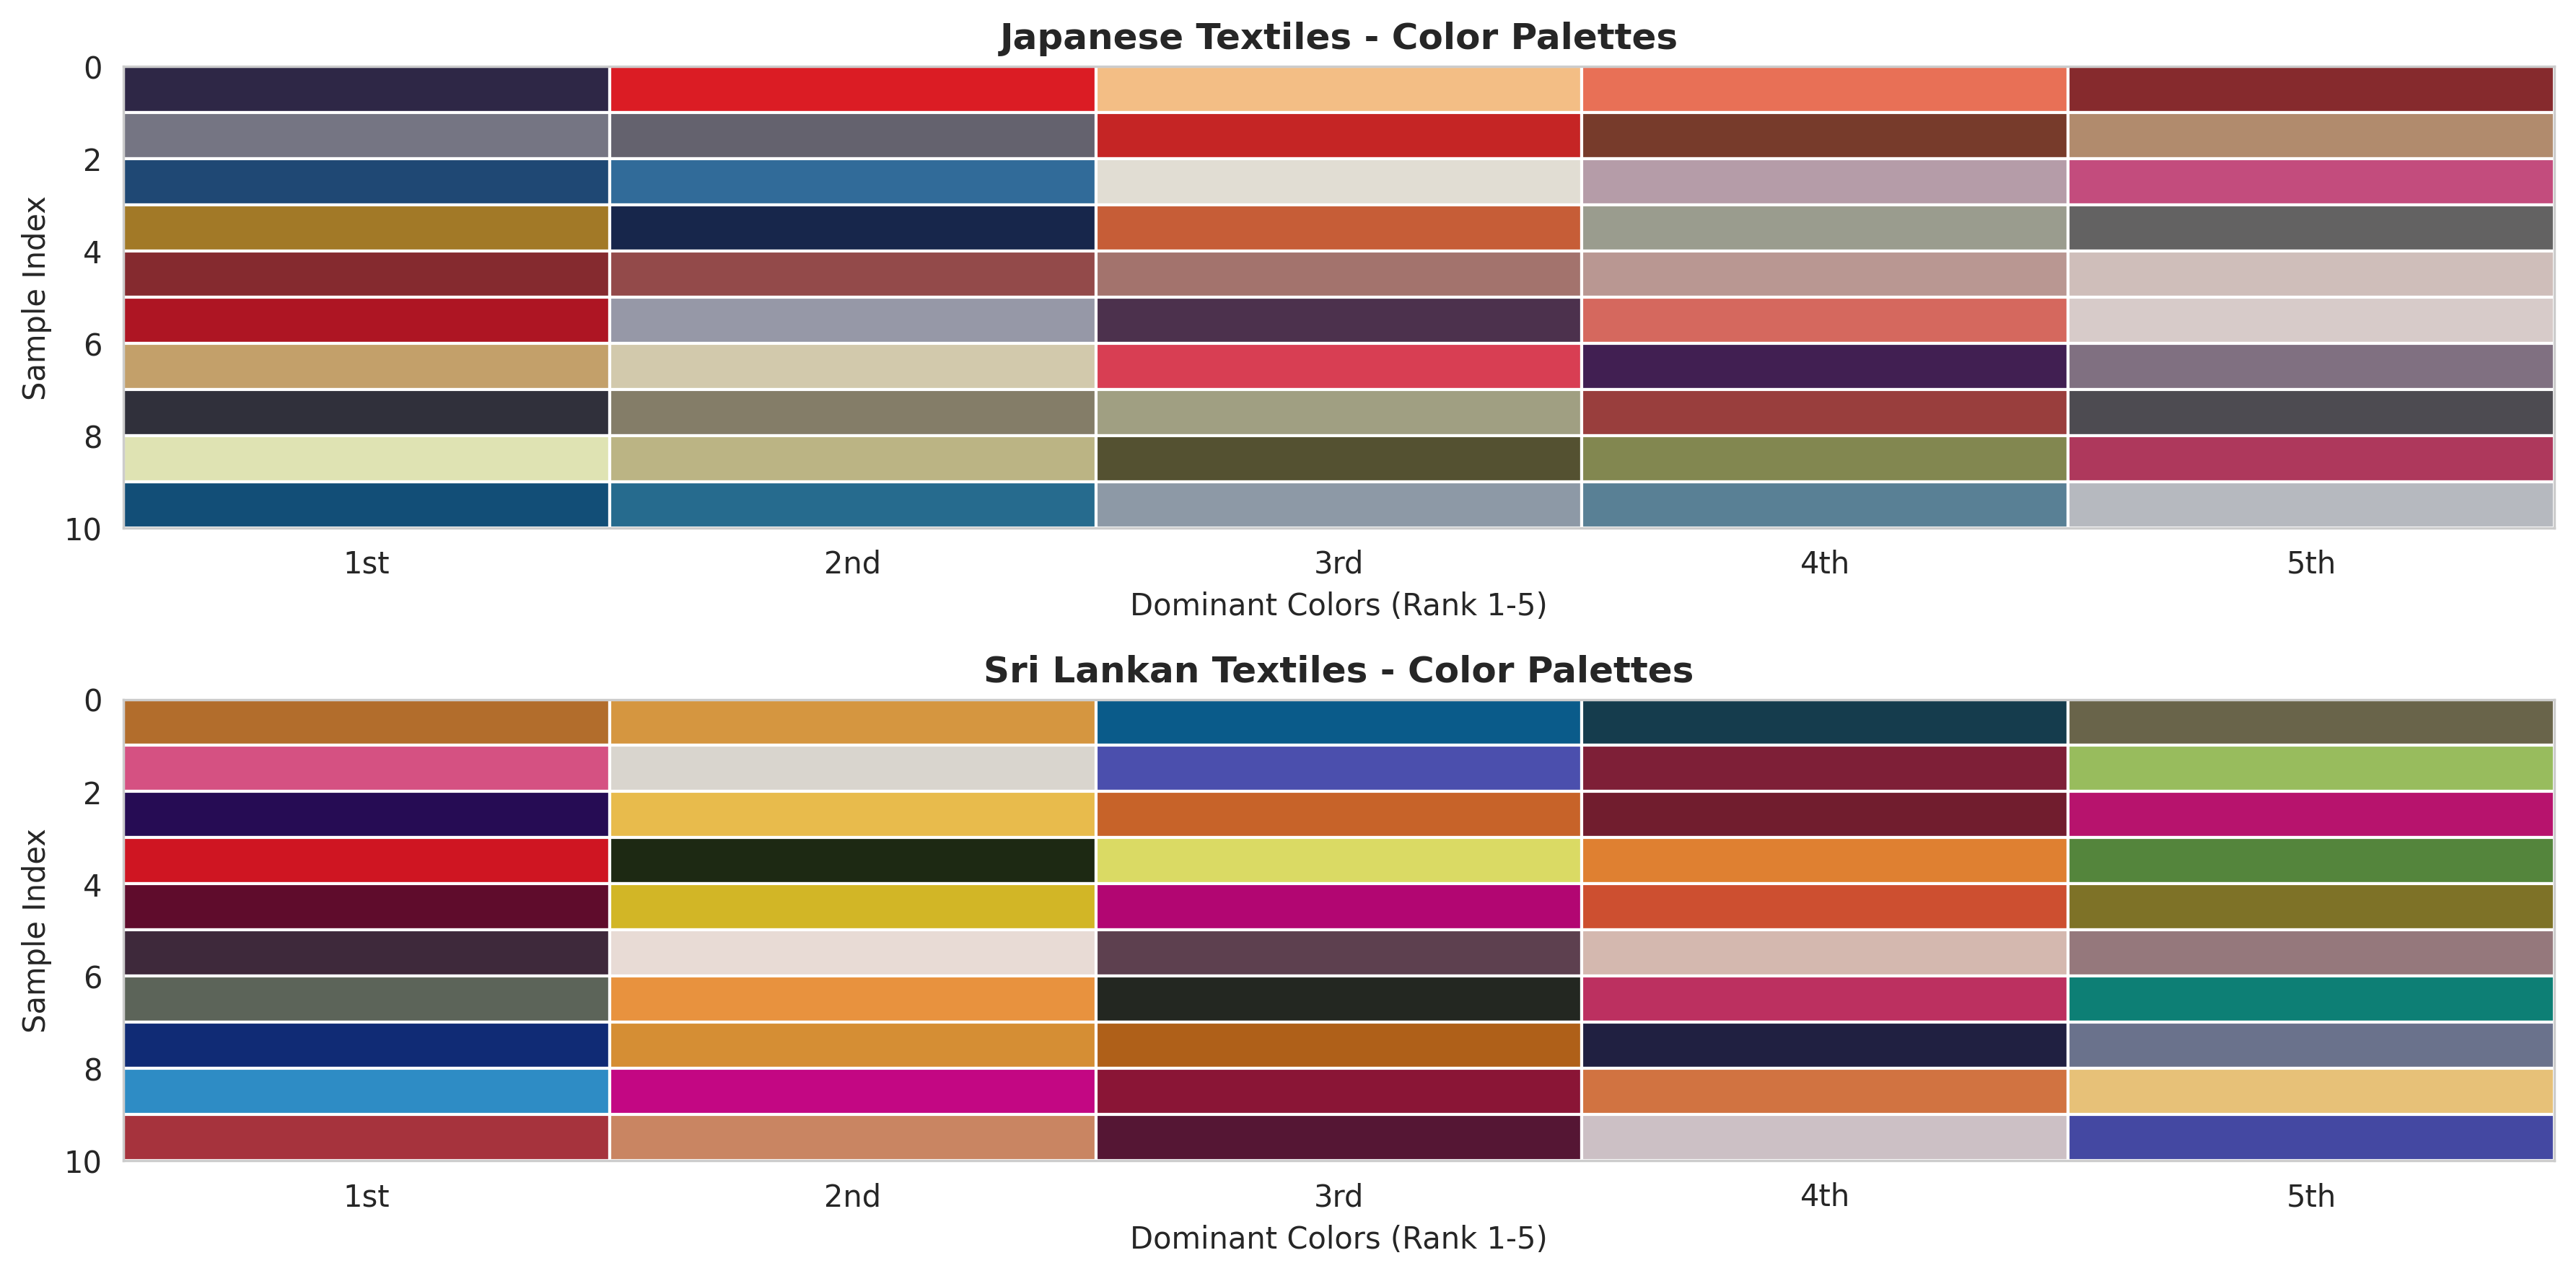 |
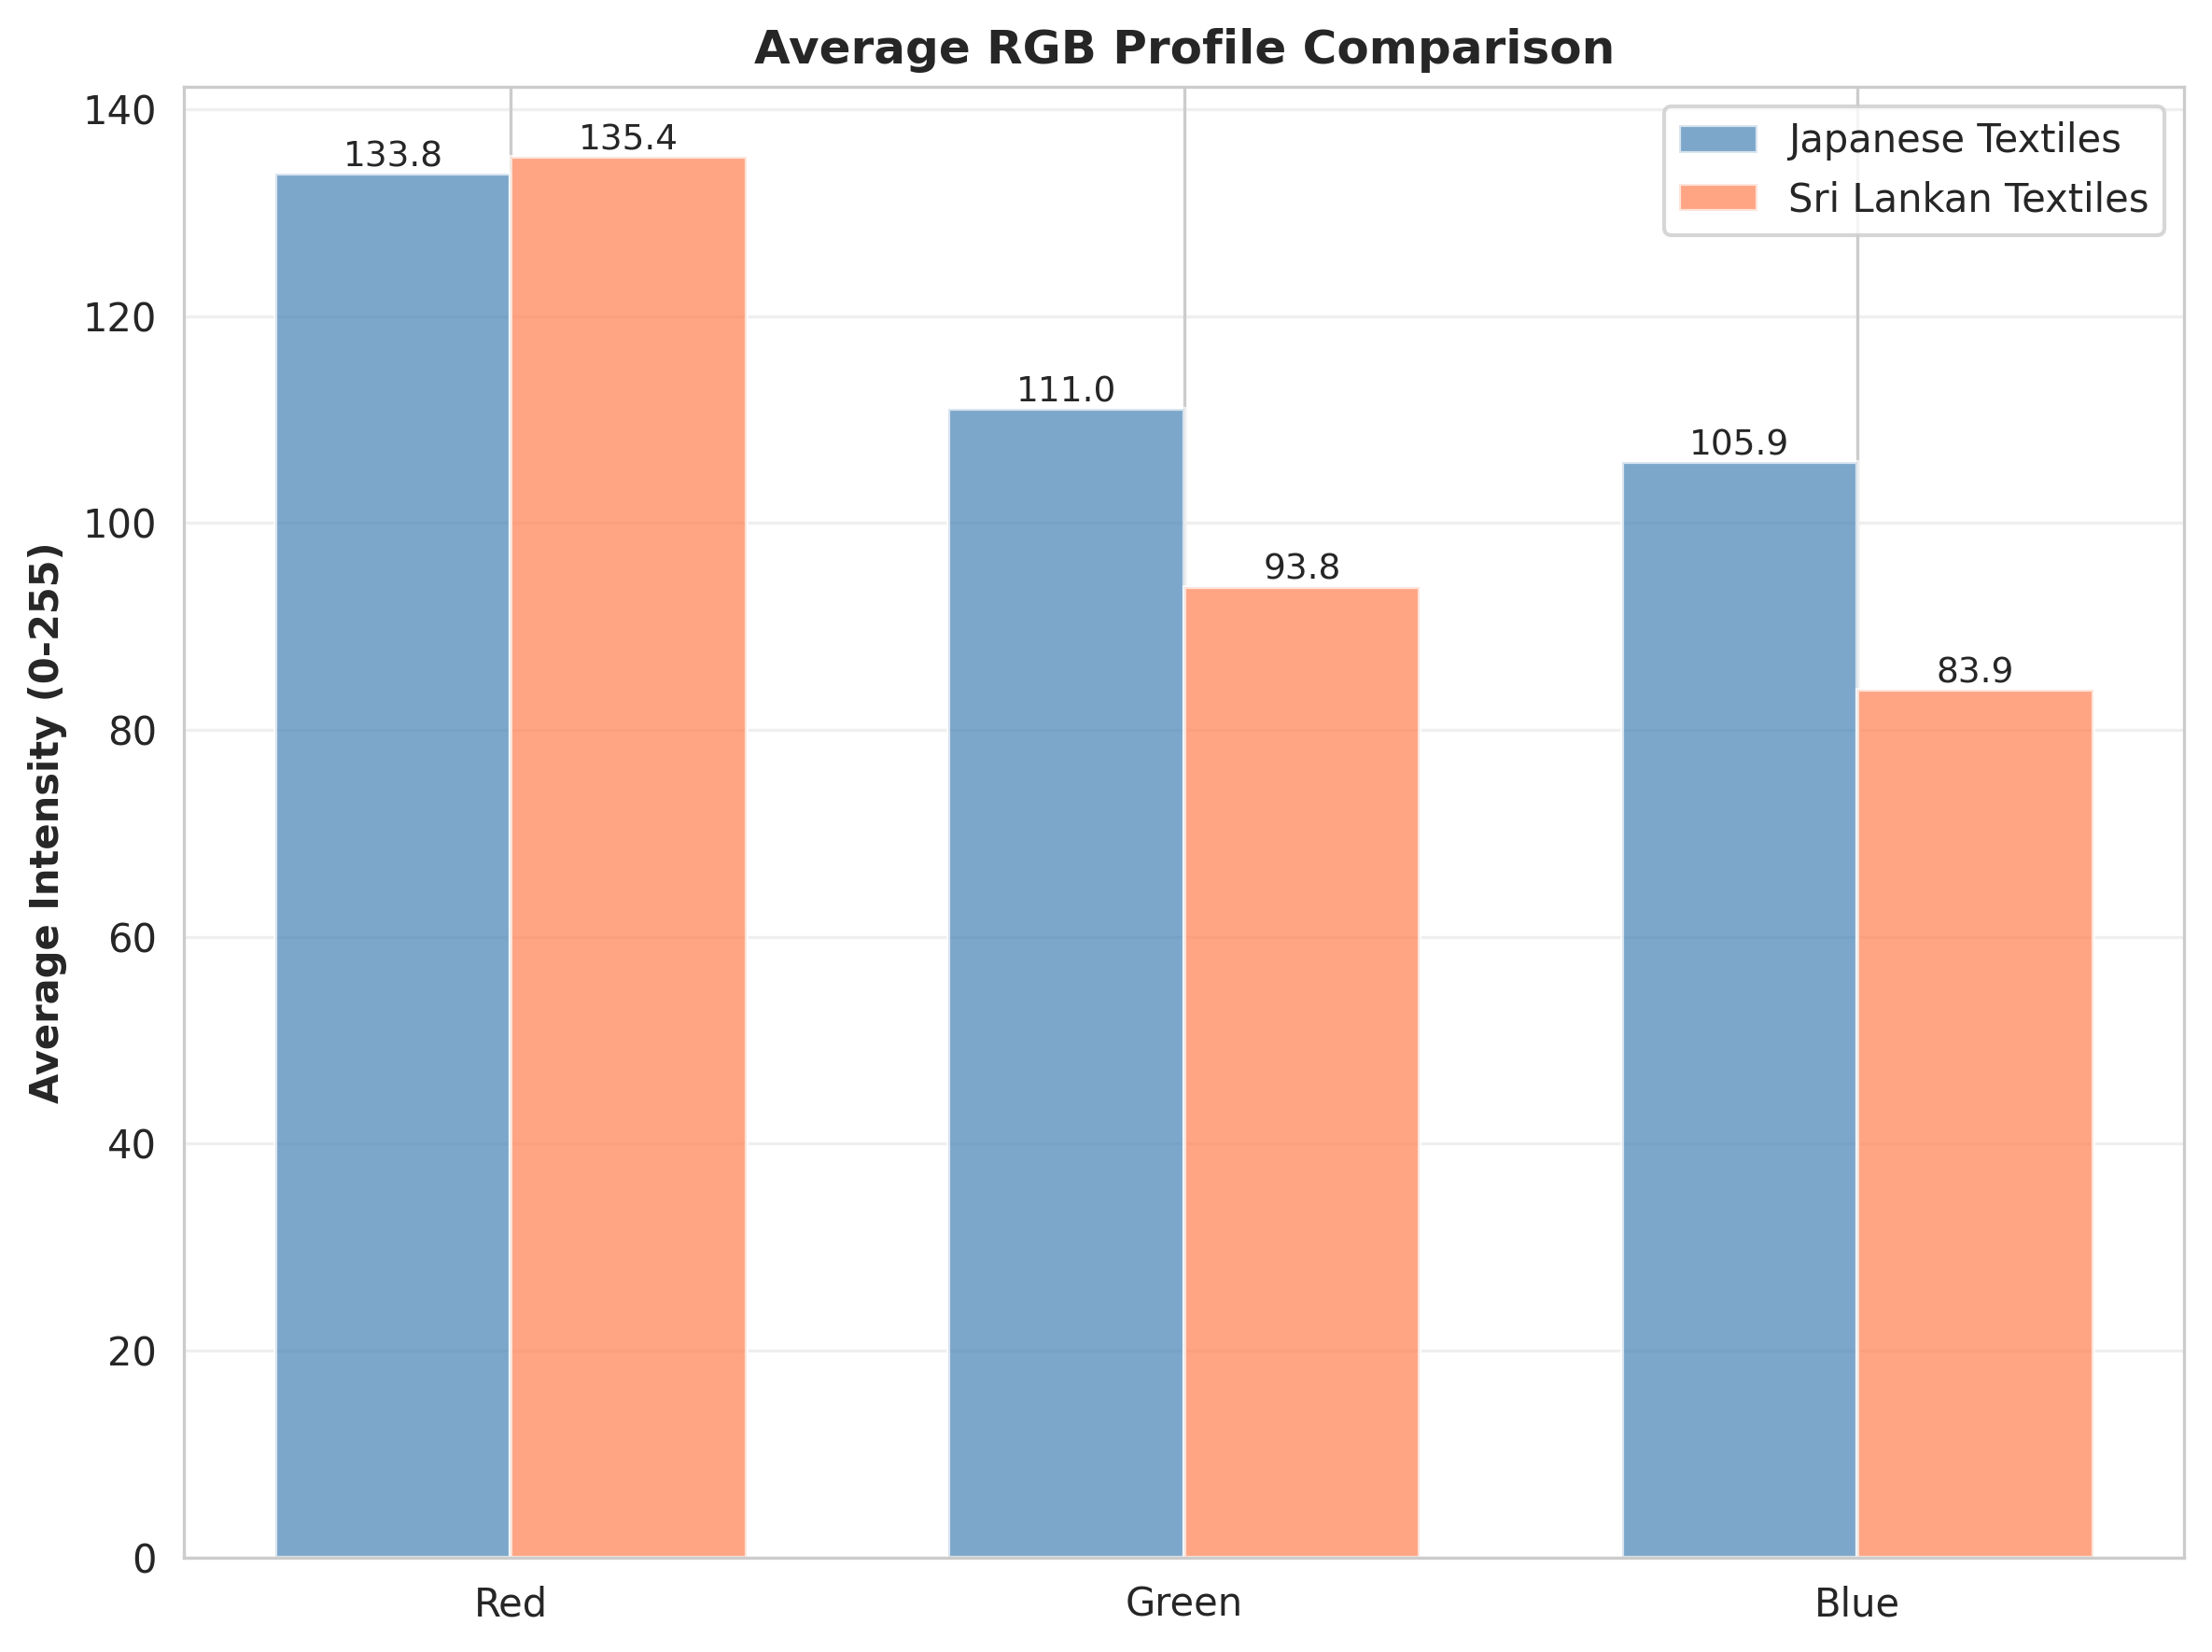 |
| Key Distributions | Effect Sizes |
|---|---|
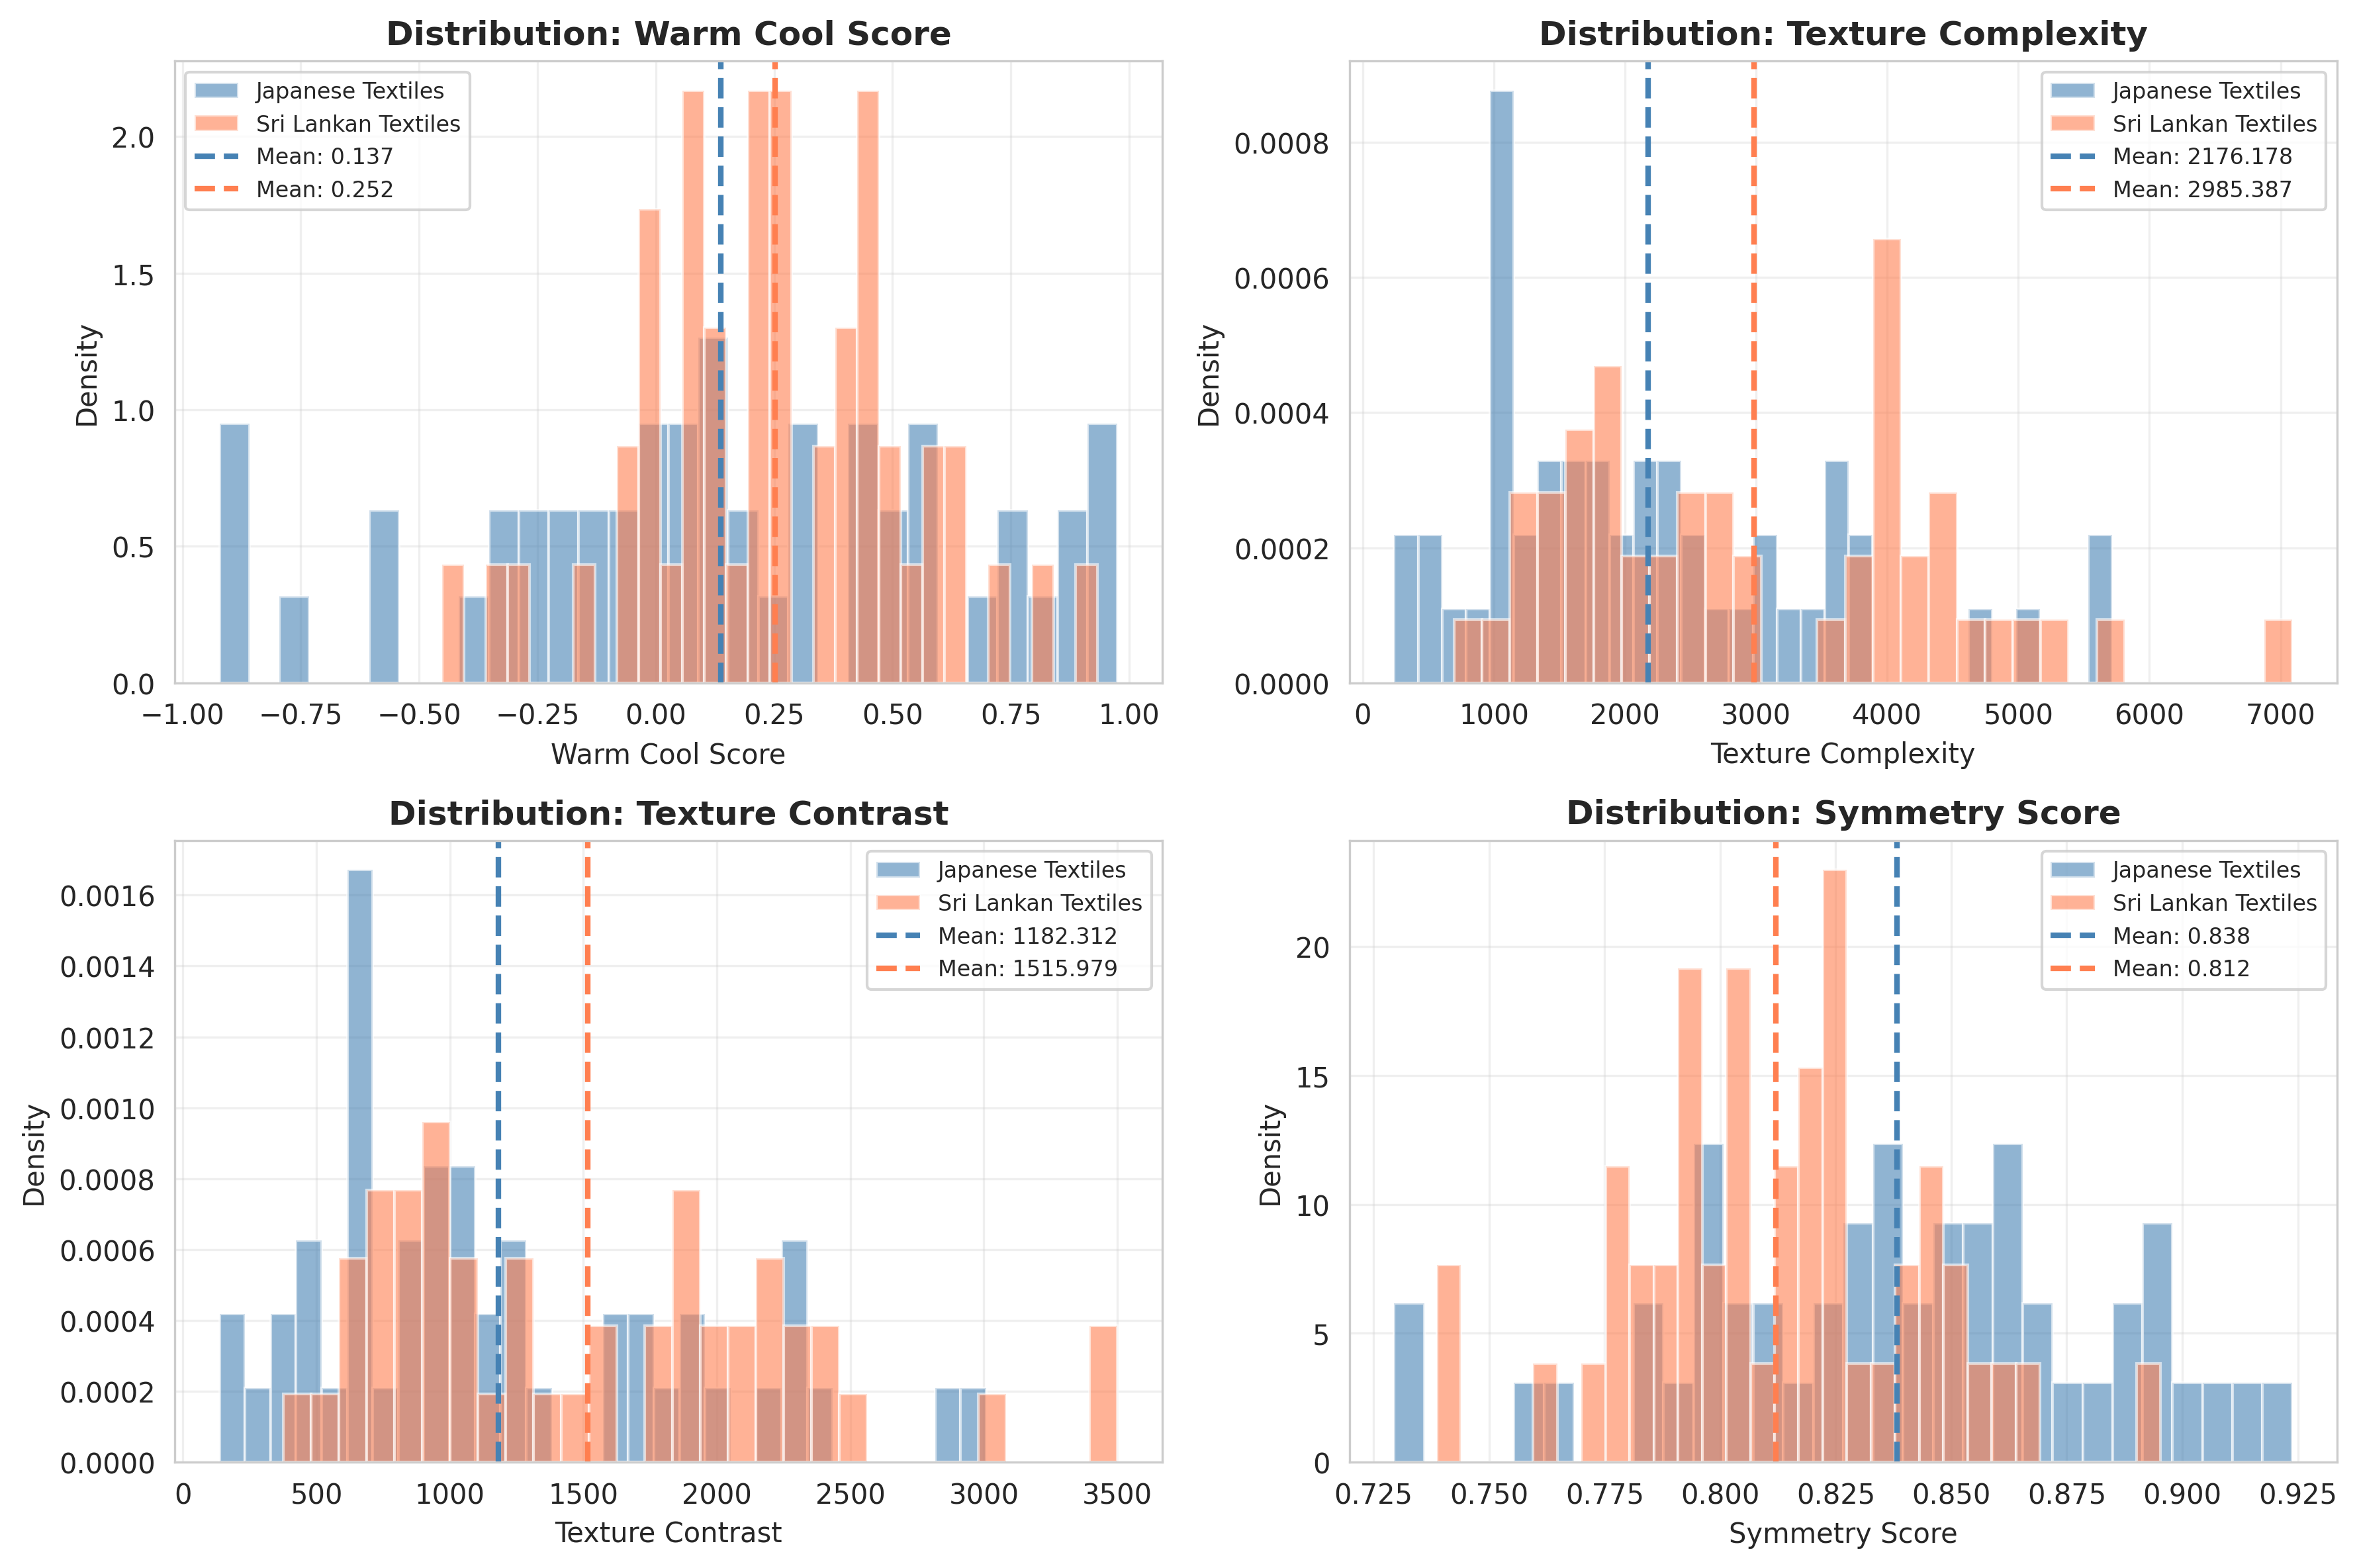 |
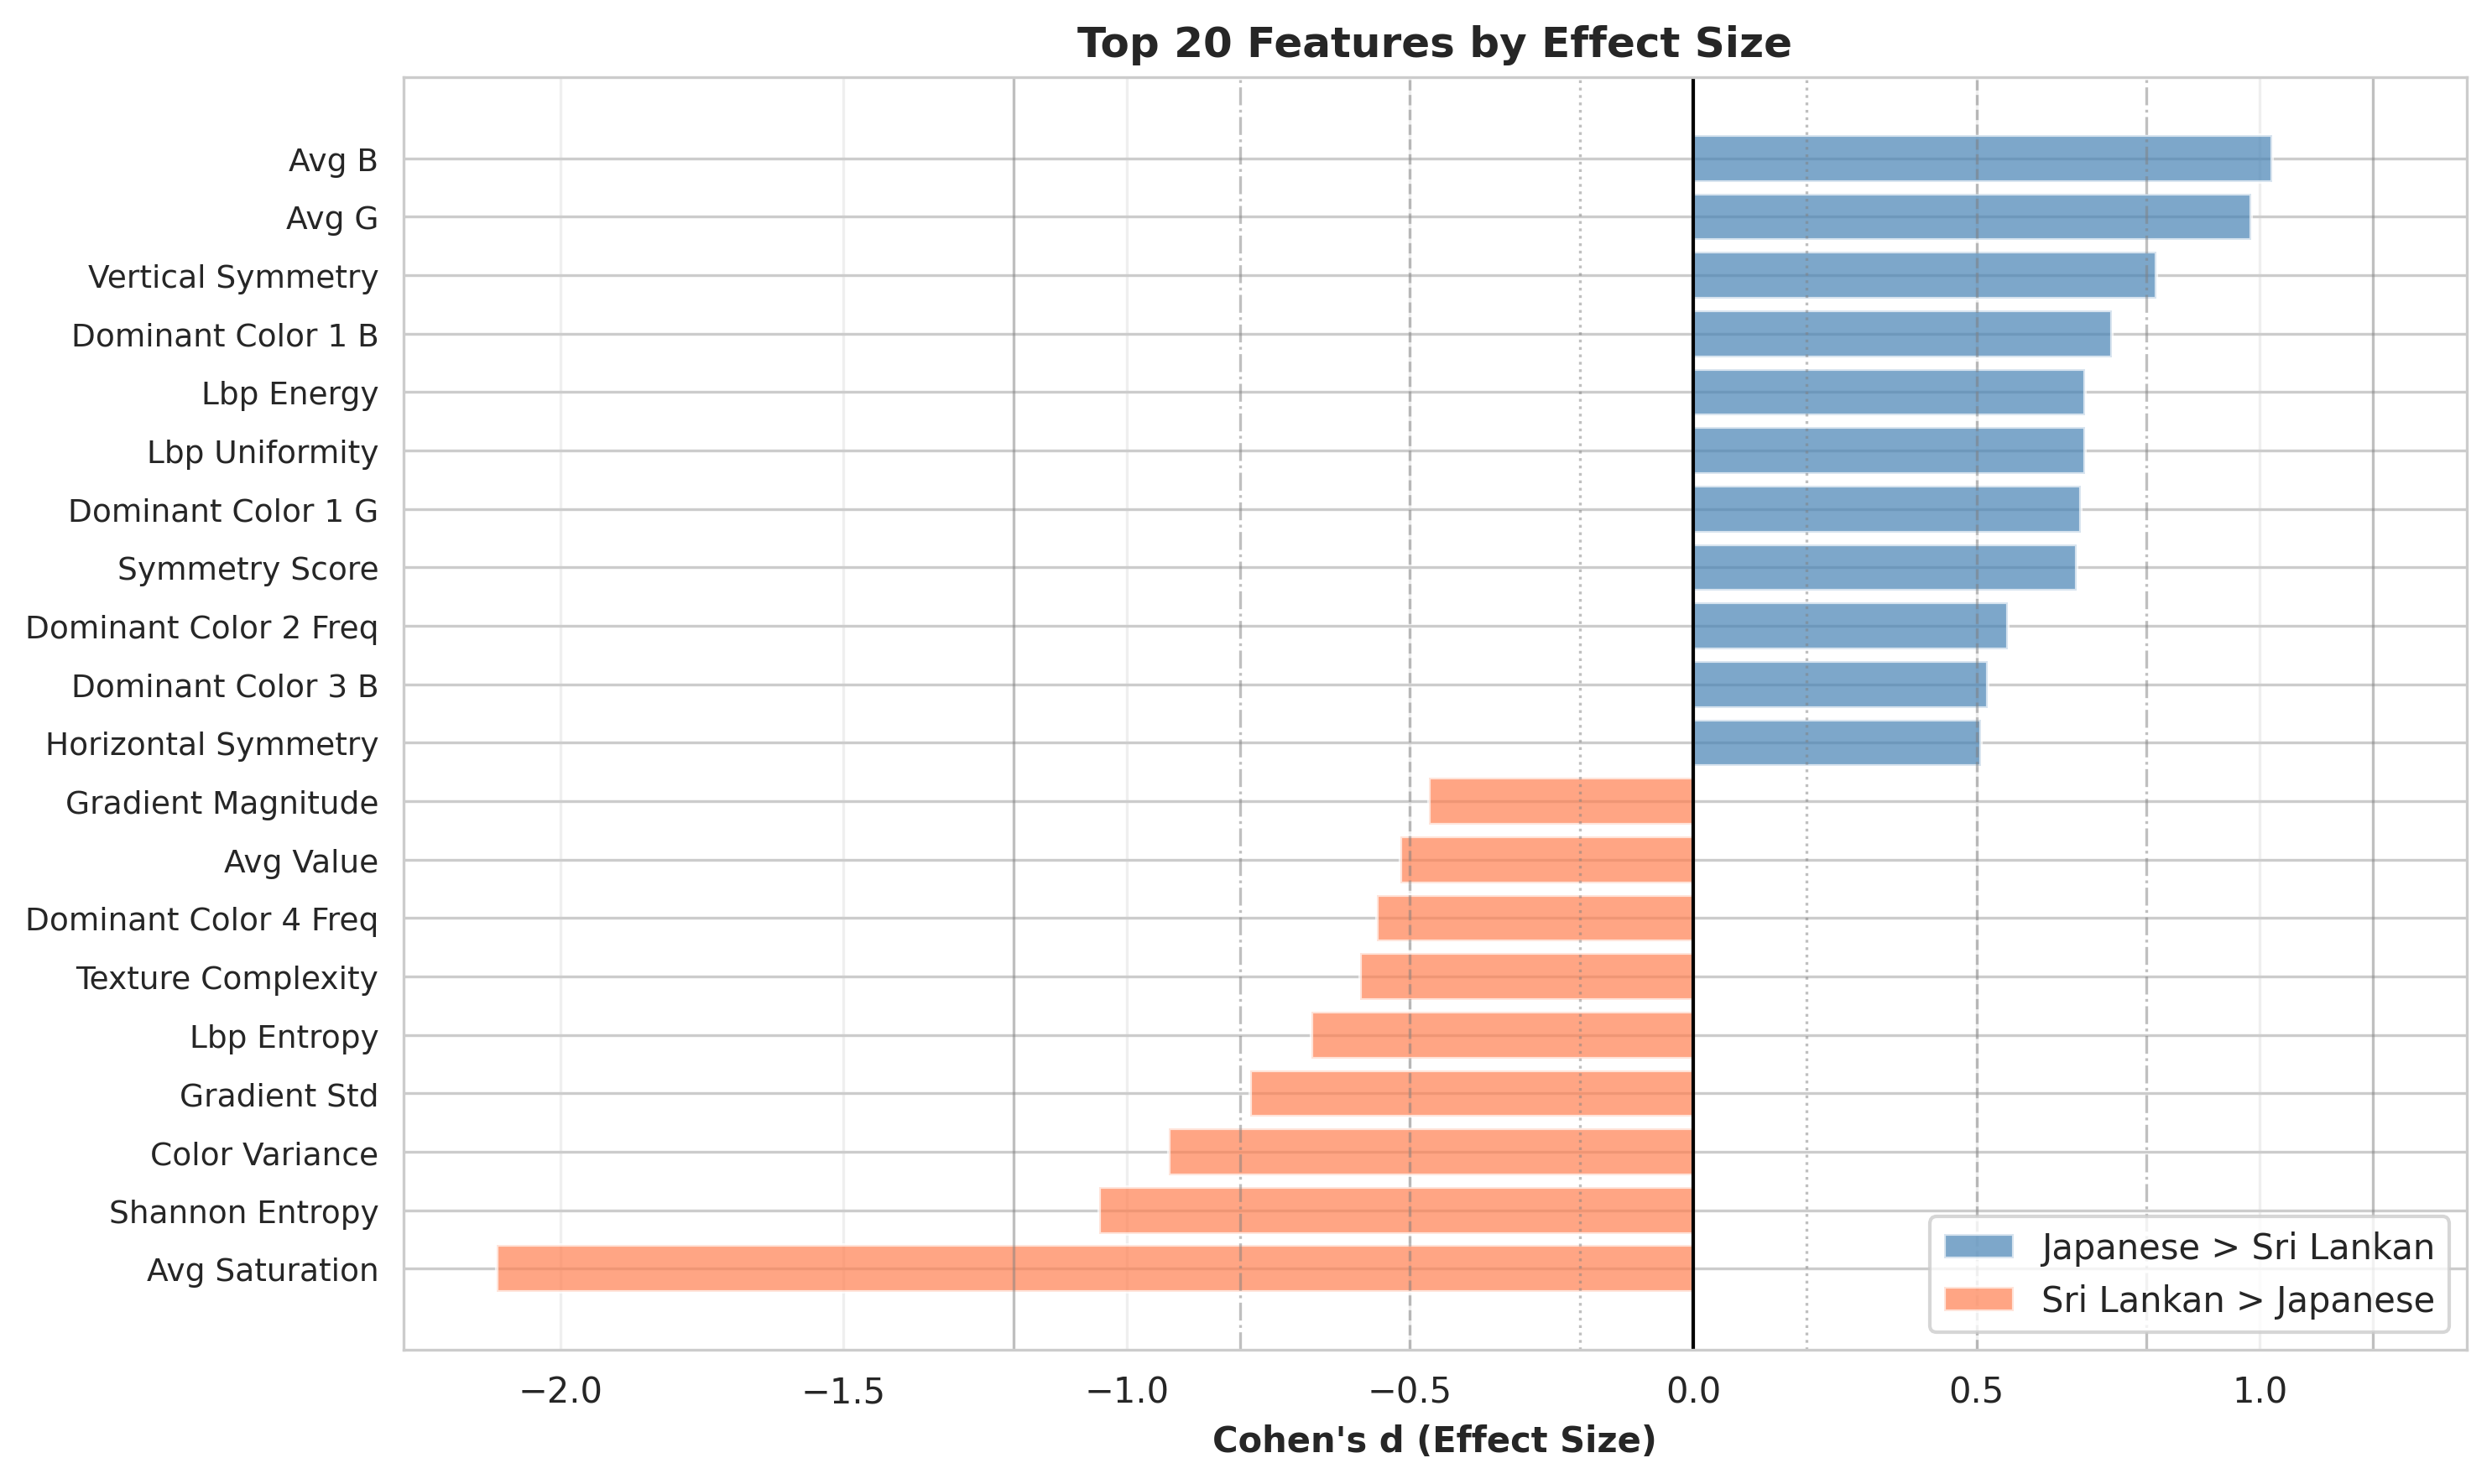 |
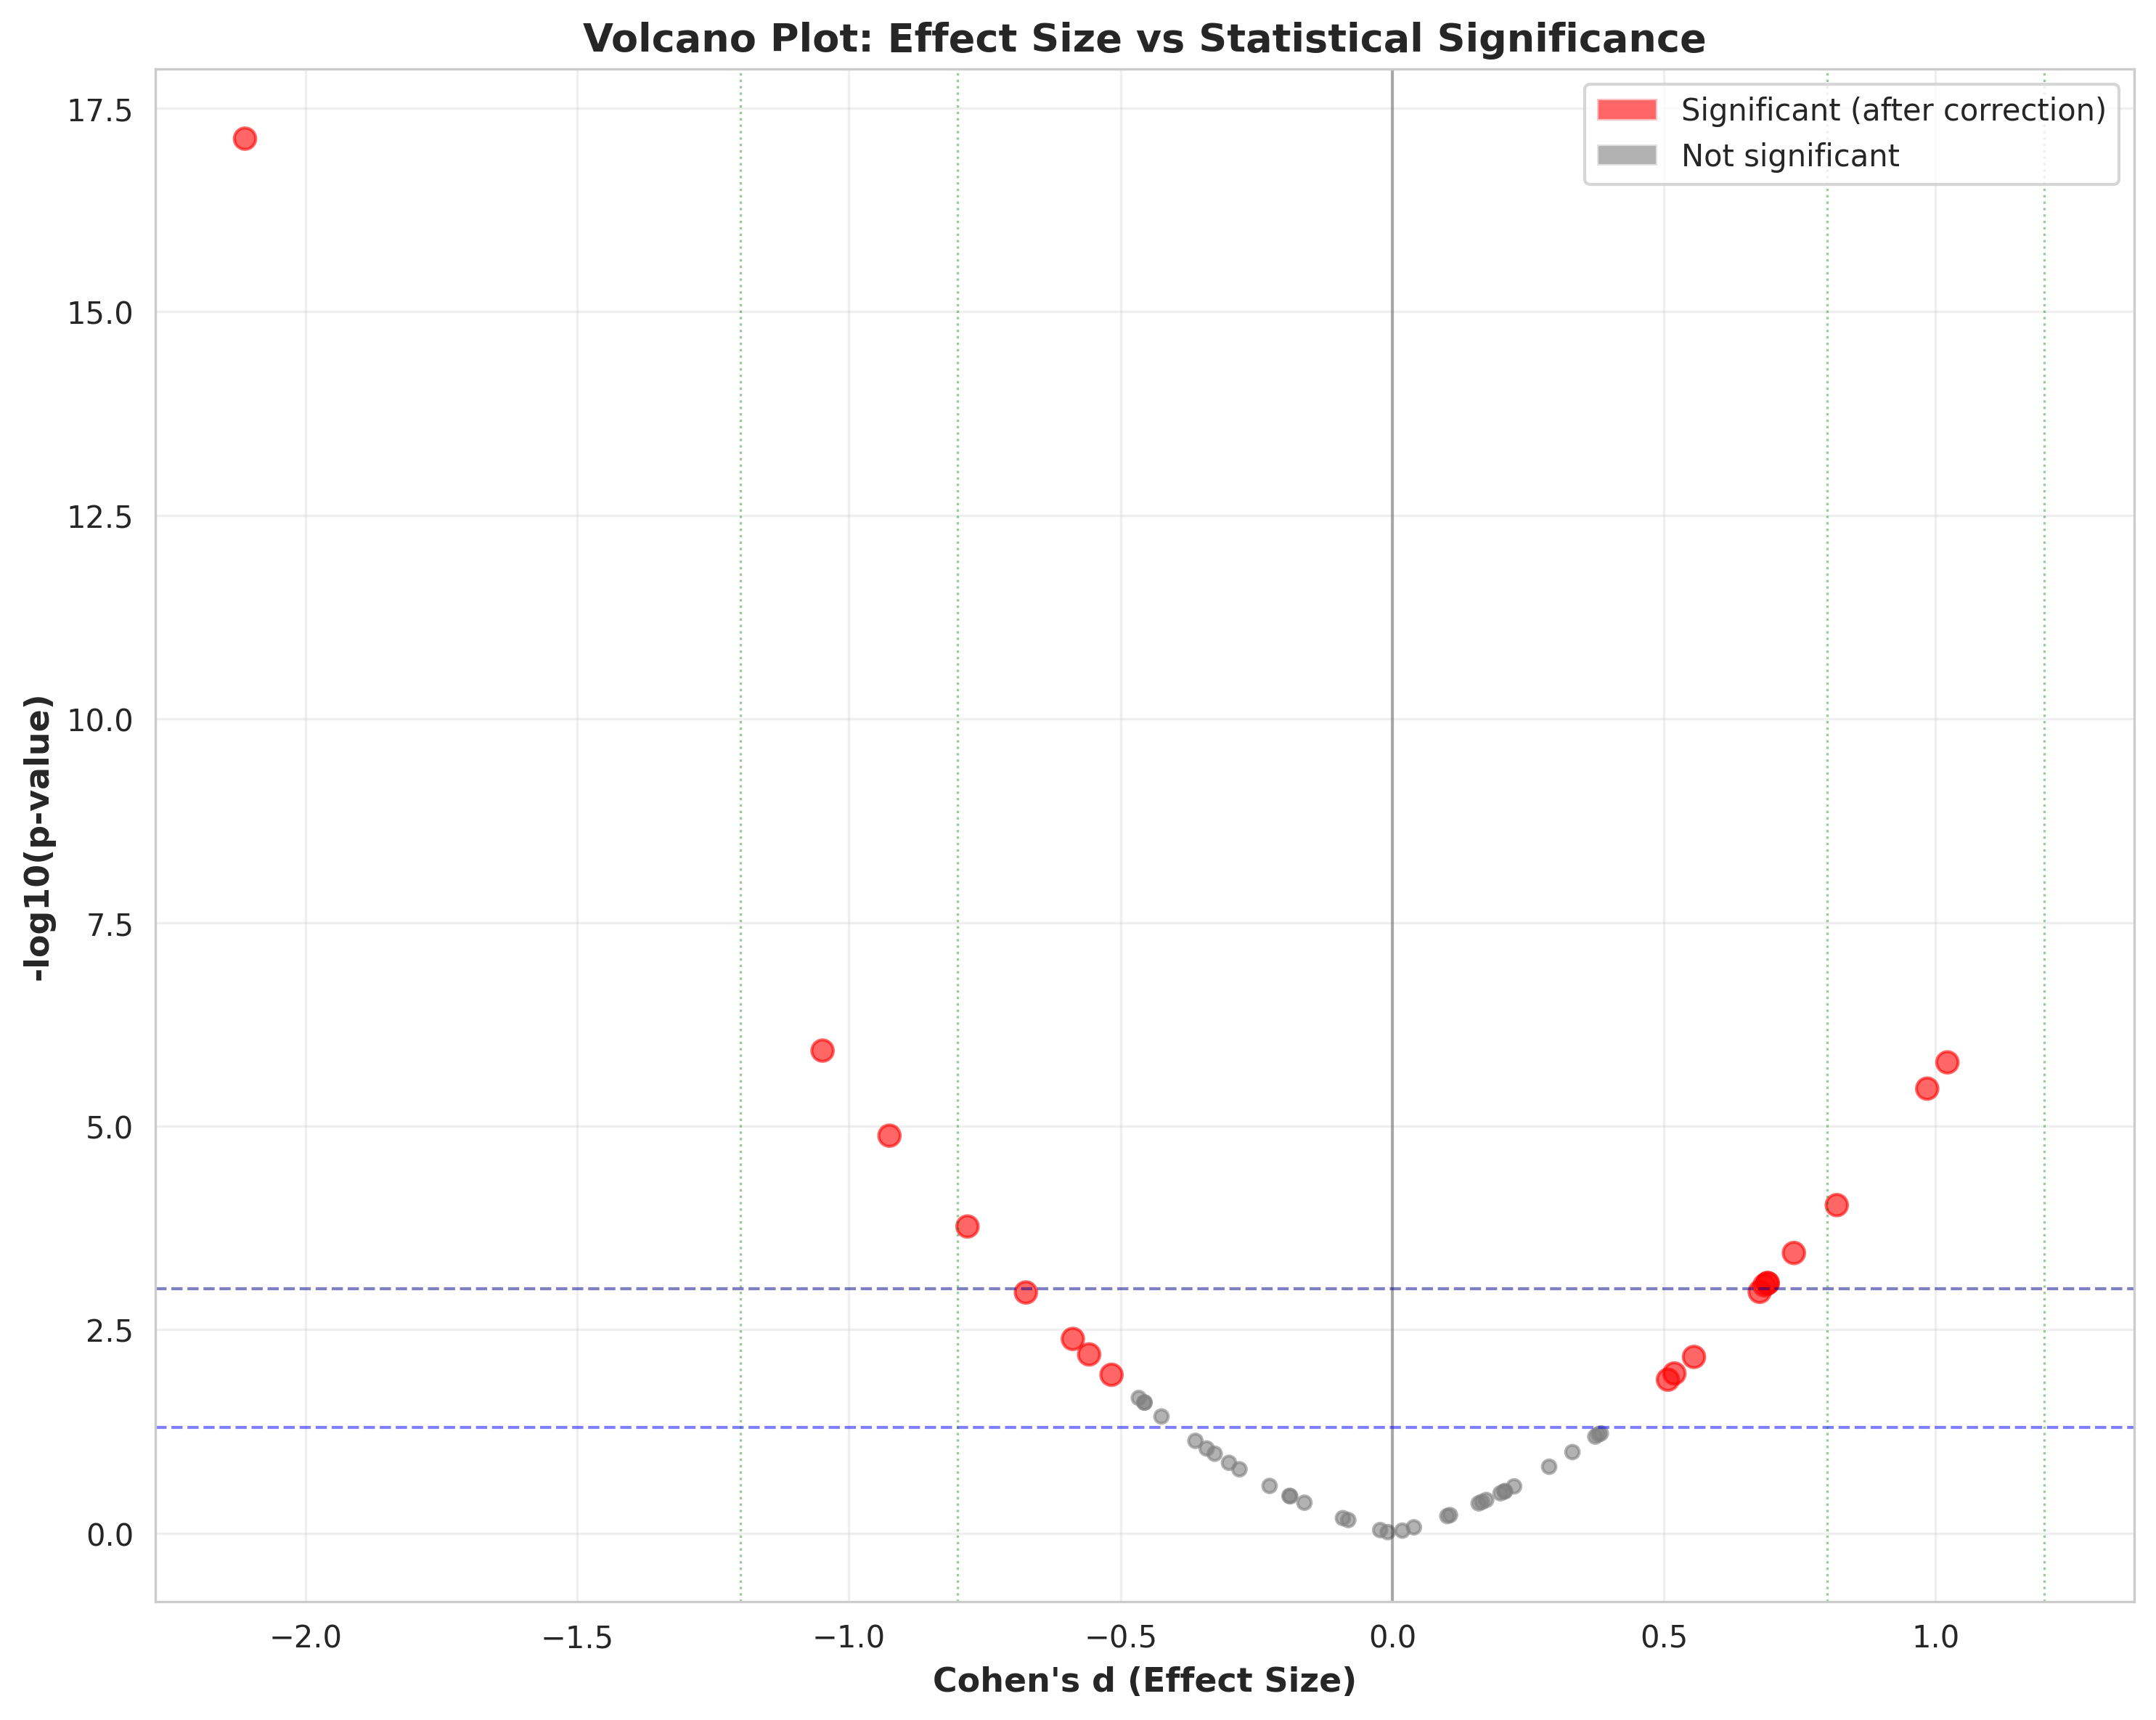
Volcano plot — effect size vs. significance
- Author: [Ronith Rashmikara]
- Email: [ronithrashmikara@gmail.com]
- Institution: Lanka Nippon BizTech Institute (LNBTI)
- Supervisor: Mr. Mewan Jayathilake (mewan@edu.lnbti.lk)
- Lanka Nippon BizTech Institute (LNBTI) for institutional support
- Mr. Mewan Jayathilake for research supervision
- Public textile archives and cultural documentation platforms
- Kaggle platform for dataset hosting
This research code is released under the MIT License. See LICENSE file for details.
The dataset contains images from public archives and cultural documentation platforms. Please respect copyright and usage terms for individual images.
- Dataset: https://www.kaggle.com/datasets/ronithrr/jasper-japanese-x-sri-lankan-textile-image-dataset
- Paper: [to be updated]
- GitHub: https://github.com/InfiniteBloom-max/Jasper
Built with Python, OpenCV, scikit-learn, and dedication to preserving cultural heritage through computational analysis.