This is the python code that I learned during BISC 450C
In this lesson we learned the how to utilize jupiter notebooks and python using data from the future500.
%matplotlib inline
import pandas as pd
import matplotlib.pyplot as plt
import seaborn as sns
sns.set(style = "darkgrid")
df = pd.read_csv('/home/student/Desktop/classroom/myfiles/notebooks/fortune500.csv')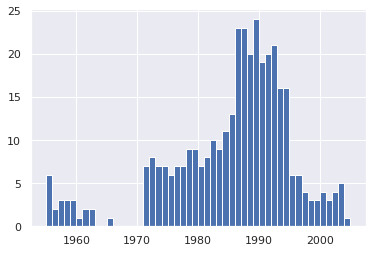df.head()| Year | Rank | Company | Revenue (in millions) | Profit (in millions) | |
|---|---|---|---|---|---|
| 0 | 1955 | 1 | General Motors | 9823.5 | 806 |
| 1 | 1955 | 2 | Exxon Mobil | 5661.4 | 584.8 |
| 2 | 1955 | 3 | U.S. Steel | 3250.4 | 195.4 |
| 3 | 1955 | 4 | General Electric | 2959.1 | 212.6 |
| 4 | 1955 | 5 | Esmark | 2510.8 | 19.1 |
df. tail()| Year | Rank | Company | Revenue (in millions) | Profit (in millions) | |
|---|---|---|---|---|---|
| 25495 | 2005 | 496 | Wm. Wrigley Jr. | 3648.6 | 493 |
| 25496 | 2005 | 497 | Peabody Energy | 3631.6 | 175.4 |
| 25497 | 2005 | 498 | Wendy's International | 3630.4 | 57.8 |
| 25498 | 2005 | 499 | Kindred Healthcare | 3616.6 | 70.6 |
| 25499 | 2005 | 500 | Cincinnati Financial | 3614.0 | 584 |
df. columns = ['year', 'rank', 'company', 'revenue', 'profit']df.head()| year | rank | company | revenue | profit | |
|---|---|---|---|---|---|
| 0 | 1955 | 1 | General Motors | 9823.5 | 806 |
| 1 | 1955 | 2 | Exxon Mobil | 5661.4 | 584.8 |
| 2 | 1955 | 3 | U.S. Steel | 3250.4 | 195.4 |
| 3 | 1955 | 4 | General Electric | 2959.1 | 212.6 |
| 4 | 1955 | 5 | Esmark | 2510.8 | 19.1 |
len(df)25500
df.dtypesyear int64
rank int64
company object
revenue float64
profit object
dtype: object
non_numeric_profits = df.profit.str.contains('[^0-9.-]')
df.loc[non_numeric_profits].head()| year | rank | company | revenue | profit | |
|---|---|---|---|---|---|
| 228 | 1955 | 229 | Norton | 135.0 | N.A. |
| 290 | 1955 | 291 | Schlitz Brewing | 100.0 | N.A. |
| 294 | 1955 | 295 | Pacific Vegetable Oil | 97.9 | N.A. |
| 296 | 1955 | 297 | Liebmann Breweries | 96.0 | N.A. |
| 352 | 1955 | 353 | Minneapolis-Moline | 77.4 | N.A. |
set(df.profit[non_numeric_profits]){'N.A.'}
len(df.profit[non_numeric_profits])369
bin_sizes,_, _ = plt.hist(df.year[non_numeric_profits], bins= range(1955, 2006))
df = df.loc[~non_numeric_profits]
df.profit = df.profit.apply(pd.to_numeric)len(df)25131
df.dtypesyear int64
rank int64
company object
revenue float64
profit float64
dtype: object
group_by_year = df.loc[:, ['year', 'revenue', 'profit']].groupby('year')
avgs = group_by_year.mean()
x = avgs.index
y1 = avgs.profit
def plot(x, y, ax, title, y_label):
    ax.set_title(title)
    ax.set_ylabel(y_label)
    ax.plot(x, y)
ax.margins(x = 0, y = 0)fig, ax = plt.subplots()
plot(x, y1, ax, 'Increase in mean Fortune 500 company profits from 1955 to 2005', 'Profits (millions)')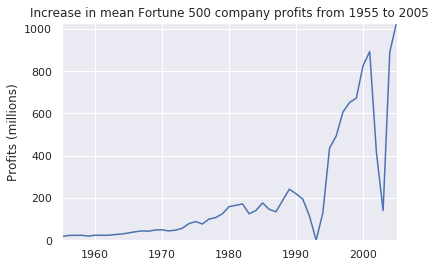
y2 = avgs.revenue
fig, ax = plt.subplots()
plot(x, y2, ax, 'Increase in mean Fortune 500 company revenues from 1955 to 2005', 'Revenue (millions)')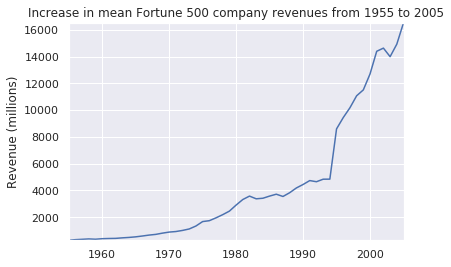
def plot_with_std(x, y, stds, ax, title, y_label):
    ax.fill_between(x, y - stds, y + stds, alpha = 0.2)
    plot(x, y, ax, title, y_label)
fig, (ax1, ax2) = plt.subplots(ncols= 2)
title = 'Increase in mean and std fortune 500 company %s from 1955 to 2005'
stds1 = group_by_year.std().profit.values
stds2 = group_by_year.std().revenue.values
plot_with_std(x, y1.values, stds1, ax1, title % 'profits', 'Profit (millions)')
plot_with_std(x, y2.values, stds2, ax2, title % 'revenues', 'Revenue,(millions)')
fig.set_size_inches(14,4)
fig. tight_layout()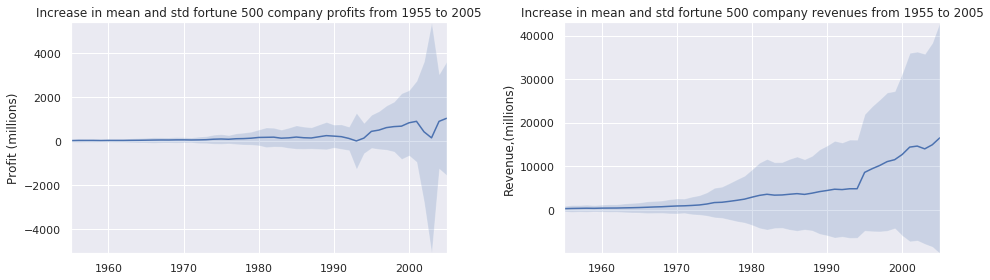
In this lesson we learned the basics of Python.
# Any python interpreter can be used as a calculator:
3 + 5 * 4
23
# Lets save a value to a variable
weight_kg = 60print(weight_kg)60
# Weight0 = valid
# 0weight = invalid
# weight and Weight are different
# Types of data
# There are three common types of data
# Interger numbers
# floating point numbers
# Strings# Floating point number
weight_kg = 60.3# Sting comprised of Letters
patient_name = "Jon Smith"# String comprised of numbers
patient_id = '001'# Use variables in python
weight_lb = 2.2 * weight_kg
print(weight_lb)132.66
# Lets add a prefix to our patient id

patient_id = 'inflam_' + patient_id

print(patient_id)
inflam_001
# Lets combine print statements

print(patient_id, 'weight in kilograms:', weight_kg)
inflam_001 weight in kilograms: 60.3
# we can call a function inside another function

print(type(60.3))

print(type(patient_id))
<class 'float'>
<class 'str'>
# We cna also do calculations inside ther print function

print('weight in lbs:', 2.2 * weight_kg)
weight in lbs: 132.66
print(weight_kg)60.3
weight_kg = 65.0
print('weight in kilograms is now:', weight_kg)
weight in kilograms is now: 65.0
In this lesson we looked at inflammation data for multiple patients.
import numpynumpy.loadtxt(fname = 'inflammation-01.csv')---------------------------------------------------------------------------
OSError Traceback (most recent call last)
<ipython-input-3-5f46471d8a56> in <module>
----> 1 numpy.loadtxt(fname = 'inflammation-01.csv')
~/anaconda3/lib/python3.7/site-packages/numpy/lib/npyio.py in loadtxt(fname, dtype, comments, delimiter, converters, skiprows, usecols, unpack, ndmin, encoding, max_rows)
966 fname = os_fspath(fname)
967 if _is_string_like(fname):
--> 968 fh = np.lib._datasource.open(fname, 'rt', encoding=encoding)
969 fencoding = getattr(fh, 'encoding', 'latin1')
970 fh = iter(fh)
~/anaconda3/lib/python3.7/site-packages/numpy/lib/_datasource.py in open(path, mode, destpath, encoding, newline)
267
268 ds = DataSource(destpath)
--> 269 return ds.open(path, mode, encoding=encoding, newline=newline)
270
271
~/anaconda3/lib/python3.7/site-packages/numpy/lib/_datasource.py in open(self, path, mode, encoding, newline)
621 encoding=encoding, newline=newline)
622 else:
--> 623 raise IOError("%s not found." % path)
624
625
OSError: inflammation-01.csv not found.
import numpynumpy.loadtxt(fname = 'inflammation-01.csv', delimiter = ',')array([[0., 0., 1., ..., 3., 0., 0.],
[0., 1., 2., ..., 1., 0., 1.],
[0., 1., 1., ..., 2., 1., 1.],
...,
[0., 1., 1., ..., 1., 1., 1.],
[0., 0., 0., ..., 0., 2., 0.],
[0., 0., 1., ..., 1., 1., 0.]])
numpy.loadtxt(fname = 'inflammation-01.csv', delimiter = ',')array([[0., 0., 1., ..., 3., 0., 0.],
[0., 1., 2., ..., 1., 0., 1.],
[0., 1., 1., ..., 2., 1., 1.],
...,
[0., 1., 1., ..., 1., 1., 1.],
[0., 0., 0., ..., 0., 2., 0.],
[0., 0., 1., ..., 1., 1., 0.]])
data = numpy.loadtxt(fname = 'inflammation-01.csv', delimiter = ',')print(data)[[0. 0. 1. ... 3. 0. 0.]
[0. 1. 2. ... 1. 0. 1.]
[0. 1. 1. ... 2. 1. 1.]
...
[0. 1. 1. ... 1. 1. 1.]
[0. 0. 0. ... 0. 2. 0.]
[0. 0. 1. ... 1. 1. 0.]]
print(type(data))<class 'numpy.ndarray'>
print(data.shape)(60, 40)
print('firt value in data:', data[0,0])firt value in data: 0.0
print('middle value in data:', data[29, 19])middle value in data: 16.0
print(data[0:4, 0:10])[[0. 0. 1. 3. 1. 2. 4. 7. 8. 3.]
[0. 1. 2. 1. 2. 1. 3. 2. 2. 6.]
[0. 1. 1. 3. 3. 2. 6. 2. 5. 9.]
[0. 0. 2. 0. 4. 2. 2. 1. 6. 7.]]
print(data[5:10, 0:10])[[0. 0. 1. 2. 2. 4. 2. 1. 6. 4.]
[0. 0. 2. 2. 4. 2. 2. 5. 5. 8.]
[0. 0. 1. 2. 3. 1. 2. 3. 5. 3.]
[0. 0. 0. 3. 1. 5. 6. 5. 5. 8.]
[0. 1. 1. 2. 1. 3. 5. 3. 5. 8.]]
small = data[:3, 36:]print('small is:')small is:
print(small)[[2. 3. 0. 0.]
[1. 1. 0. 1.]
[2. 2. 1. 1.]]
# Lets us a numpy function
print(numpy.mean(data))
6.14875
maxval, minval, stdval = numpy.amax(data), numpy.amin(data), numpy.std(data)print(maxval)
print(minval)
print(stdval)20.0
0.0
4.613833197118566
maxval = numpy.amax(data)
minval = numpy.amin(data)
stdval = numpy.std(data)print(maxval)
print(minval)
print(stdval)20.0
0.0
4.613833197118566
print('maximum inflammation:', maxval)
print('minimum inflammation:', minval)
print('standard deviation:', stdval)
maximum inflammation: 20.0
minimum inflammation: 0.0
standard deviation: 4.613833197118566
# Sometimes we want to look at variation in statistical values, such as maximum inflammation per patient, or avaerage from day one.

patient_0 = data[0, :] # 0 on the first axis (rows), everything on the second (columns)

print('maximum inflammation for patient 0:', numpy.amax(patient_0))
maximum inflammation for patient 0: 18.0
print('maximum inflammation for patient 2:', numpy.amax(data[2, :]))maximum inflammation for patient 2: 19.0
print(numpy.mean(data, axis = 0))[ 0. 0.45 1.11666667 1.75 2.43333333 3.15
3.8 3.88333333 5.23333333 5.51666667 5.95 5.9
8.35 7.73333333 8.36666667 9.5 9.58333333 10.63333333
11.56666667 12.35 13.25 11.96666667 11.03333333 10.16666667
10. 8.66666667 9.15 7.25 7.33333333 6.58333333
6.06666667 5.95 5.11666667 3.6 3.3 3.56666667
2.48333333 1.5 1.13333333 0.56666667]
print(numpy.mean(data, axis = 0).shape)(40,)
print(numpy.mean(data, axis = 1))[5.45 5.425 6.1 5.9 5.55 6.225 5.975 6.65 6.625 6.525 6.775 5.8
6.225 5.75 5.225 6.3 6.55 5.7 5.85 6.55 5.775 5.825 6.175 6.1
5.8 6.425 6.05 6.025 6.175 6.55 6.175 6.35 6.725 6.125 7.075 5.725
5.925 6.15 6.075 5.75 5.975 5.725 6.3 5.9 6.75 5.925 7.225 6.15
5.95 6.275 5.7 6.1 6.825 5.975 6.725 5.7 6.25 6.4 7.05 5.9 ]
import numpy
data = numpy.loadtxt(fname= 'inflammation-01.csv', delimiter = ',')
import matplotlib.pyplot
image = matplotlib.pyplot.imshow(data)
matplotlib.pyplot.show()<Figure size 640x480 with 1 Axes>
# Average inflammation over time

ave_inflammation = numpy.mean(data, axis = 0)
ave_plot = matplotlib.pyplot.plot(ave_inflammation)
matplotlib.pyplot.show()
max_plot = matplotlib.pyplot.plot(numpy.amax(data, axis = 0))
matplotlib.pyplot.show()
min_plot = matplotlib.pyplot.plot(numpy.amin(data, axis = 0))
matplotlib.pyplot.show()
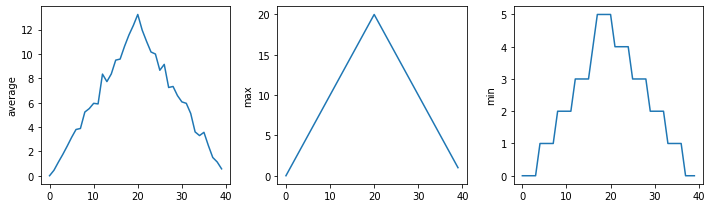
fig = matplotlib.pyplot.figure(figsize =(10.0, 3.0))

axes1 = fig.add_subplot(1, 3, 1)
axes2 = fig.add_subplot(1, 3, 2)
axes3 = fig.add_subplot(1, 3, 3)

axes1.set_ylabel('average')
axes1.plot(numpy.mean(data, axis = 0))

axes2.set_ylabel('max')
axes2.plot(numpy.amax(data, axis = 0))

axes3.set_ylabel('min')
axes3.plot(numpy.amin(data, axis = 0))

fig.tight_layout()

matplotlib.pyplot.savefig('inflammation.png')
matplotlib.pyplot.show()
In this lesson we learned how to utilize list in python.
odds = [1, 3, 5, 7]
print('odds are:', odds)
odds are: [1, 3, 5, 7]
print('first element:', odds[0])
print('last element:', odds[3])
print('"-1" element:', odds[-1])
first element: 1
last element: 7
"-1" element: 7
names = ['Curie', 'Darwing', 'Turing'] # Typo in Darwin's name

print('names is originally:', names)

names[1] = 'Darwin' # Correct the name

print('final value of names:', names)
names is originally: ['Curie', 'Darwing', 'Turing']
final value of names: ['Curie', 'Darwin', 'Turing']
#name  = 'Darwin'
#name[0] = 'd'odds.append(11)
print('odds after adding a value:', odds)odds after adding a value: [1, 3, 5, 7, 11]
removed_element = odds.pop(0)
print('odds after removing the first element:', odds)
print('removed_element:', removed_element)
odds after removing the first element: [3, 5, 7, 11]
removed_element: 1
odds.reverse()
print('odds after reversing:', odds)
odds after reversing: [11, 7, 5, 3]
odds = [3,5,7]
primes = odds
primes.append(2)
print('primes:',primes)
print('odds:', odds)
primes: [3, 5, 7, 2]
odds: [3, 5, 7, 2]
odds = [3,5,7]
primes = list(odds)
primes.append(2)
print('primes:', primes)
print('odds:', odds)
primes: [3, 5, 7, 2]
odds: [3, 5, 7]
binomial_name = "Drosphila melanogaster"
group = binomial_name[0:10]
print('group:', group)

species = binomial_name[11:23]
print('species:', species)

chromosomes = ['X', 'Y', '2', '3', '4']
autosomes = chromosomes[2:5]
print('autosomes:', autosomes)

last = chromosomes[-1]
print('last:', last)
group: Drosphila
species: elanogaster
autosomes: ['2', '3', '4']
last: 4
date = 'Monday 4 January 2023'
day = date[0:6]
print('Using 0 to begin range:', day)
day = date[:6]
print('Omitting beginning index:', day)
Using 0 to begin range: Monday
Omitting beginning index: Monday
months = ['jan', 'feb', 'mar', 'apr', 'may', 'jun', 'jul', 'aug', 'sep', 'oct', 'nov', 'dec']
sond = months[8:12]
print('With know last position:', sond)

sond = months[8:len(months)]
print('Using len() to get last entry:', sond)

sond = months[8:]
print('Omitting ending index:', sond)
With know last position: ['sep', 'oct', 'nov', 'dec']
Using len() to get last entry: ['sep', 'oct', 'nov', 'dec']
Omitting ending index: ['sep', 'oct', 'nov', 'dec']
In this lesson we learned how to use loops in python.
odds = [1,3,5,7]print(odds[0])
print(odds[1])
print(odds[2])
print(odds[3])1
3
5
7
odds = [1,3,5]
print(odds[0])
print(odds[1])
print(odds[2])
print(odds[3])
1
3
5
---------------------------------------------------------------------------
IndexError Traceback (most recent call last)
<ipython-input-3-01ba67d8a9e5> in <module>
3 print(odds[1])
4 print(odds[2])
----> 5 print(odds[3])
IndexError: list index out of range
odds = [1, 3, 5, 7, 9, 11, 13, 15, 17, 19]
for num in odds:
    print(num)
1
3
5
7
9
11
13
15
17
19
lenght = 0
names = ['Curie', 'Darwin', 'Turing']
for value in names:
    lenght = lenght + 1
print('There are', lenght, 'names in the list.')
There are 3 names in the list.
name = "Rosalind"
for name in ['Curie', 'Darwin', 'Turing']:
    print(name)
print('after the loop, name is', name)
Curie
Darwin
Turing
after the loop, name is Turing
print(len([0,1,2,3]))4
name = ['Curie', 'Dawin', 'Turing']

print(len(name))
3
In this lesson we learned how to analyze data from multiple files.
import globprint(glob.glob('inflammation*.csv'))['inflammation-05.csv', 'inflammation-12.csv', 'inflammation-04.csv', 'inflammation-08.csv', 'inflammation-10.csv', 'inflammation-06.csv', 'inflammation-09.csv', 'inflammation-01.csv', 'inflammation-07.csv', 'inflammation-11.csv', 'inflammation-03.csv', 'inflammation-02.csv']
import glob
import numpy
import matplotlib.pyplot

filenames = sorted(glob.glob('inflammation*.csv'))
filenames = filenames[0:3]

for filename in filenames:
    print(filename)

    data = numpy.loadtxt(fname=filename, delimiter = ',')

    fig = matplotlib.pyplot.figure(figsize = (10.0, 3.0))

    axes1 = fig.add_subplot(1,3,1)
    axes2 = fig.add_subplot(1,3,2)
    axes3 = fig.add_subplot(1,3,3)

    axes1.set_ylabel('average')
    axes1.plot(numpy.mean(data, axis = 0))

    axes2.set_ylabel('max')
    axes2.plot(numpy.amax(data, axis = 0))

    axes3.set_ylabel('min')
    axes3.plot(numpy.amin(data, axis = 0))

    fig.tight_layout()
    matplotlib.pyplot.show()
inflammation-01.csv
inflammation-02.csv
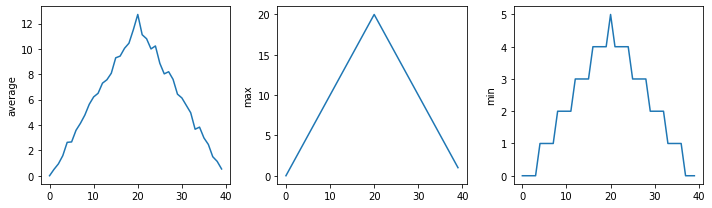
inflammation-03.csv
In this lesson we learned how to leverage python into making choices for us.
num = 37
if num > 100:
    print('greater')
else:
    print('not greater')
print('done')
not greater
done
num = 53
print('before conditional...')
if num > 100:
    print(num, 'is greater than 100')
print('...after conditional')
before conditional...
...after conditional
num = 14

if num > 0:
    print(num, 'is positive')
elif num == 0:
    print(num, 'is zero')
else:
    print(num, 'is negative')
14 is positive
if (1 > 0) and (-1 >=0):
    print('both parts are true')
else:
    print('at least one part if flase')
at least one part if flase
if (1 > 0) or (-1 >= 0):
    print('at least one part is true')
else:
    print('both of these are false')
at least one part is true
import numpy data = numpy.loadtxt(fname='inflammation-01.csv', delimiter=',')max_inflammation_0 = numpy.amax(data, axis=0)[0]max_inflammation_20 = numpy.amax(data, axis = 0)[20]
if max_inflammation_0 == 0 and max_inflammation_20 == 20:
print('Saspitious looxing maxima!')
elif numpy.sum(numpy.amin(data, axis=0)) == 0:
print('Minima add up to zero!')
else:
print('Seems OK!')Saspitious looxing maxima!
data = numpy.loadtxt(fname = 'inflammation-03.csv', delimiter=',')

max_inflammation_0 = numpy.amax(data, axis = 0)[0]

max_inflammation_20 = numpy.amax(data, axis = 0)[20]

if max_inflammation_0 == 0 and max_inflammation_20 == 20:
    print('Suspicious looking maxima!')
elif numpy.sum(numpy.amin(data, axis=0)) == 0:
    print('Minima add up to zero! -> HEALTHY PARTICIPANT ALERT!')
else:
    print('Seems OK!')
Minima add up to zero! -> HEALTHY PARTICIPANT ALERT!
In these lessons we learned how to create and use functions in python.
fahrenheit_val = 99
celsius_val = ((fahrenheit_val - 32 ) *(5/9))

print(celsius_val)
37.22222222222222
fahrenheit_val2 = 43
celsius_val2 = ((fahrenheit_val2 - 32) * (5/9))

print(celsius_val2)
6.111111111111112
def explicit_fahr_to_celsius(temp):
    # Assign the converted value to a variable
    converted = ((temp - 32) * (5/9))
    # Return the values of the new variable
    return converted
def fahr_to_celsius(temp):
# Return converted values more effectiently using the return function without creating
# a new variable. This code does the same thing as the previous function but it is more
# explicit in explaining how the return command works.
return ((temp - 32) * (5/9))fahr_to_celsius(32)0.0
explicit_fahr_to_celsius(32)0.0
print('Freezing point of water:', fahr_to_celsius(32), 'C')
print('Boiling point of water:', fahr_to_celsius(212), 'C')
Freezing point of water: 0.0 C
Boiling point of water: 100.0 C
def celsius_to_kelvin(temp_c):
    return temp_c + 273.15

print('freezing point of water in Kelvin:', celsius_to_kelvin(0.))
freezing point of water in Kelvin: 273.15
def fahr_to_kelvin(temp_f):
    temp_c = fahr_to_celsius(temp_f)
    temp_k = celsius_to_kelvin(temp_c)
    return temp_k
print('boiling point of water in Kelvin:', fahr_to_kelvin(212.0))
boiling point of water in Kelvin: 373.15
print('Again, temoerature in Kelving was:', temp_k)---------------------------------------------------------------------------
NameError Traceback (most recent call last)
<ipython-input-14-74165208b75d> in <module>
----> 1 print('Again, temoerature in Kelving was:', temp_k)
NameError: name 'temp_k' is not defined
temp_kelving = fahr_to_kelvin(212.0)
print('Temperature in Kelvin was:', temp_kelving)
Temperature in Kelvin was: 373.15
temp_kelving373.15
def print_temperatures():
    print('Temperature in Fahrenheit was:', temp_fahr)
    print('Temperature in kelvin was:', temp_kelvin)

temp_fahr = 212.0
temp_kelvin = fahr_to_kelvin(temp_fahr)

print_temperatures()
Temperature in Fahrenheit was: 212.0
Temperature in kelvin was: 373.15
import numpy
import matplotlib
import matplotlib.pyplot
import glob
'freezing point of water in Kelvin:'
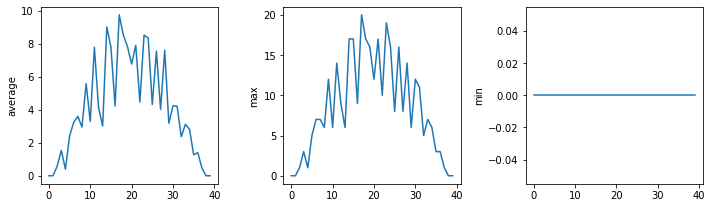
def visualize(filename):
data = numpy.loadtxt(fname = filename, delimiter = ',')
fig = matplotlib.pyplot.figure(figsize=(10.0, 3.0))
axes1 = fig.add_subplot(1, 3, 1)
axes2 = fig.add_subplot(1, 3, 2)
axes3 = fig.add_subplot(1, 3, 3)
axes1.set_ylabel('average')
axes1.plot(numpy.mean(data, axis=0))
axes2.set_ylabel('max')
axes2.plot(numpy.amax(data, axis = 0))
axes3.set_ylabel('min')
axes3.plot(numpy.amin(data, axis = 0))
fig.tight_layout()
matplotlib.pyplot.show()
def detect_problems(filename):

    data = numpy.loadtxt(fname = filename, delimiter = ',')

    if numpy.amax(data, axis = 0)[0] == 0 and numpy.amax(data, axis=0)[20] == 20:
        print("Suspicious looking maxima!")
    elif numpy.sum(numpy.amin(data, axis=0)) == 0:
        print('Minima add up to zero!')
    else:
        print('Seems ok!')
filenames = sorted(glob.glob('inflammation*.csv'))
for filename in filenames:
print(filename)
visualize(filename)
detect_problems(filename)inflammation-01.csv

Suspicious looking maxima!
inflammation-02.csv

Suspicious looking maxima!
inflammation-03.csv

Minima add up to zero!
inflammation-04.csv

Suspicious looking maxima!
inflammation-05.csv

Suspicious looking maxima!
inflammation-06.csv

Suspicious looking maxima!
inflammation-07.csv

Suspicious looking maxima!
inflammation-08.csv

Minima add up to zero!
inflammation-09.csv

Suspicious looking maxima!
inflammation-10.csv

Suspicious looking maxima!
inflammation-11.csv

Minima add up to zero!
inflammation-12.csv

Suspicious looking maxima!
def offset_mean(data, target_mean_value):
    return(data - numpy.mean(data)) + target_mean_value
z = numpy.zeros((2,2))
print(offset_mean(z, 3))[[3. 3.]
[3. 3.]]
data = numpy.loadtxt(fname = 'inflammation-01.csv', delimiter = ',')

print(offset_mean(data, 0))
[[-6.14875 -6.14875 -5.14875 ... -3.14875 -6.14875 -6.14875]
[-6.14875 -5.14875 -4.14875 ... -5.14875 -6.14875 -5.14875]
[-6.14875 -5.14875 -5.14875 ... -4.14875 -5.14875 -5.14875]
...
[-6.14875 -5.14875 -5.14875 ... -5.14875 -5.14875 -5.14875]
[-6.14875 -6.14875 -6.14875 ... -6.14875 -4.14875 -6.14875]
[-6.14875 -6.14875 -5.14875 ... -5.14875 -5.14875 -6.14875]]
print('original min, mean and max are:', numpy.amin(data), numpy.mean(data), numpy.amax(data))
offset_data = offset_mean(data, 0)
print('min, mean, and max of offset data are:',
     numpy.amin(offset_data),
     numpy.mean(offset_data),
      numpy.amax(offset_data))
original min, mean and max are: 0.0 6.14875 20.0
min, mean, and max of offset data are: -6.14875 2.842170943040401e-16 13.85125
print('std dev before and after:', numpy.std(data), numpy.std(offset_data))std dev before and after: 4.613833197118566 4.613833197118566
print('difference in dtandard deviation before and after:',
     numpy.std(data) - numpy.std(offset_data))
difference in dtandard deviation before and after: 0.0
# offset_mean(data, target_mean_value):
# return a new array containing the original data with its mean offset to match teh desired value.
# This data should be imputed as a measurements in columns and samples in rows

def offset_mean(data, target_mean_value):
    return(data - numpy.mean(data)) + target_mean_value
def offset_mean(data, target_mean_value):
"""Return a new array containing the original datra with its mean offfset to match the desired value"""
return(data - numpy.mean(data)) + target_mean_valuehelp(offset_mean)Help on function offset_mean in module __main__:
offset_mean(data, target_mean_value)
Return a new array containing the original datra with its mean offfset to match the desired value
def offset_mean(data, target_mean_value):
    """Return a new array containing the original data
    with its mean offset to match the desired value.

    Examples
    ----------

    >>> Offset_mean([1,2,3], 0)
    array([-1., 0., 1.])
    """

return(data - numpy.mean(data)) + traget_mean_valuehelp(offset_mean)Help on function offset_mean in module __main__:
offset_mean(data, target_mean_value)
Return a new array containing the original data
with its mean offset to match the desired value.
Examples
----------
>>> Offset_mean([1,2,3], 0)
array([-1., 0., 1.])
numpy.loadtxt('inflammation-01.csv', delimiter = ',')array([[0., 0., 1., ..., 3., 0., 0.],
[0., 1., 2., ..., 1., 0., 1.],
[0., 1., 1., ..., 2., 1., 1.],
...,
[0., 1., 1., ..., 1., 1., 1.],
[0., 0., 0., ..., 0., 2., 0.],
[0., 0., 1., ..., 1., 1., 0.]])
numpy.loadtxt('inflammation-01.csv', ',')Traceback (most recent call last):
File "/home/student/anaconda3/lib/python3.7/site-packages/IPython/core/interactiveshell.py", line 3326, in run_code
exec(code_obj, self.user_global_ns, self.user_ns)
File "<ipython-input-17-d0d3ef43afeb>", line 1, in <module>
numpy.loadtxt('inflammation-01.csv', ',')
File "/home/student/anaconda3/lib/python3.7/site-packages/numpy/lib/npyio.py", line 1087, in loadtxt
dtype = np.dtype(dtype)
File "/home/student/anaconda3/lib/python3.7/site-packages/numpy/core/_internal.py", line 201, in _commastring
newitem = (dtype, eval(repeats))
File "<string>", line 1
,
^
SyntaxError: unexpected EOF while parsing
def offset_mean(data, target_mean_value = 0.0):
    """Return a new array containing the original data
    with its mean offset to match the desired value, (0 by default).

    Examples
    ----------

    >>> offset_mean([1,2,3])
    array([-1., 0., 1.])
    """

    return(data - numpy.mean(data)) + target_mean_value
test_data = numpy.zeros((2,2))
print(offset_mean(test_data, 3))[[3. 3.]
[3. 3.]]
print(offset_mean(test_data))[[0. 0.]
[0. 0.]]
def display(a=1, b=2, c=3):
    print('a:', a, 'b', b, 'c:', c)

print('no parameters:')
display()
print('one parameter:')
display(55)
print('two parameters:')
display(55,66)
no parameters:
a: 1 b 2 c: 3
one parameter:
a: 55 b 2 c: 3
two parameters:
a: 55 b 66 c: 3
print('only setting the value of c')
display(c = 77)
only setting the value of c
a: 1 b 2 c: 77
help(numpy.loadtxt)Help on function loadtxt in module numpy:
loadtxt(fname, dtype=<class 'float'>, comments='#', delimiter=None, converters=None, skiprows=0, usecols=None, unpack=False, ndmin=0, encoding='bytes', max_rows=None)
Load data from a text file.
Each row in the text file must have the same number of values.
Parameters
----------
fname : file, str, or pathlib.Path
File, filename, or generator to read. If the filename extension is
``.gz`` or ``.bz2``, the file is first decompressed. Note that
generators should return byte strings for Python 3k.
dtype : data-type, optional
Data-type of the resulting array; default: float. If this is a
structured data-type, the resulting array will be 1-dimensional, and
each row will be interpreted as an element of the array. In this
case, the number of columns used must match the number of fields in
the data-type.
comments : str or sequence of str, optional
The characters or list of characters used to indicate the start of a
comment. None implies no comments. For backwards compatibility, byte
strings will be decoded as 'latin1'. The default is '#'.
delimiter : str, optional
The string used to separate values. For backwards compatibility, byte
strings will be decoded as 'latin1'. The default is whitespace.
converters : dict, optional
A dictionary mapping column number to a function that will parse the
column string into the desired value. E.g., if column 0 is a date
string: ``converters = {0: datestr2num}``. Converters can also be
used to provide a default value for missing data (but see also
`genfromtxt`): ``converters = {3: lambda s: float(s.strip() or 0)}``.
Default: None.
skiprows : int, optional
Skip the first `skiprows` lines, including comments; default: 0.
usecols : int or sequence, optional
Which columns to read, with 0 being the first. For example,
``usecols = (1,4,5)`` will extract the 2nd, 5th and 6th columns.
The default, None, results in all columns being read.
.. versionchanged:: 1.11.0
When a single column has to be read it is possible to use
an integer instead of a tuple. E.g ``usecols = 3`` reads the
fourth column the same way as ``usecols = (3,)`` would.
unpack : bool, optional
If True, the returned array is transposed, so that arguments may be
unpacked using ``x, y, z = loadtxt(...)``. When used with a structured
data-type, arrays are returned for each field. Default is False.
ndmin : int, optional
The returned array will have at least `ndmin` dimensions.
Otherwise mono-dimensional axes will be squeezed.
Legal values: 0 (default), 1 or 2.
.. versionadded:: 1.6.0
encoding : str, optional
Encoding used to decode the inputfile. Does not apply to input streams.
The special value 'bytes' enables backward compatibility workarounds
that ensures you receive byte arrays as results if possible and passes
'latin1' encoded strings to converters. Override this value to receive
unicode arrays and pass strings as input to converters. If set to None
the system default is used. The default value is 'bytes'.
.. versionadded:: 1.14.0
max_rows : int, optional
Read `max_rows` lines of content after `skiprows` lines. The default
is to read all the lines.
.. versionadded:: 1.16.0
Returns
-------
out : ndarray
Data read from the text file.
See Also
--------
load, fromstring, fromregex
genfromtxt : Load data with missing values handled as specified.
scipy.io.loadmat : reads MATLAB data files
Notes
-----
This function aims to be a fast reader for simply formatted files. The
`genfromtxt` function provides more sophisticated handling of, e.g.,
lines with missing values.
.. versionadded:: 1.10.0
The strings produced by the Python float.hex method can be used as
input for floats.
Examples
--------
>>> from io import StringIO # StringIO behaves like a file object
>>> c = StringIO(u"0 1\n2 3")
>>> np.loadtxt(c)
array([[0., 1.],
[2., 3.]])
>>> d = StringIO(u"M 21 72\nF 35 58")
>>> np.loadtxt(d, dtype={'names': ('gender', 'age', 'weight'),
... 'formats': ('S1', 'i4', 'f4')})
array([(b'M', 21, 72.), (b'F', 35, 58.)],
dtype=[('gender', 'S1'), ('age', '<i4'), ('weight', '<f4')])
>>> c = StringIO(u"1,0,2\n3,0,4")
>>> x, y = np.loadtxt(c, delimiter=',', usecols=(0, 2), unpack=True)
>>> x
array([1., 3.])
>>> y
array([2., 4.])
numpy.loadtxt('inflammation-01.csv', delimiter = ',')array([[0., 0., 1., ..., 3., 0., 0.],
[0., 1., 2., ..., 1., 0., 1.],
[0., 1., 1., ..., 2., 1., 1.],
...,
[0., 1., 1., ..., 1., 1., 1.],
[0., 0., 0., ..., 0., 2., 0.],
[0., 0., 1., ..., 1., 1., 0.]])
def s(p):
    a = 0
    for v in p:
        a += v
    m = a / len(p)
    d = 0
    for v in p:
        d += (v - m) * (v - m)
    return numpy.sqrt(d / (len(p) - 1))

def std_dev(sample):
    sample_sum = 0
    for value in sample:
        sample_sum += value

    sample_mean = sample_sum / len(sample)

    sum_squared_devs = 0
    for value in sample:
        sum_squared_devs += (value - smaple_mean) * (value - sample_mean)

return numpy.sqrt(sum_squared_devs / (len(sample) - 1))In this lesson we discussed defensive programing strategies for python.
numbers = [1.5, 2.3, 0.7, -0.001, 4.4]
total = 0.0
for num in numbers:
    assert num > 0.0, 'Data should only contain positive valuse'
    total += num
print('total is:', total)
---------------------------------------------------------------------------
AssertionError Traceback (most recent call last)
<ipython-input-1-b465805f3afe> in <module>
2 total = 0.0
3 for num in numbers:
----> 4 assert num > 0.0, 'Data should only contain positive valuse'
5 total += num
6 print('total is:', total)
AssertionError: Data should only contain positive valuse
def normalize_rectangle(rect):
    """Normalizes a rectangle so that it is at the origin and 1.0 units long on its longest axis.
    input should be of the format (x0, y0, x1, y1).
    (x0, y0) and (x1, y1) define the lower left and upper right corners of the rectangle respectively."""
    assert len(rect) == 4, 'Rectangles must contain 4 coordinates'
    x0, y0, x1, y1 = rect
    assert x0 < x1, 'Invalid X coordinates'
    assert y0 < y1, 'Invalid Y coordinates'

    dx = x1 - x0
    dy = y1 - y0
    if dx > dy:
        scaled = dy / dx
        upper_x, upper_y = 1.0, scaled
    else:
        scaled = dx / dy
        upper_x, upper_y = scaled, 1.0

    assert 0 < upper_x <= 1.0, 'Calculated upper x coordinate invalid'
    assert 0 < upper_y <= 1.0, 'Calculated upper y coordinate invalid'

return (0, 0, upper_x, upper_y)print(normalize_rectangle( (0.0, 1.0, 2.0) ))---------------------------------------------------------------------------
AssertionError Traceback (most recent call last)
<ipython-input-3-f9d109085db1> in <module>
----> 1 print(normalize_rectangle( (0.0, 1.0, 2.0) ))
<ipython-input-2-c598d5ccfcc0> in normalize_rectangle(rect)
3 input should be of the format (x0, y0, x1, y1).
4 (x0, y0) and (x1, y1) define the lower left and upper right corners of the rectangle respectively."""
----> 5 assert len(rect) == 4, 'Rectangles must contain 4 coordinates'
6 x0, y0, x1, y1 = rect
7 assert x0 < x1, 'Invalid X coordinates'
AssertionError: Rectangles must contain 4 coordinates
print(normalize_rectangle( (4.0, 2.0, 1.0, 5.0) ))---------------------------------------------------------------------------
AssertionError Traceback (most recent call last)
<ipython-input-4-f7e0d48bdfd0> in <module>
----> 1 print(normalize_rectangle( (4.0, 2.0, 1.0, 5.0) ))
<ipython-input-2-c598d5ccfcc0> in normalize_rectangle(rect)
5 assert len(rect) == 4, 'Rectangles must contain 4 coordinates'
6 x0, y0, x1, y1 = rect
----> 7 assert x0 < x1, 'Invalid X coordinates'
8 assert y0 < y1, 'Invalid Y coordinates'
9
AssertionError: Invalid X coordinates
print(normalize_rectangle( (0.0, 0.0, 1.0, 5.0)))(0, 0, 0.2, 1.0)
print(normalize_rectangle( (0.0, 0.0, 5.0, 1.0)))(0, 0, 1.0, 0.2)
In this lesson we learned how to transcribe DNA to RNA using python.
# Prompt the user the fasta filename

input_file_name = input("Enter the name of the input fasta file: ")
Enter the name of the input fasta file: SUMO.txt
# Open the input fasta file and read the DNA seqence

with open(input_file_name, "r") as input_file:
    dna_sequence = ""
    for line in input_file:
        if line.startswith(">"):
            continue
        dna_sequence += line.strip()
# Transcribe the DNA to RNA
rna_sequence = ""
for nucleotide in dna_sequence:
if nucleotide == "T":
rna_sequence += "U"
else:
rna_sequence += nucleotide# Prompt the user to enter the output file name
output_file_name = input("Enter the name of the output file: ")Enter the name of the output file: SUMO.txt
# Save the RNA sequence to a text file
with open(output_file_name, "w") as output_file:
    output_file.write(rna_sequence)
    print("The RNA sequence has been saved to {output_file_name}")
The RNA sequence has been saved to {output_file_name}
print(rna_sequence)AUGUCUGACGAAAAGAAGGGAGGUGAGACCGAGCACAUCAACCUGAAGGUCCUCGGCCAGGACAACGCCGUCGUCCAGUUCAAGAUCAAGAAGCACACACCCUUGAGGAAGCUGAUGAACGCCUACUGCGACCGUGCCGGACUCUCCAUGCAGGUGGUGCGCUUCCGUUUCGACGGACAGCCCAUCAACGAGAACGACACUCCGACCUCGCUGGAGAUGGAGGAGGGCGACACCAUCGAGGUUUACCAGCAGCAGACUGGUGGCGCUCCAUAAAUGUCUGACGAAAAGAAGGGAGGUGAGACCGAGCACAUCAACCUGAAGGUCCUCGGCCAGGACAACGCCGUCGUCCAGUUCAAGAUCAAGAAGCACACACCCUUGAGGAAGCUGAUGAACGCCUACUGCGACCGUGCCGGACUCUCCAUGCAGGUGGUGCGCUUCCGUUUCGACGGACAGCCCAUCAACGAGAACGACACUCCGACCUCGCUGGAGAUGGAGGAGGGCGACACCAUCGAGGUUUACCAGCAGCAGACUGGUGGCGCUCCAUAA
In this lesson we learned how to translate RNA sequences into protein using python.
# Prompt the user to enter the input RNA file name

input_file_name = input("Enter the name of the input RNA file:")
Enter the name of the input RNA file: SUMO.txt
# Open the input RNA file and read teh RNA sequence

with open(input_file_name, "r") as input_file:
    rna_sequence = input_file.read().strip()
# Define the codon table
codon_table = {
"UUU": "F", "UUC": "F", "UUA": "L", "UUG": "L",
"CUU": "L", "CUC": "L", "CUA": "L", "CUG": "L",
"AUU": "I", "AUC": "I", "AUA": "I", "AUG": "M",
"GUU": "V", "GUC": "V", "GUA": "V", "GUG": "V",
"UCU": "S", "UCC": "S", "UCA": "S", "UCG": "S",
"CCU": "P", "CCC": "P", "CCA": "P", "CCG": "P",
"ACU": "T", "ACC": "T", "ACA": "T", "ACG": "T",
"GCU": "A", "GCC": "A", "GCA": "A", "GCG": "A",
"UAU": "Y", "UAC": "Y", "UAA": "*", "UAG": "*",
"CAU": "H", "CAC": "H", "CAA": "Q", "CAG": "Q",
"AAU": "N", "AAC": "N", "AAA": "K", "AAG": "K",
"GAU": "D", "GAC": "D", "GAA": "E", "GAG": "E",
"UGU": "C", "UGC": "C", "UGA": "*", "UGG": "W",
"CGU": "R", "CGC": "R", "CGA": "R", "CGG": "R",
"AGU": "S", "AGC": "S", "AGA": "R", "AGG": "R",
"GGU": "G", "GGC": "G", "GGA": "G", "GGG": "G"
}# Translate RNA to protein
protein_sequence = " "
for i in range(0, len(rna_sequence), 3):
codon = rna_sequence[i:i+3]
if len(codon) == 3:
amino_acid = codon_table[codon]
if amino_acid == "*":
break
protein_sequence += amino_acid# Prompt the user to enter the output fiel name
output_file_name = input("Enter the name of the output file: ")Enter the name of the output file: SUMO.txt
# Save the protein sequence to a text file

with open (output_file_name, "w") as output_file:
    output_file.write(protein_sequence)
    print(f"The protein sequence has been saved to {output_file_name}")
The protein sequence has been saved to SUMO.txt
print(protein_sequence) MSDEKKGGETEHINLKVLGQDNAVVQFKIKKHTPLRKLMNAYCDRAGLSMQVVRFRFDGQPINENDTPTSLEMEEGDTIEVYQQQTGGAP